Ethereum is slowly losing momentum after recording a 2-year high at $445 earlier this week. Will $400 get confirmed as support before the bulls will continue?
Against Bitcoin, Ethereum managed to reach as high as 0.0371 BTC before rolling over to the current 0.0356 BTC level.
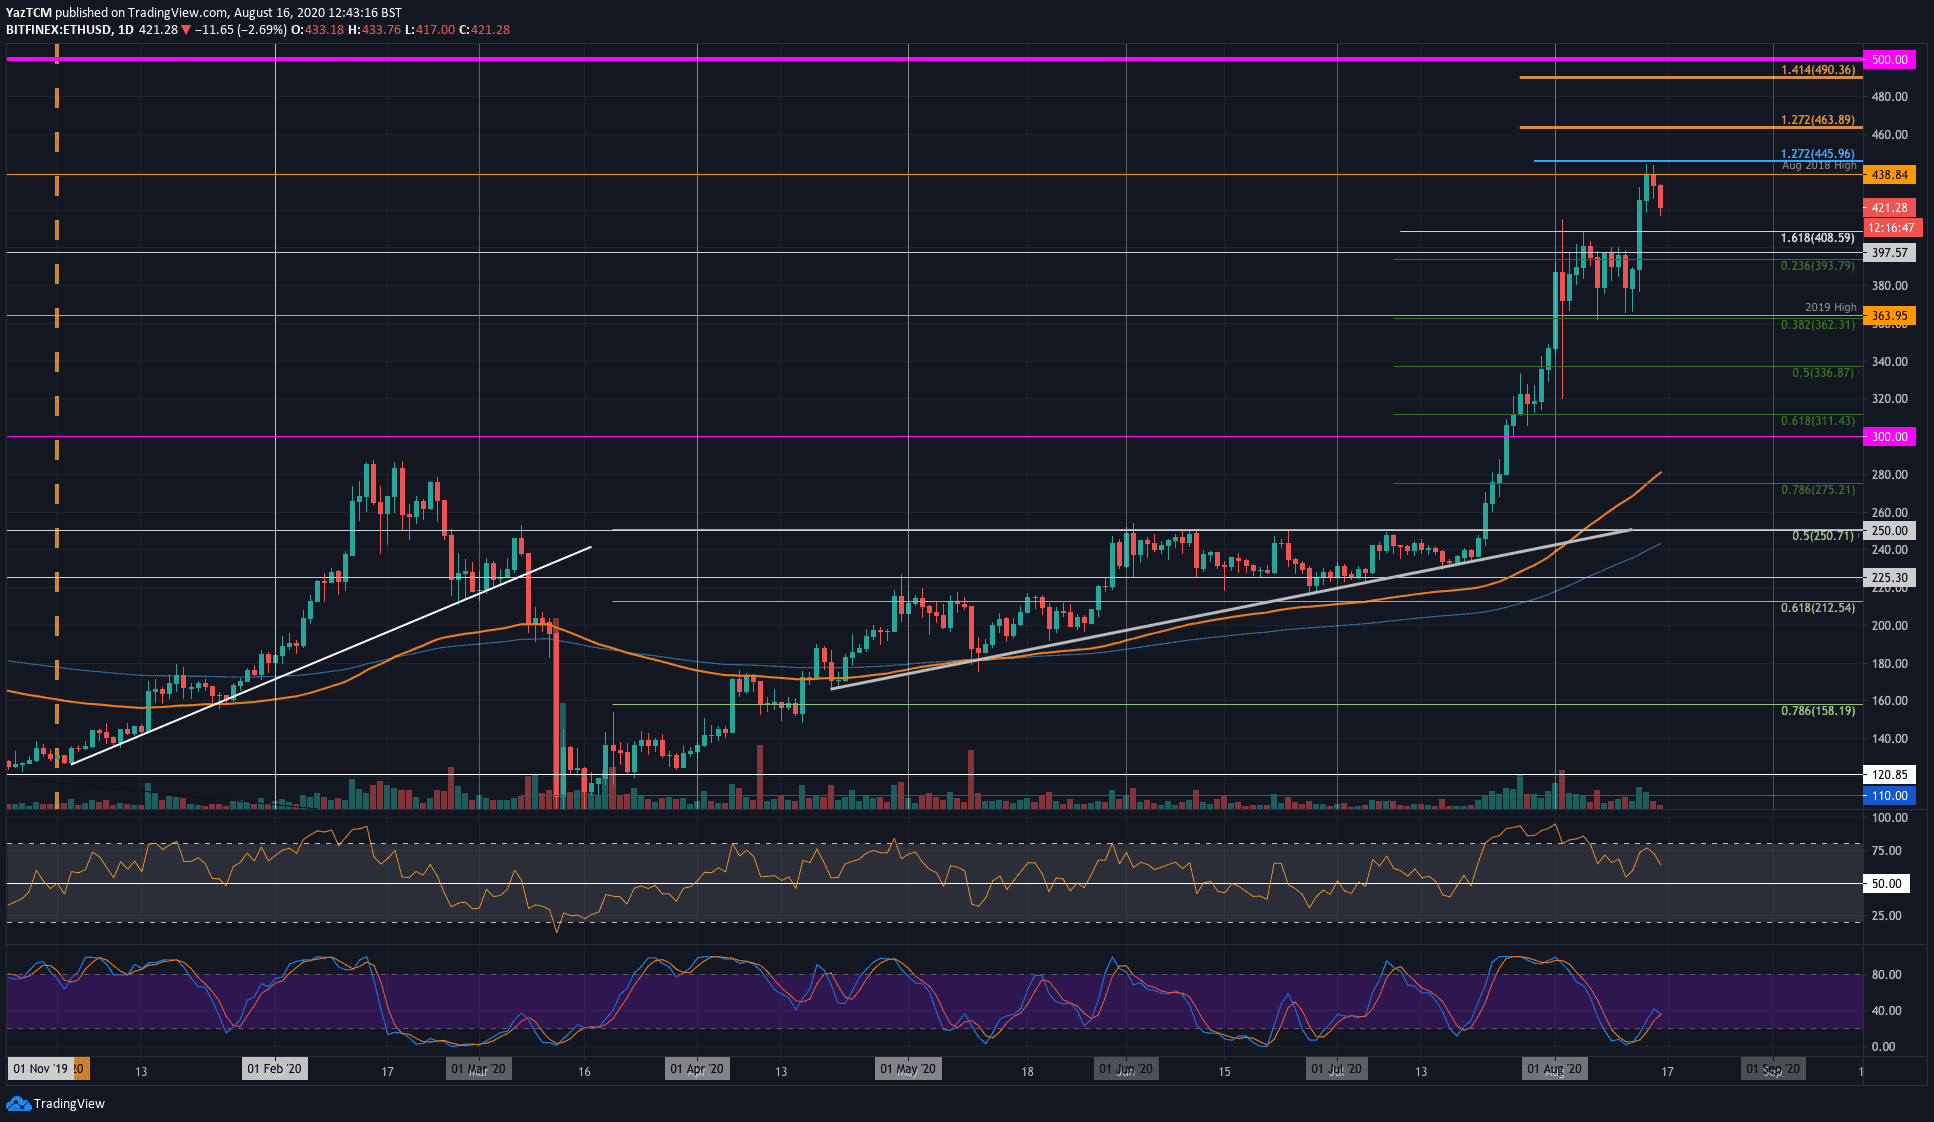
Key Support Levels: $410, $400, $380.
Key Resistance Levels: $438, $445, $465.
Quick recap: after days’ long consolidation beneath the $400 mark, ETH was finally able to break above the milestone resistance as it pushed higher to reach the $445 level (1.272 Fib Extension).
Over the weekend, and as of writing these lines, Ethereum fell lower from the resistance at $438 as it even reached below the $420 level today. This price drop has been accompanied by a slight decrease in volume during the weekend, compared to the past week’s volume.
Looking ahead, if the bulls can rebound at $420, the first level of support to resistance lies at $438. Beyond this, resistance is expected at $445 (current 2020 high, followed by $450), $465 (1.272 Fib Extension), $490 (1.414 Fib Extension), and $500.
On the other side, if the sellers continue to push lower, support can be found at $410, $400, and $380. Further support lies at $364 (2019 high).
The RSI has dropped from extremely overbought conditions at the beginning of August. It is pointing downward, which suggests that the bullish momentum is fading away; however, so long as it can remain above the mid-line, then the bulls will stay in control of the market momentum.
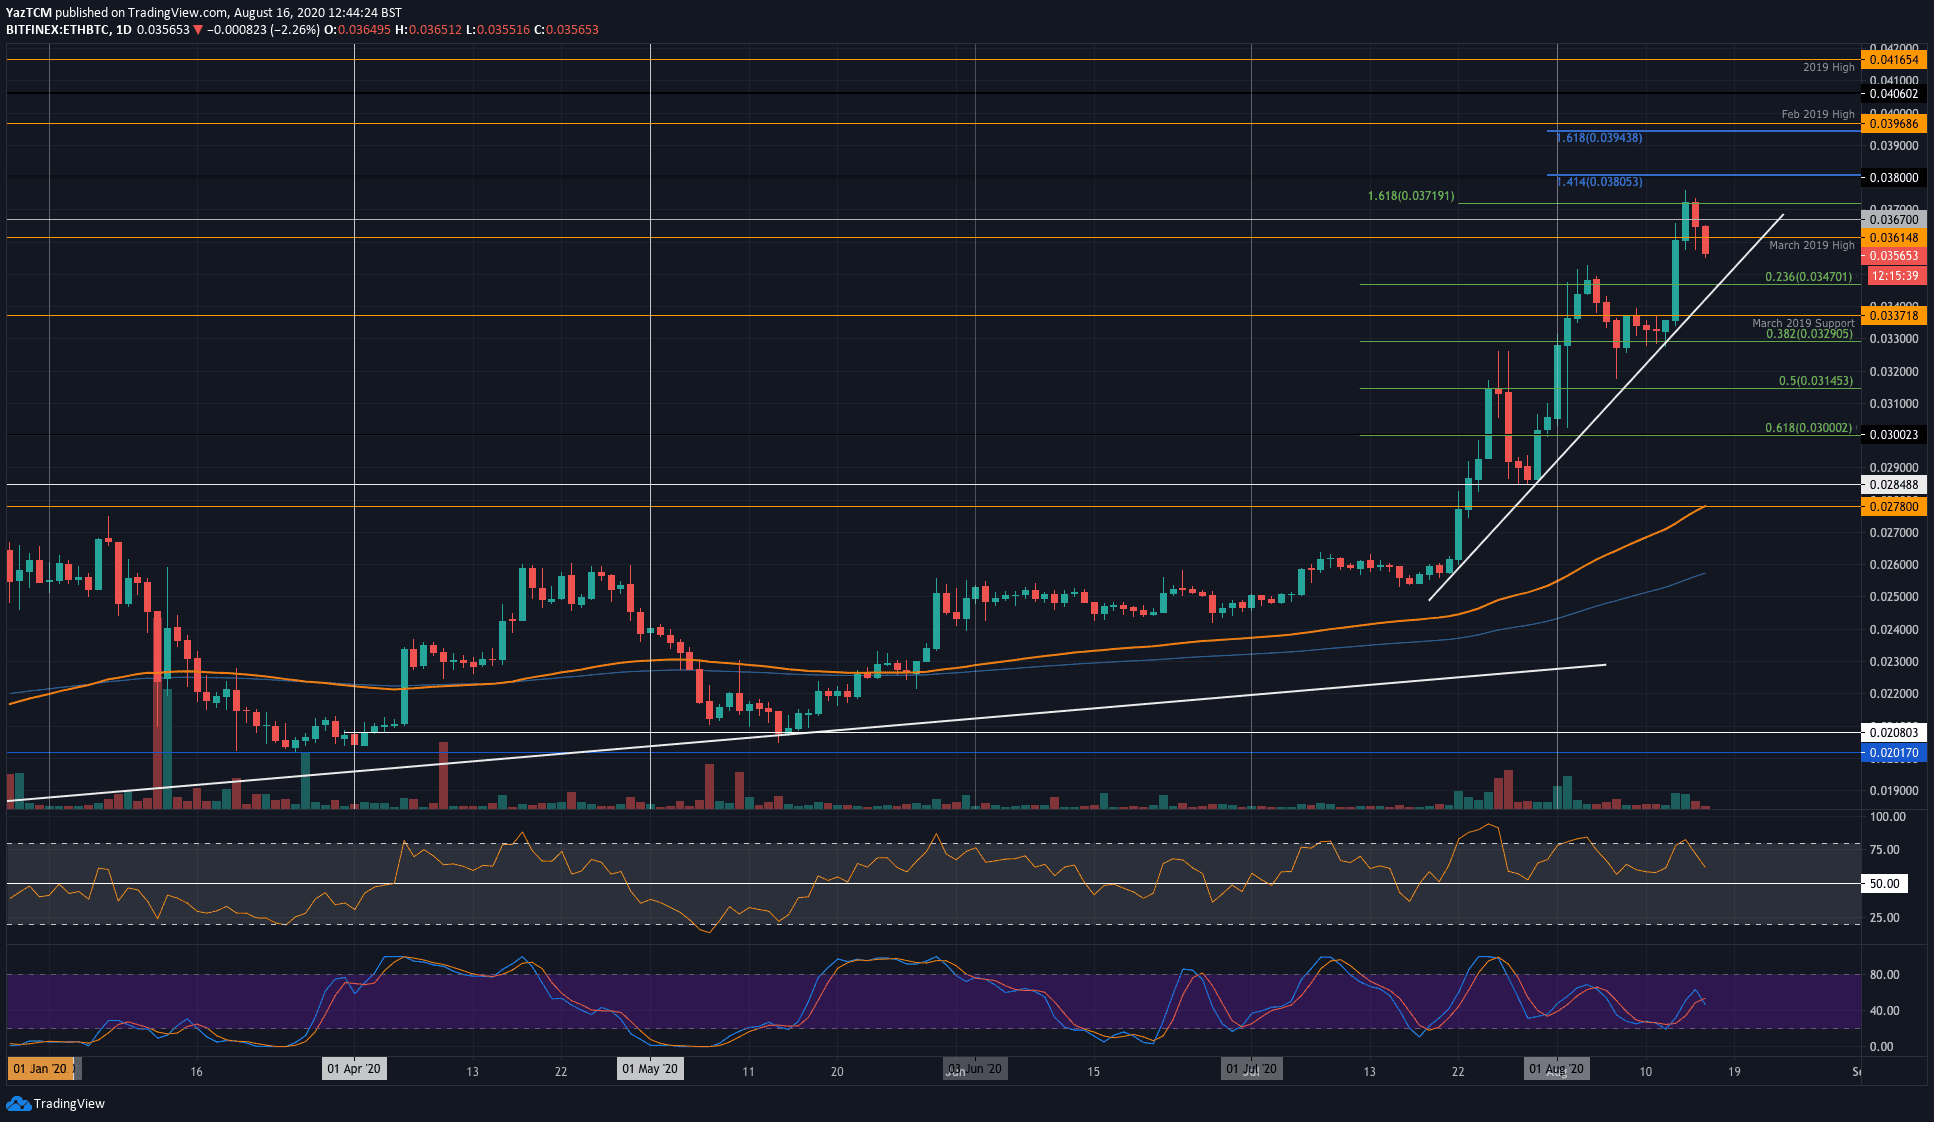
Key Support Levels: 0.0347 BTC, 0.0337 BTC, 0.0329 BTC.
Key Resistance Levels: 0.0361 BTC, 0.0371 BTC, 0.038 BTC.
Against Bitcoin, Ethereum also managed to push higher on Friday to break March 2019’s high and reach the 0.0371 BTC level (1.617 Fib Extension). However, just like against USD, ETH couldn’t hold and decreased to the next support at 0.0356 BTC.
Likewise, this recent price decline has been accompanied by a small drop in trading volume over the weekend. This could also turn into a bullish sign – high volume of buyers, low volume of sellers.
Looking ahead, if the sellers do push lower, the first level of support is expected at 0.0347 BTC (.236 Fib Retracement). This support is further bolstered by a steeply rising trend line that has been in play since mid-July. Beneath the trend line, added support lies at 0.0337 BTC (March 2019 support) and 0.0329 BTC (.382 Fib Retracement).
On the other side, if the buyers can break the March 2019 highs at 0.0361 BTC again, resistance is expected at 0.0371 BTC (1.618 Fib Extension – green), 0.038 BTC (1.414 Fib Extension – blue), and 0.04 BTC (Feb 2019 Highs).
Likewise, the RSI has dropped from overbought conditions but remains above the 50 line as the buyers control the momentum.