Crypto News
4 years ago

Ethereum (ETH) Price Analysis Feb.14: Ethereum Consolidates Around $120. What’s Next?

Yaz Sheikh Feb 14, 2019 15:49

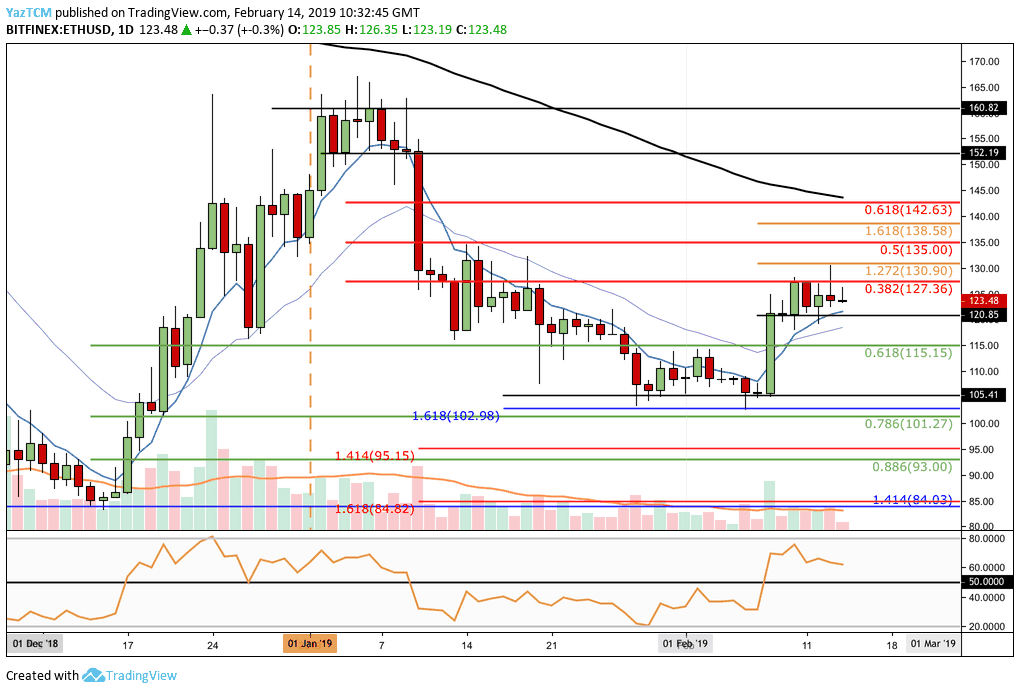
Ethereum has now seen a modest price increase totaling over 16% throughout the past week. The cryptocurrency currently trades for approximately $120, after suffering from a 30% price fall over the past 90 days. This consolidation is aligned with the recent price moves of Bitcoin.

Looking at the ETH/USD 1- Day Chart:

  • After bouncing from support level at $105.41, ETH/USD had experienced a price surge that drove the market up to a high of $127.36.
    The market had reached resistance at a bearish .382 Fibonacci Retracement level (marked in red). This Fibonacci Retracement is measured from the high of January 2019 to the low of February 2019.
  • Price action has now formed a trading range between $127.36 and $120.85, from below.
  • The nearest support is located at the bottom of the above range at $120.85, whereas the next short-term support at .618 Fibonacci Retracement level (marked in green) located at $115.15.
  • Support below this lies at $105.4, $102.98 and psychological level of $100.
  • From Above: The nearest resistance is located at the top of the trading range at $127.36.
  • This is followed with resistance at a short term 1.272 Fibonacci Extension level (marked in orange) located at $130, and the bearish .5 Fibonacci Retracement level (marked in red) located at $135.
  • The RSI indicator remains above 50 which indicates that the bulls are still in control of the market’s momentum.
  • The trading volume is slowly decreasing over the past few days.

Looking at the ETH/BTC 1-Day Chart:

  • The price action had found support at the 0.030143 BTC level, and from there rebounded throughout February 2019.
  • The rebound brought the coin up to resistance at the 0.034 BTC level. This resistance extends back to November 2018 and also resistance from a bearish .382 Fibonacci Retracement level (marked in red).
  • The market has now established a tight trading range between 0.034212 BTC and 0.033112 BTC.
  • From Below: Support lies at 0.032292 BTC and then 0.032000 BTC.
  • Further support beneath can be located at the .618 (0.031425 BTC) and .786 (0.030683 BTC) Fibonacci Retracement levels (marked in green).
  • From Above: Resistance above the range lies at 0.035089 BTC and 0.035543 BTC.
  • Higher resistance lies at the short-term 1.414 Fibonacci Extension level (marked in orange) at 0.035999 BTC and the bearish .618 Fibonacci Retracement level (marked in red) at 0.03696.
  • The RSI remains above 50 as the bulls maintain control of the market momentum. However, the RSI looks very fragile.
  • Trading volume remains at a steady average level.

SPECIAL OFFER (Sponsored)
LIMITED OFFER 2024 for CryptoPotato readers at Bybit: Use this link to register and open a $500 BTC-USDT position on Bybit Exchange for free!


Disclaimer: Information found on CryptoPotato is those of writers quoted. It does not represent the opinions of CryptoPotato on whether to buy, sell, or hold any investments. You are advised to conduct your own research before making any investment decisions. Use provided information at your own risk. See Disclaimer for more information.

Cryptocurrency charts by TradingView.
Share This Article
Yaz Sheikh

Yaz is a cryptocurrency technical analyst with over seven years of technical analysis trading experience. As an Economics graduate, he has taken a keen interest in the future potentials of blockchain in the financial industry. Removing crypto from the equation, Yaz loves to watch his favorite football team and keep up-to-date with the latest fights within the UFC.