Ethereum’s price has been stuck in a state of indecision between buyers and sellers, resulting in small candle formations and steady consolidation over the past few months.
However, ETH faces a crucial price region that could potentially determine its short-term trajectory.
By Shayan
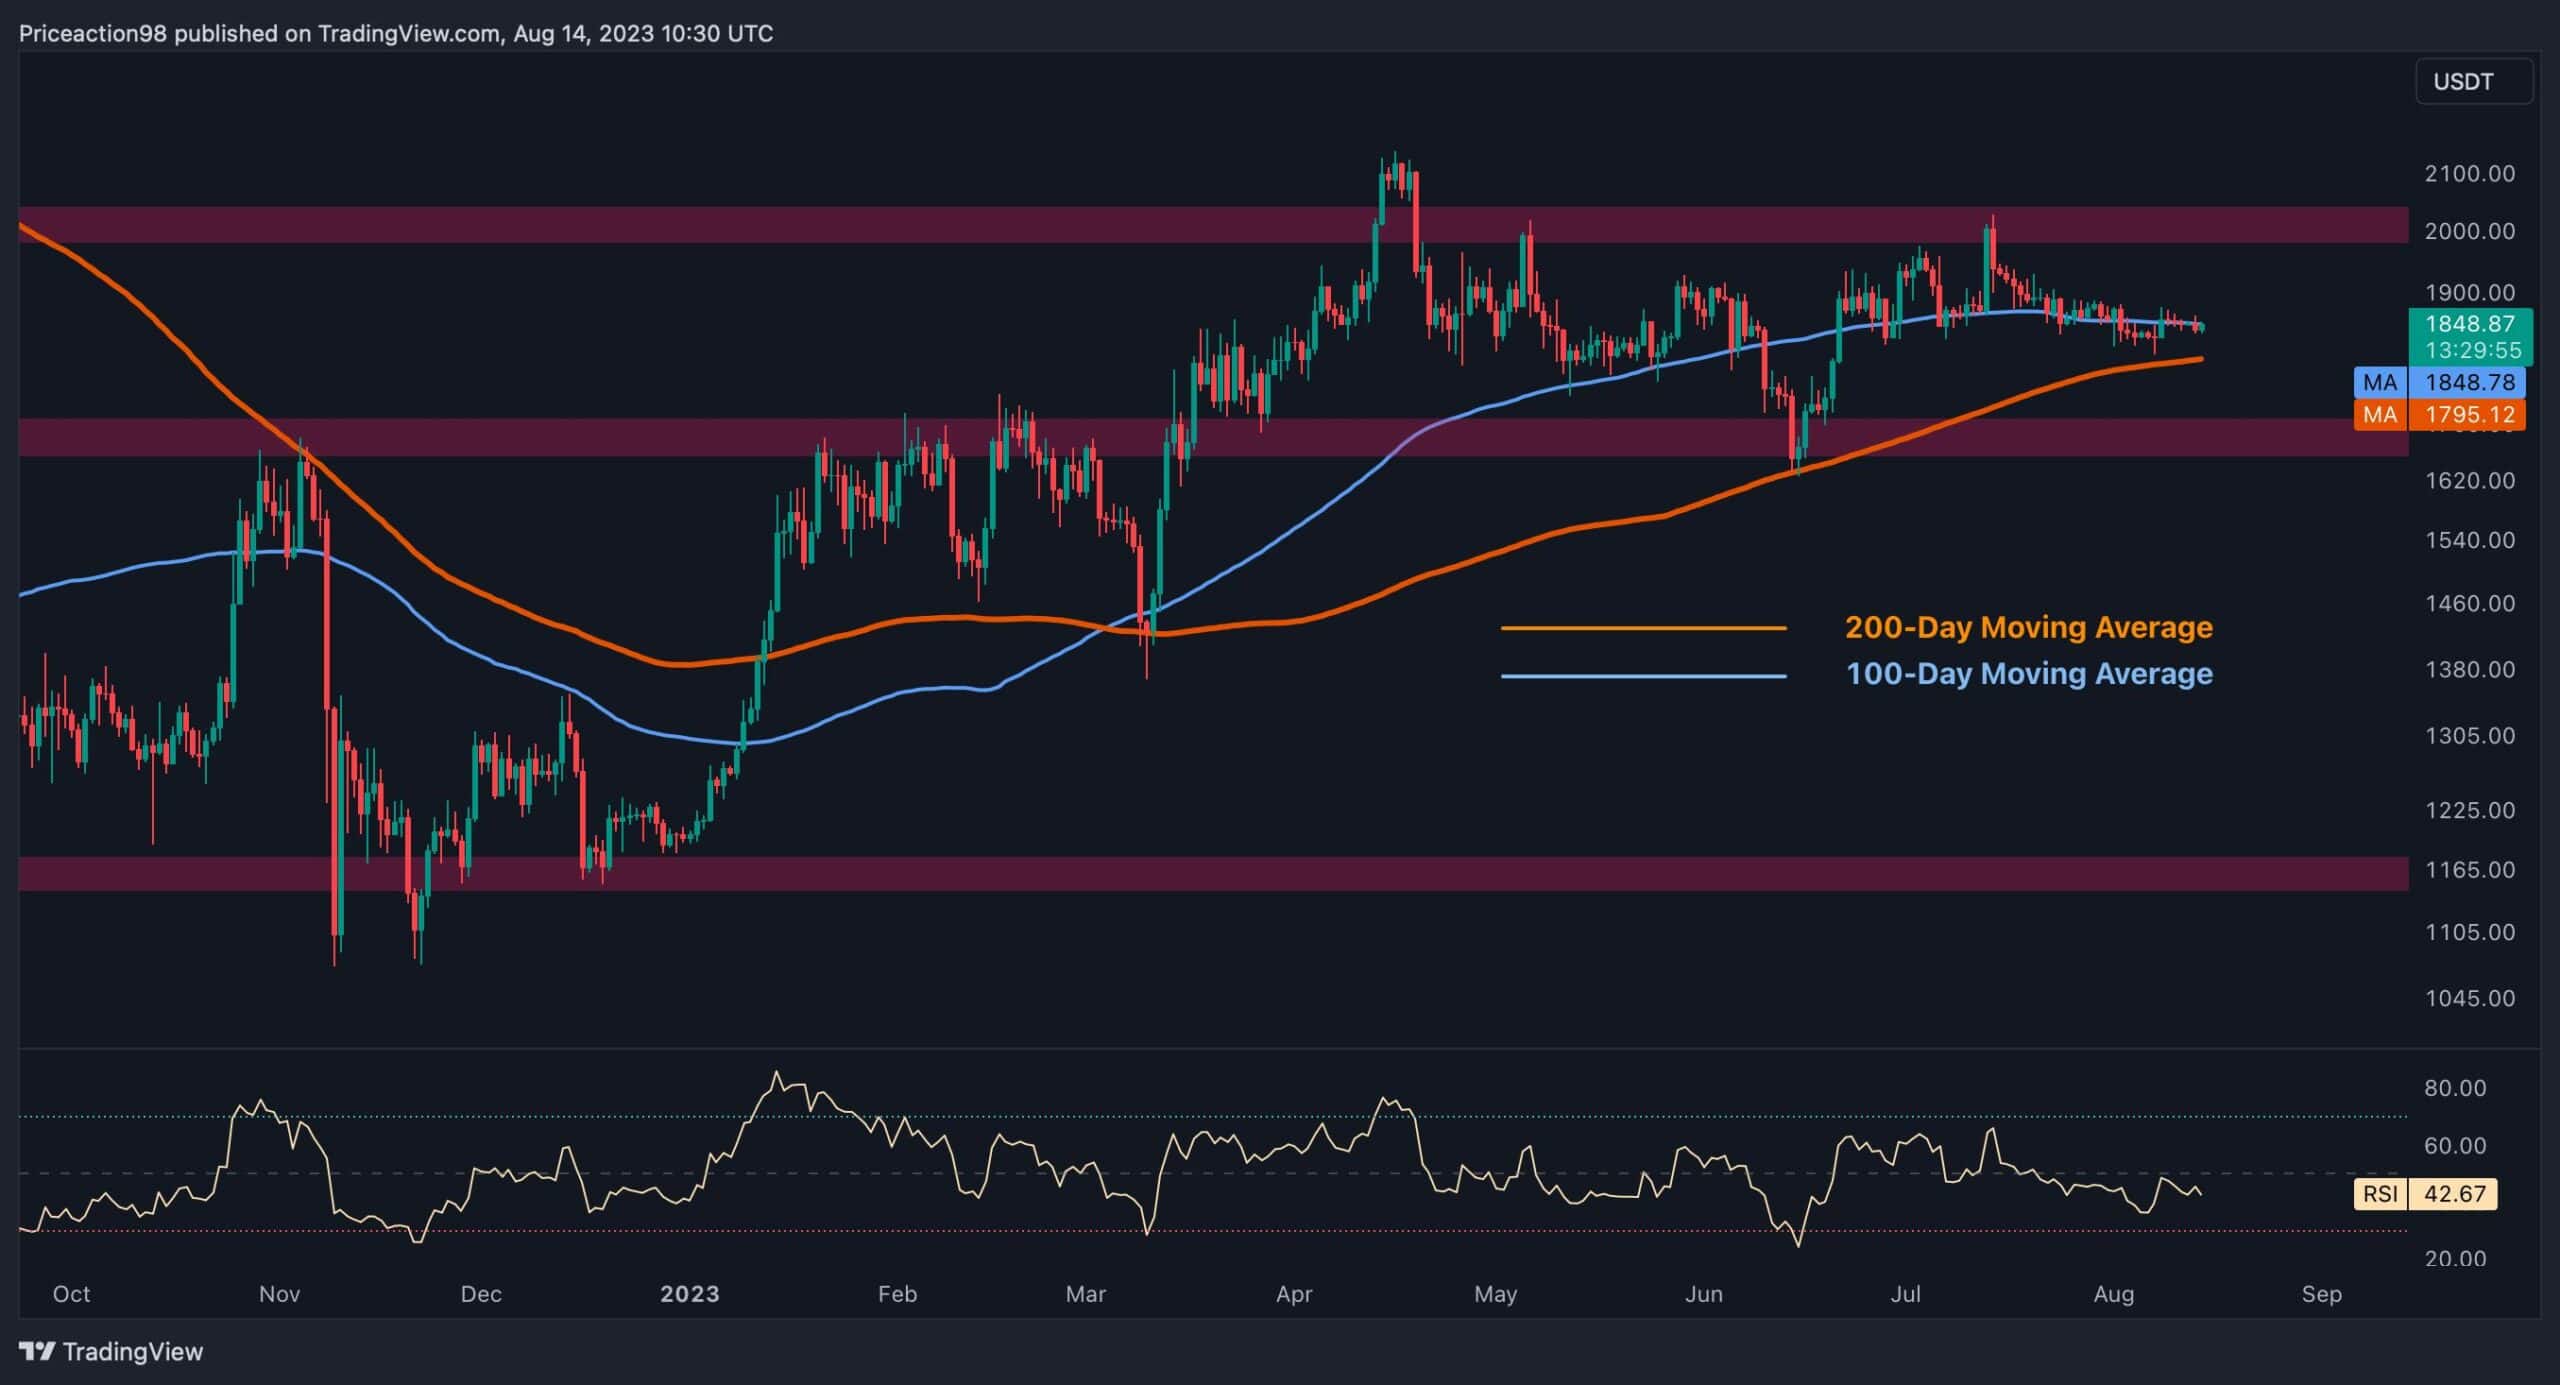
Ethereum’s price has been struggling with the 100-day moving average for an extended period of time. The price action has remained subdued and characterized by small candle formations lacking a distinct directional bias.
A significant support zone has emerged, encompassing the 100-day and 200-day moving averages at $1850 and $1792, respectively. If the price finds support within this range, it could trigger a strong upward movement, aiming to breach the $2K resistance level.
Conversely, if selling pressure escalates and the price drops below the moving averages, it could potentially initiate a cascade effect, driving Ethereum’s value toward the noteworthy support zone at $1.7K. In the broader context, the cryptocurrency appears to be moving within a range, fluctuating between the price levels of $2K and $1.7K. A decisive breakout from this pivotal price range is likely to define Ethereum’s overarching long-term trend.
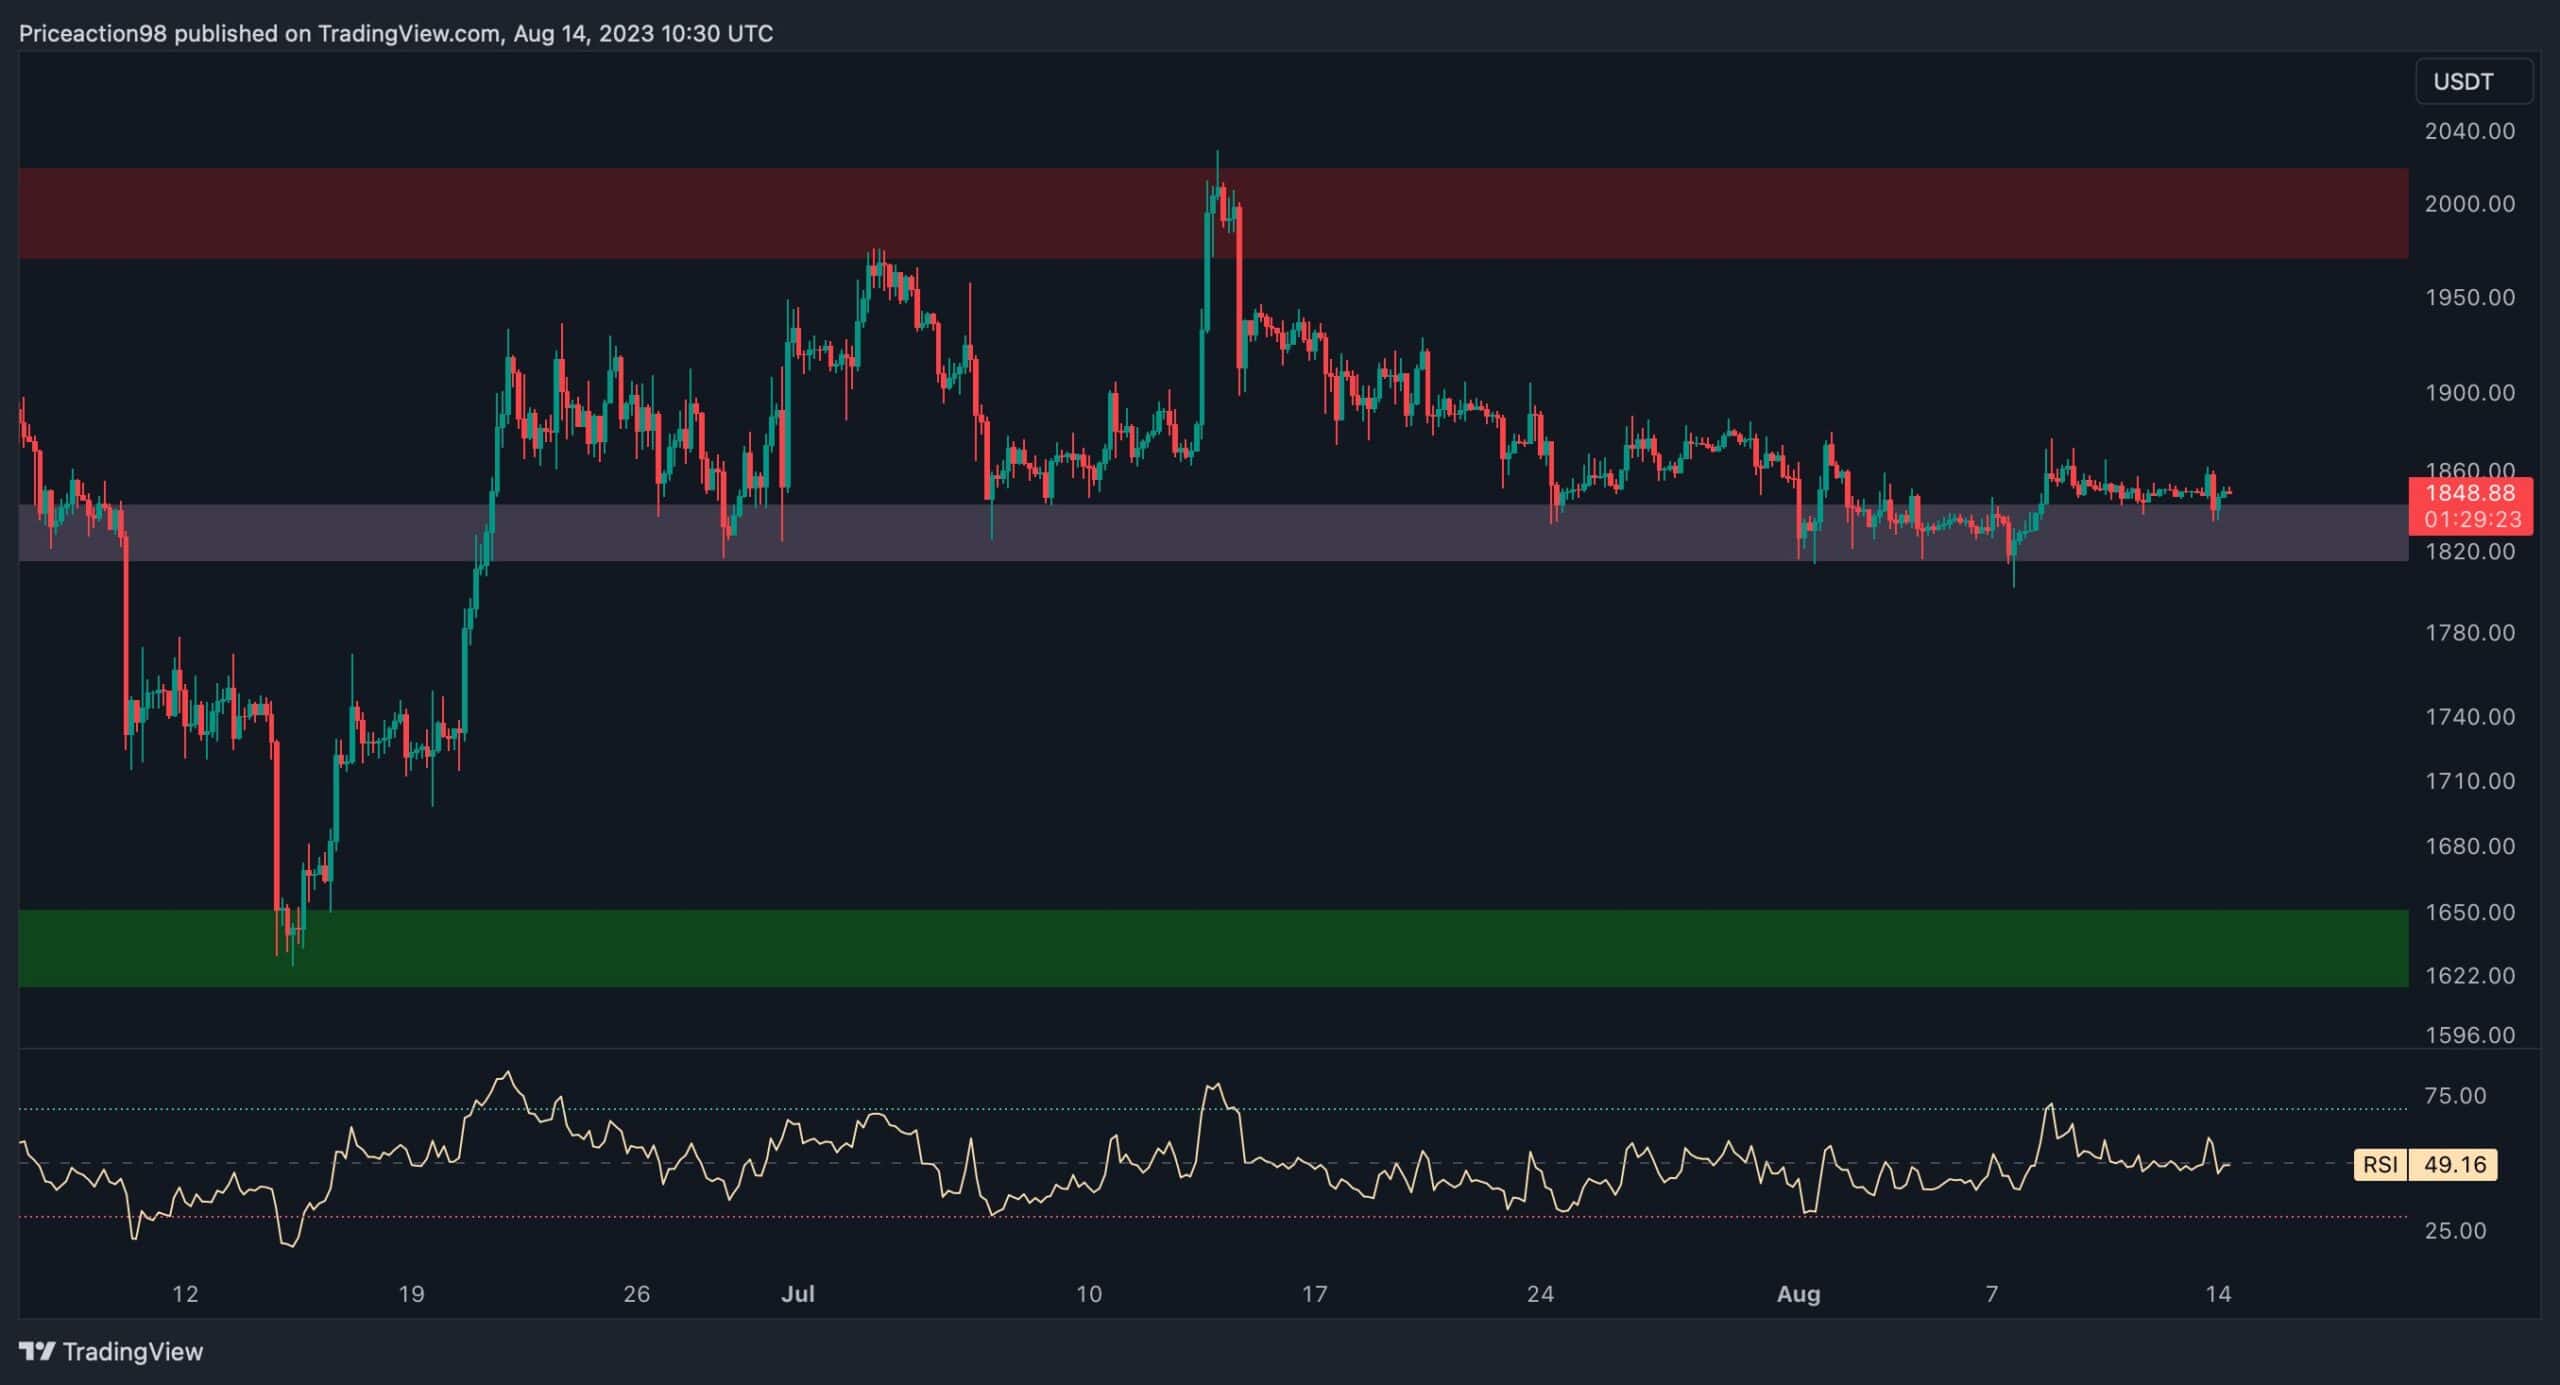
Zooming in on the 4-hour timeframe, ETH appears to be confined within a narrower range, with substantial resistance at $2K and a minor support area around $1.8K.
The current price action indicates an attempt to breach the lower threshold of this range. However, the static support at $1.8K has played a significant role in preventing further downward movement. Notably, when the price approached this level, it triggered the formation of bullish candles and a minor rebound.
If this specific price zone continues to provide support, it could facilitate a significant upward surge, with the potential to retest the substantial resistance at $2K. Conversely, if selling pressure intensifies and breaks through this support, ETH might experience a decline toward the major support level at $1.7K.
In either scenario, ETH’s long-term outlook will remain uncertain until a decisive breakout occurs beyond the initial range defined by the $2K and $1.7K price boundaries.
By Shayan
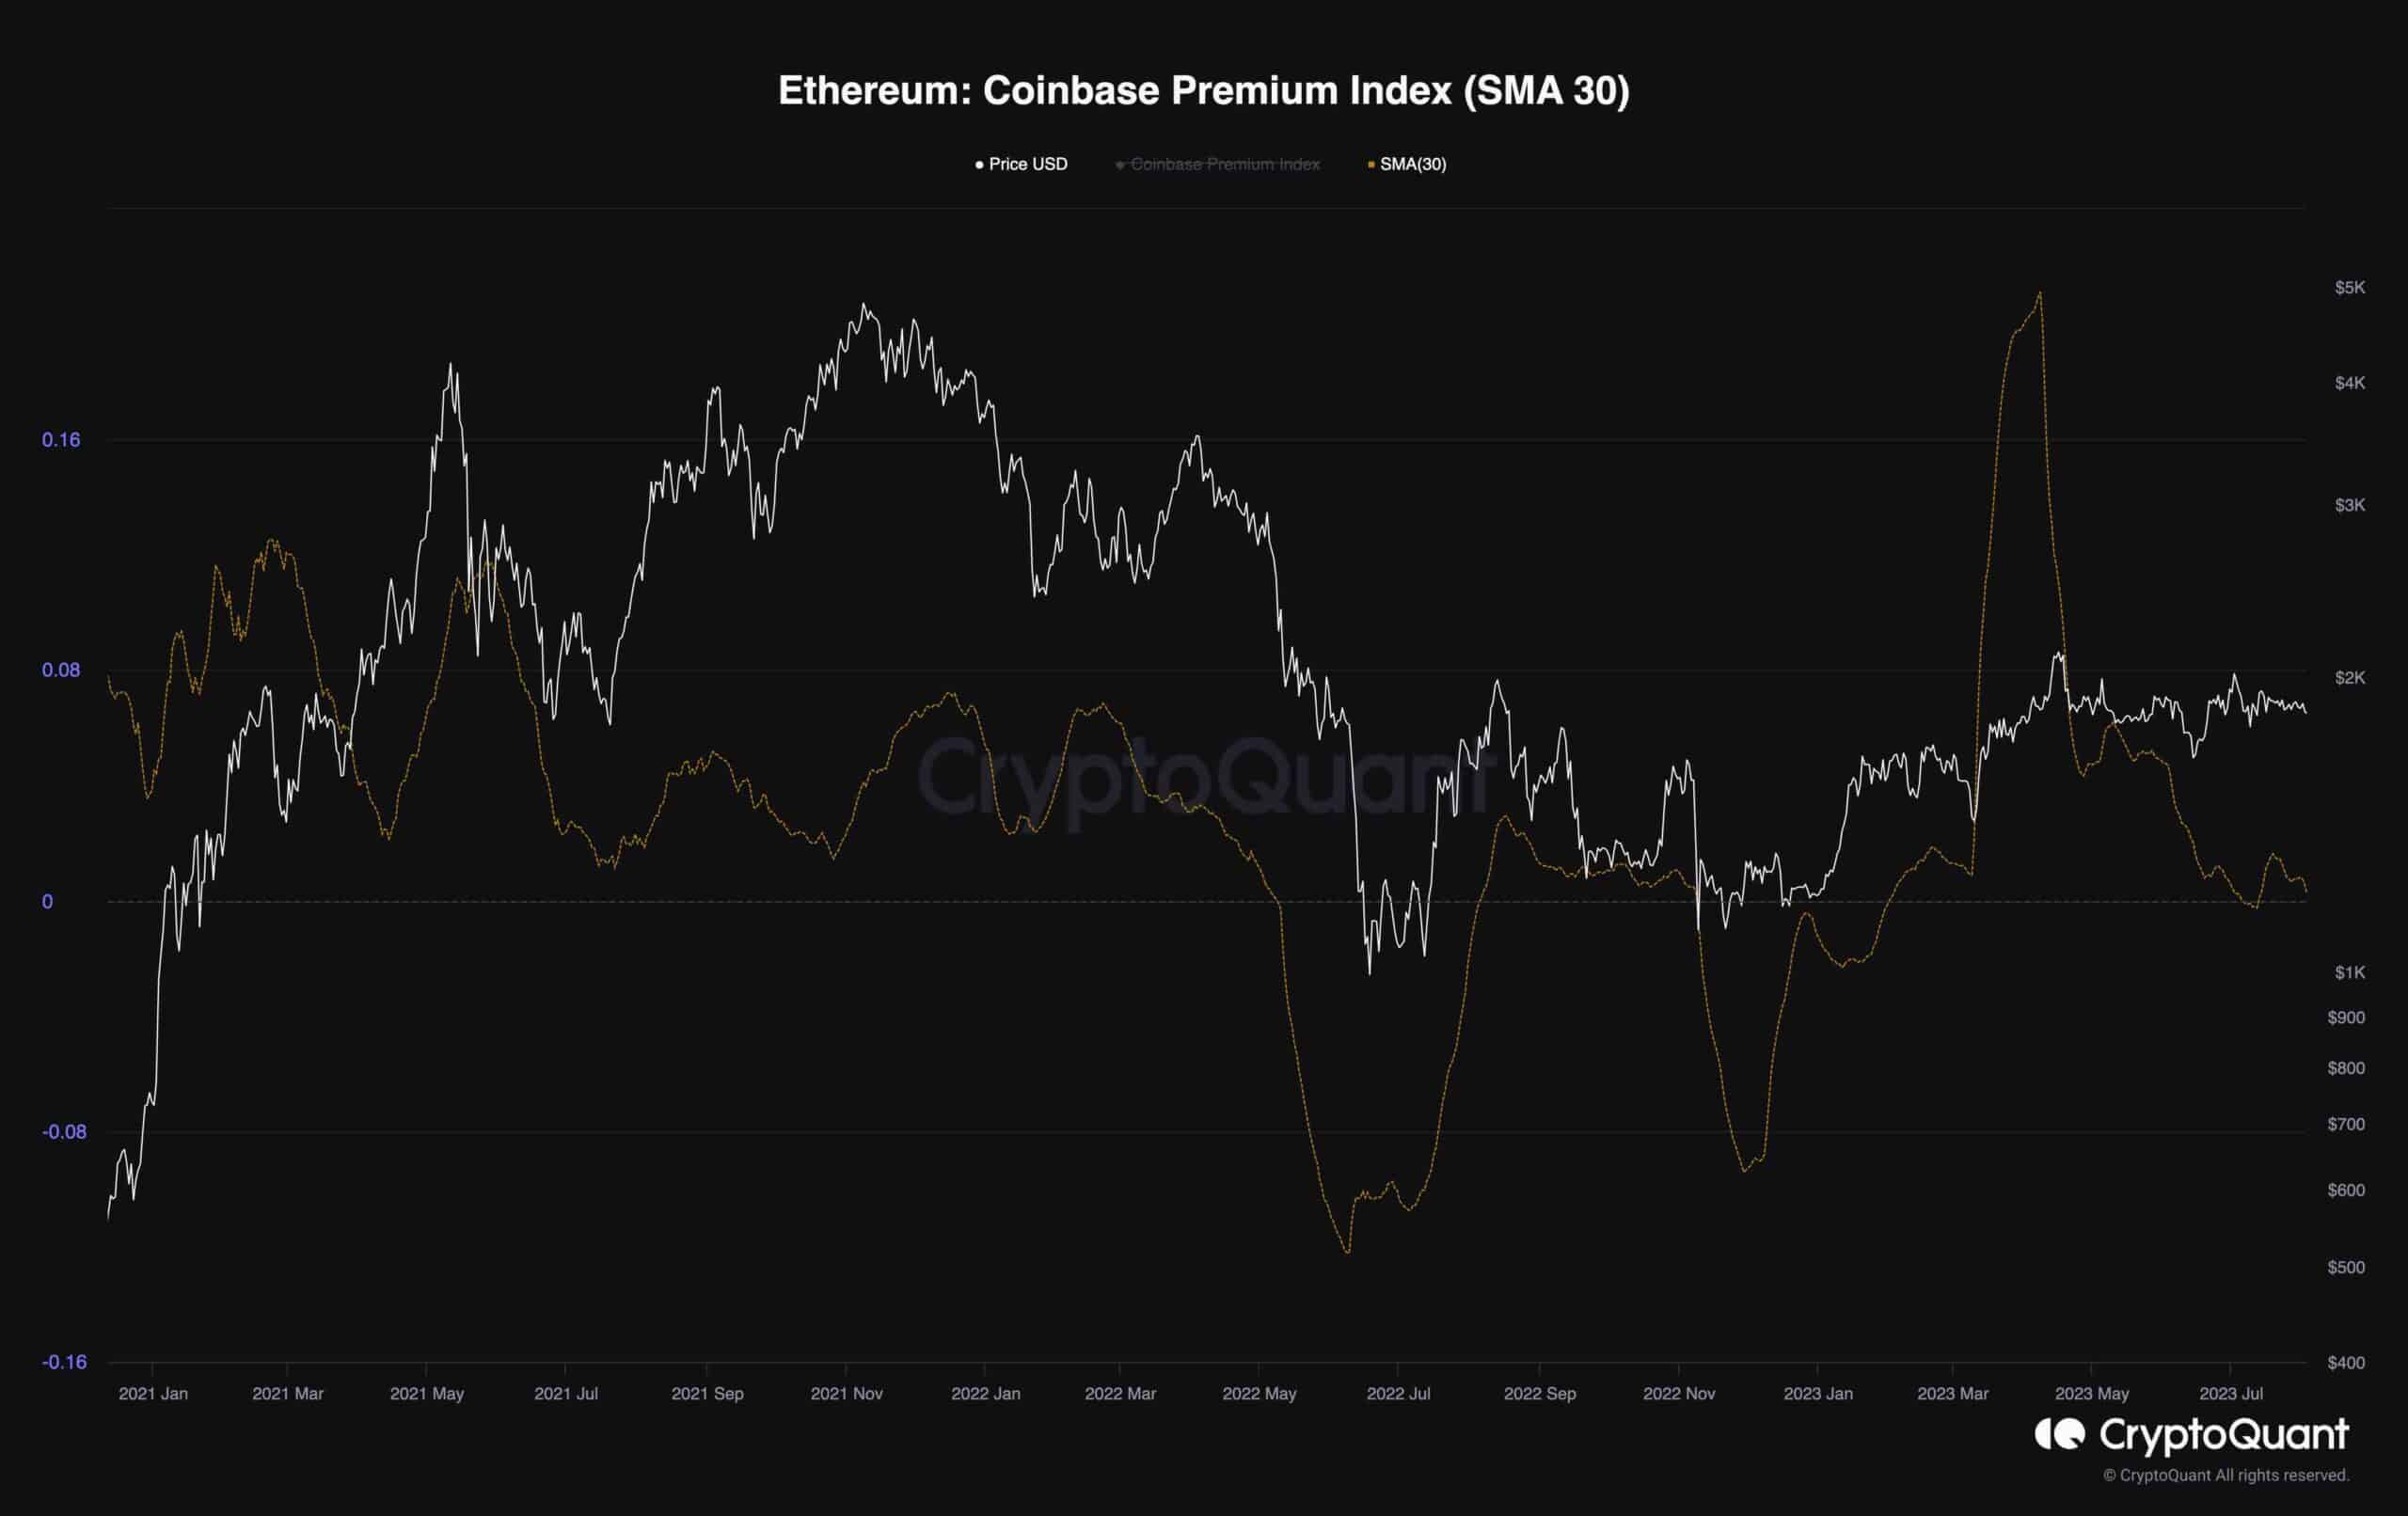
Ethereum’s price action has been relatively silent in recent months, with consolidation occurring around the $2,000 mark. However, noteworthy developments have been unfolding behind the scenes.
The provided chart illustrates the Ethereum Coinbase Premium Index, featuring the inclusion of a 30-day moving average. This particular measure is calculated by analyzing the price difference between ETH on Coinbase and Binance, the two most prominent global exchanges. The significance of this metric lies in its capacity to indicate whether U.S. investors are collectively engaged in purchasing or selling compared to others. Positive readings suggest a surge in buying interest originating from the United States.
As depicted in the chart, there has been a substantial shift in sentiment within the U.S. market, as evidenced by the noticeable downward trend in the premium index. This alteration in sentiment holds significance due to the fact that numerous U.S. investors are wealthy individuals or institutional entities.
This behavior might cast a pessimistic light on ETH’s prospects, implying that these investors might not be inclined to accumulate ETH within this price range, possibly signifying a bearish sentiment prevailing in the market.