The crypto market is recovering from its recent sharp collapse. Altcoins and ETH have outperformed Bitcoin in recent days. Buyers were able to keep the price above $1,000. But can this upward trend last longer considering the macro?
By Grizzly
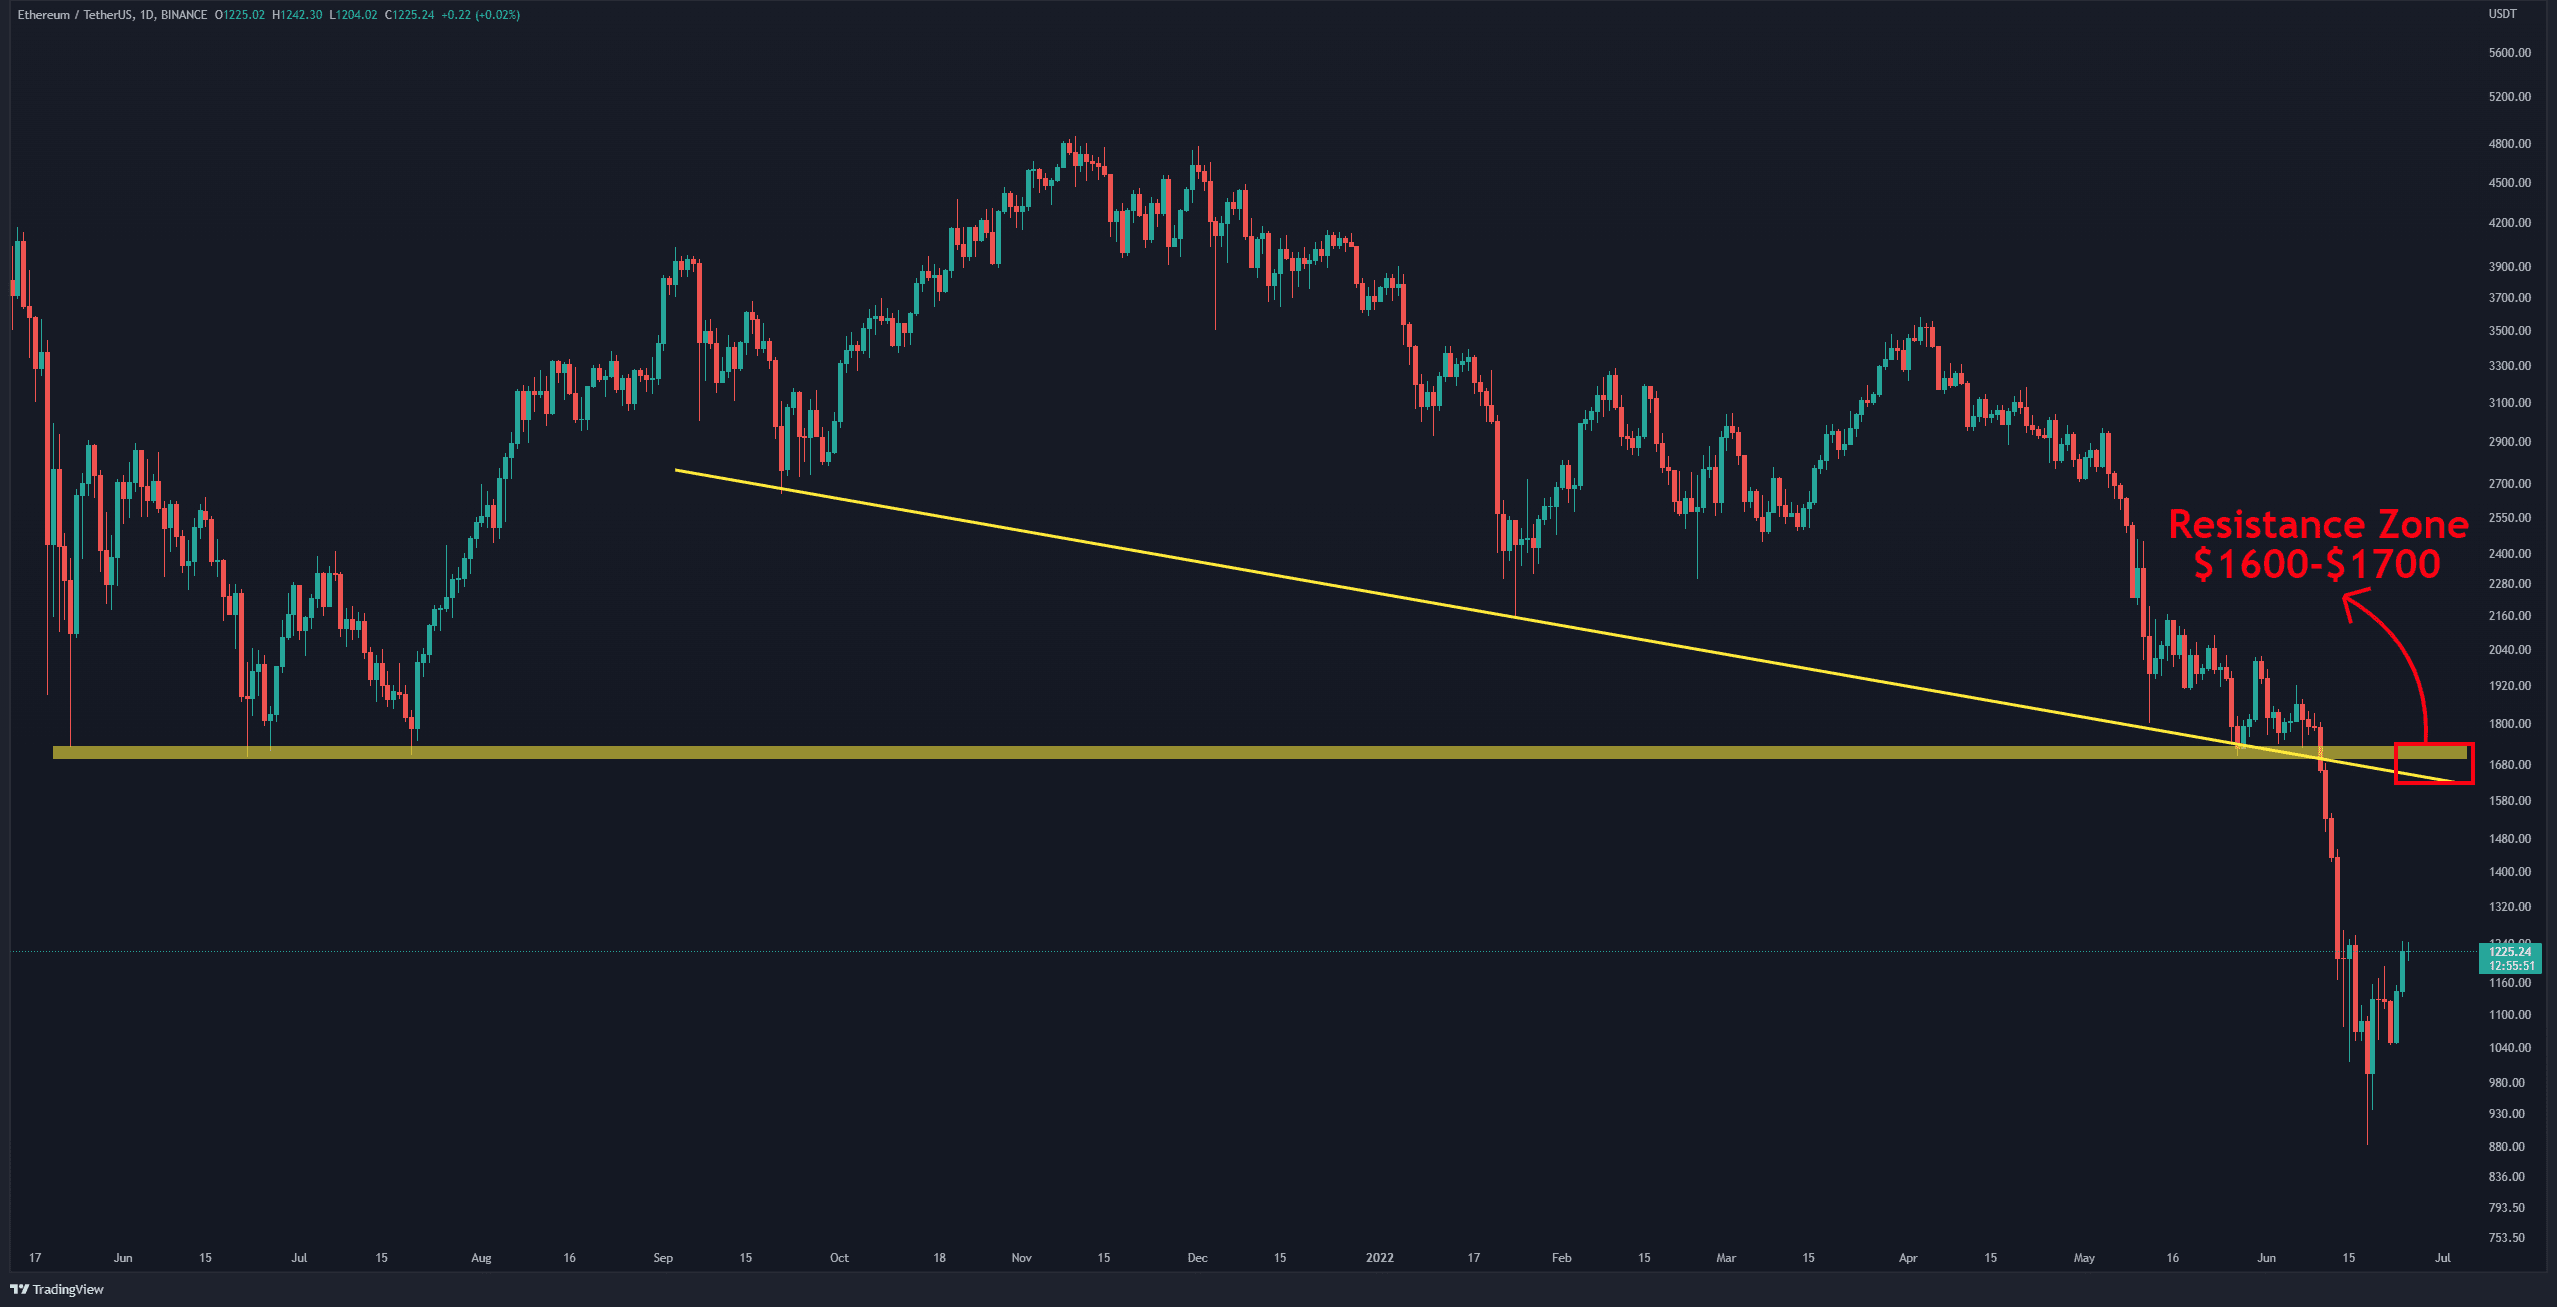
Ether has broken down significant support levels on the daily timeframe, which are now acting as resistance. Horizontal levels at $1,300, $1,500 and $1,700 are a the potential challenge for the ETH recovery. In the meantime, the intersection of the descending line and horizontal resistance (in yellow) at $1,700 has created a resistance zone (in red). Suppose the bulls are still determined to control the market in the short term. In that case, the range between $1600 and $1700 appears to be a strong barrier.
In the bearish scenario, ETH has strong support in the area around $700-$900. The market now needs a positive external force as a catalyst. The ETH 2.0 merge seems like the most likely upcoming event to consider.
Key Support Levels: $900 & $700
Key Resistance Levels: $1300 & $1500 & $1700
Moving Averages:
MA20: $1335
MA50: $1734
MA100: $2401
MA200: $3040
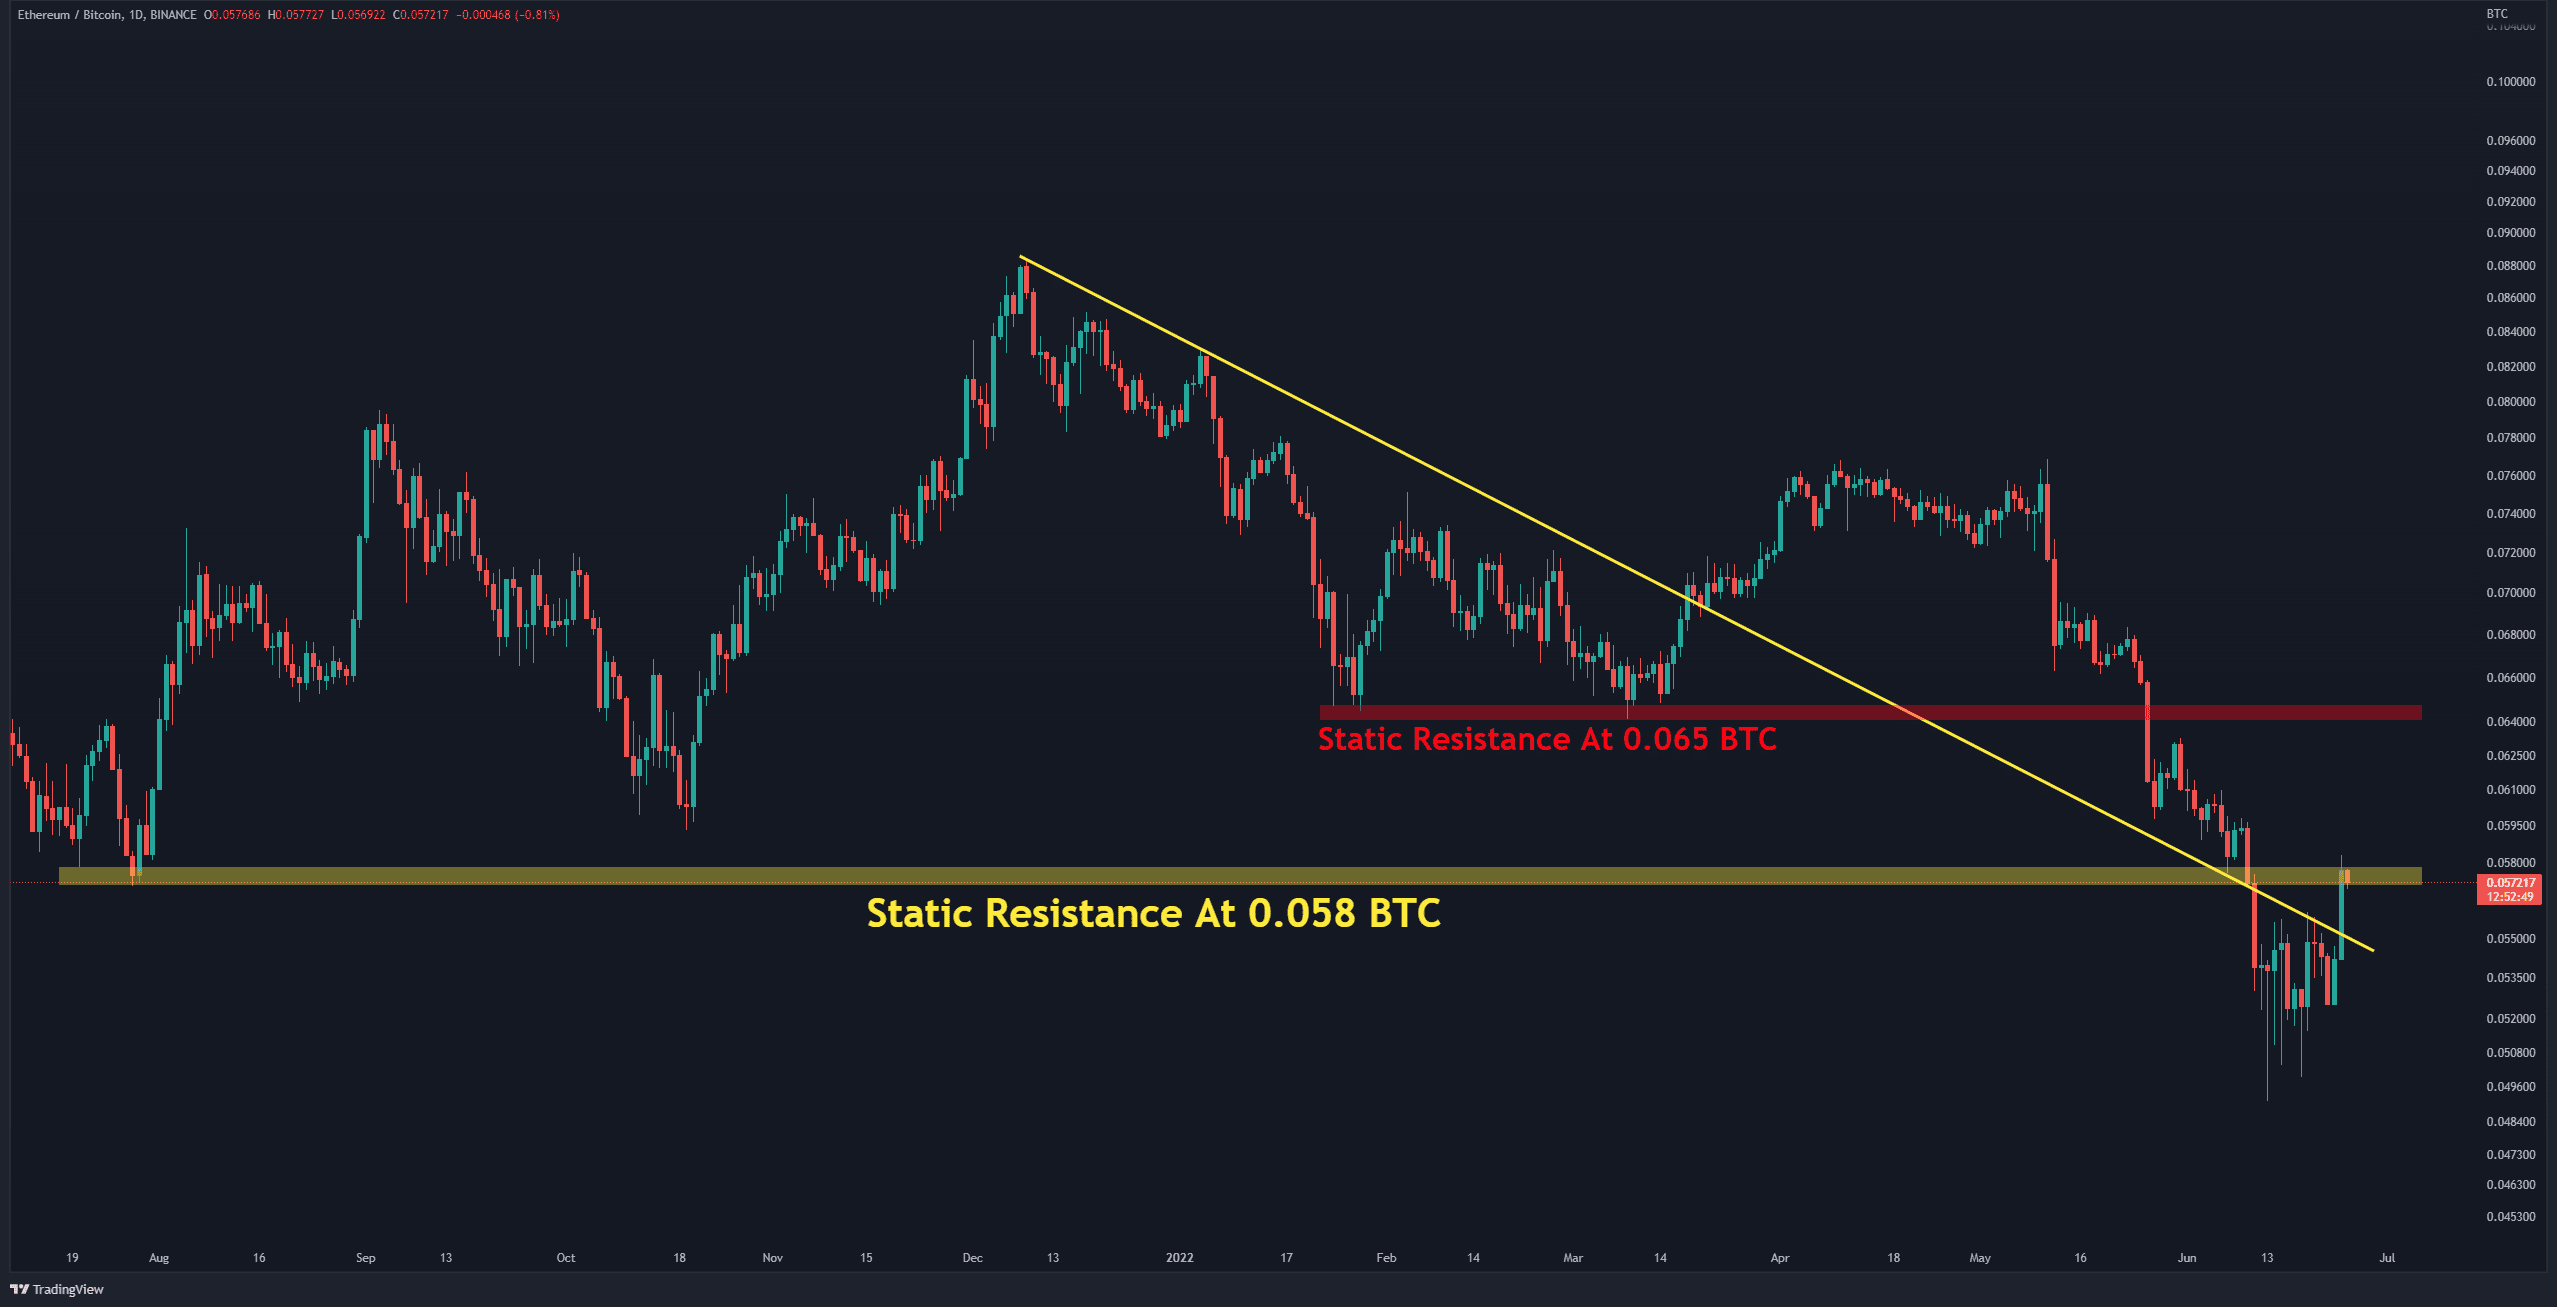
The situation against BTC seems to be different. As mentioned, altcoins outperformed BTC recently, which is also evident in this chart. Buyers were able to move forward with horizontal resistance at 0.058 BTC. However, the overall structure is still bearish. Unless the bulls can push the price above the horizontal resistance at 0.065 BTC, one can not hope for a change in the trend.
Key Support Levels: 0.050 BTC & 0.0.045 BTC
Key Resistance Levels: 0.055 BTC & 0.06 BTC
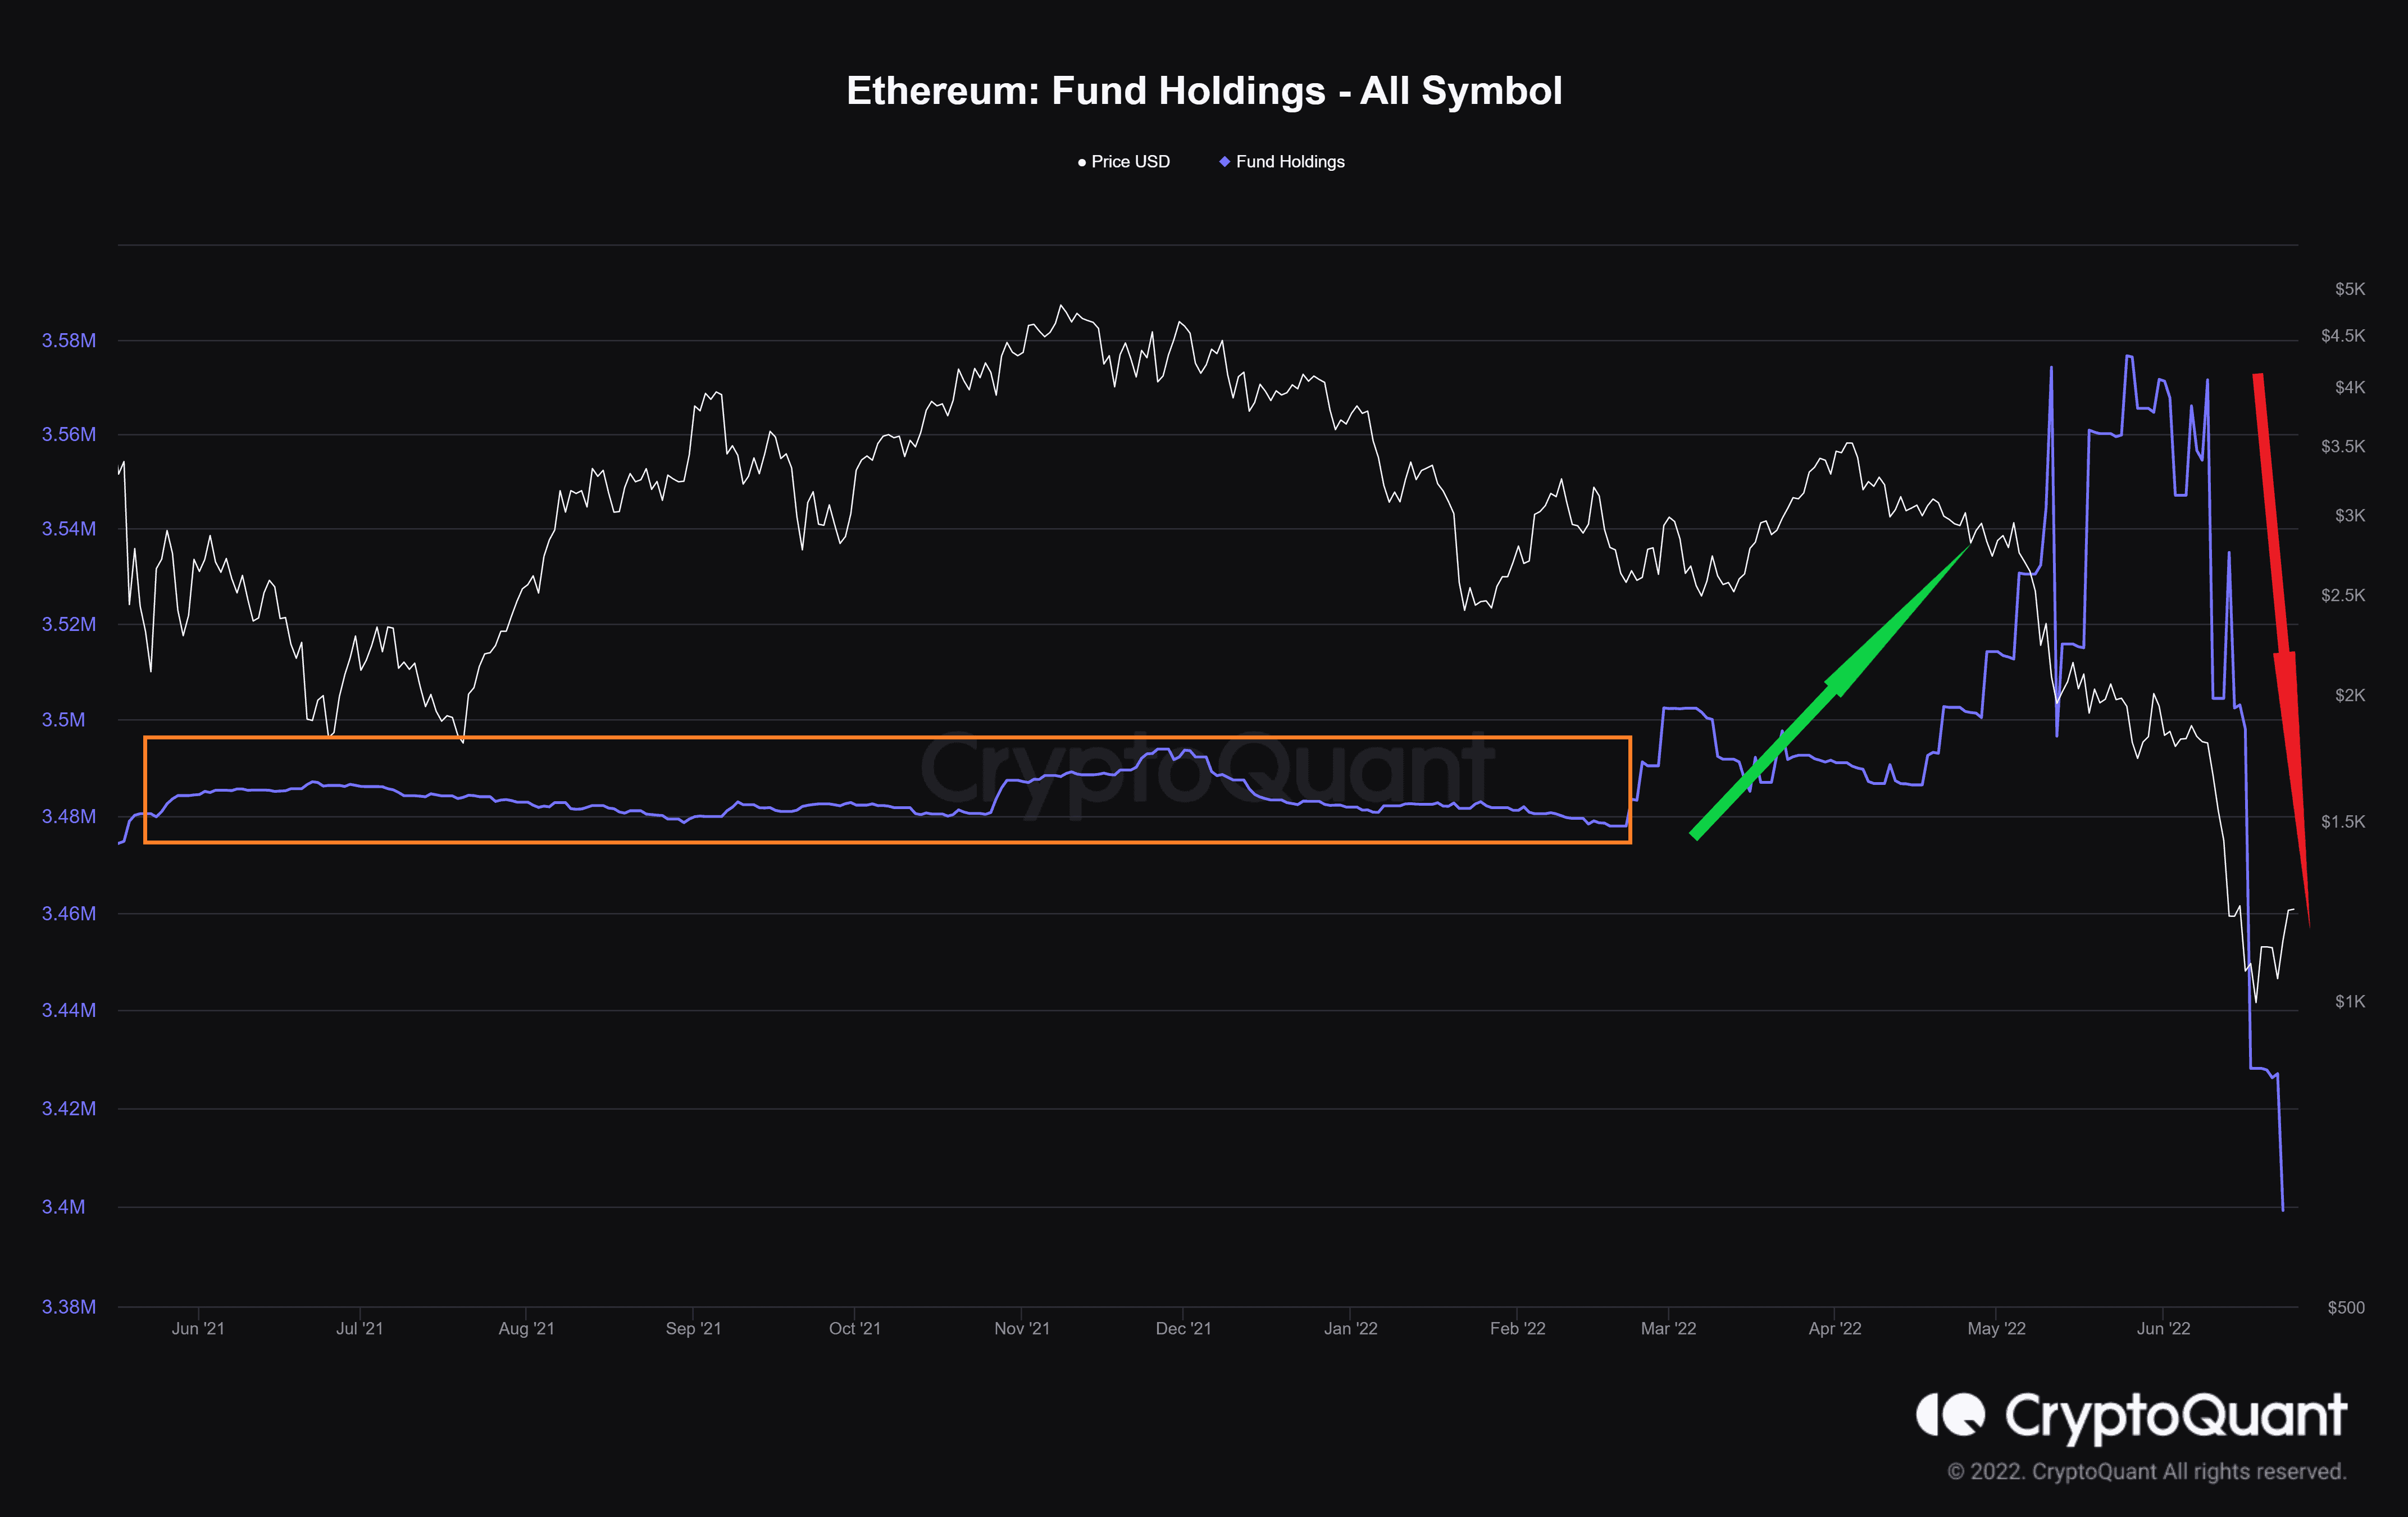
Definition: The total amount of coins held by digital assets holding such as trusts, ETFs, and funds – this is a proxy for indirect investment or demand for ETH.
Currently, the number of coins they held, which was constant during the fluctuations of 2021 and early 2022, increased in the first downward wave. They probably considered this price drop as an opportunity to buy at that time. But then, with the release of macroeconomic bad news and fears of a recession, their supply reached its lowest level in two years.