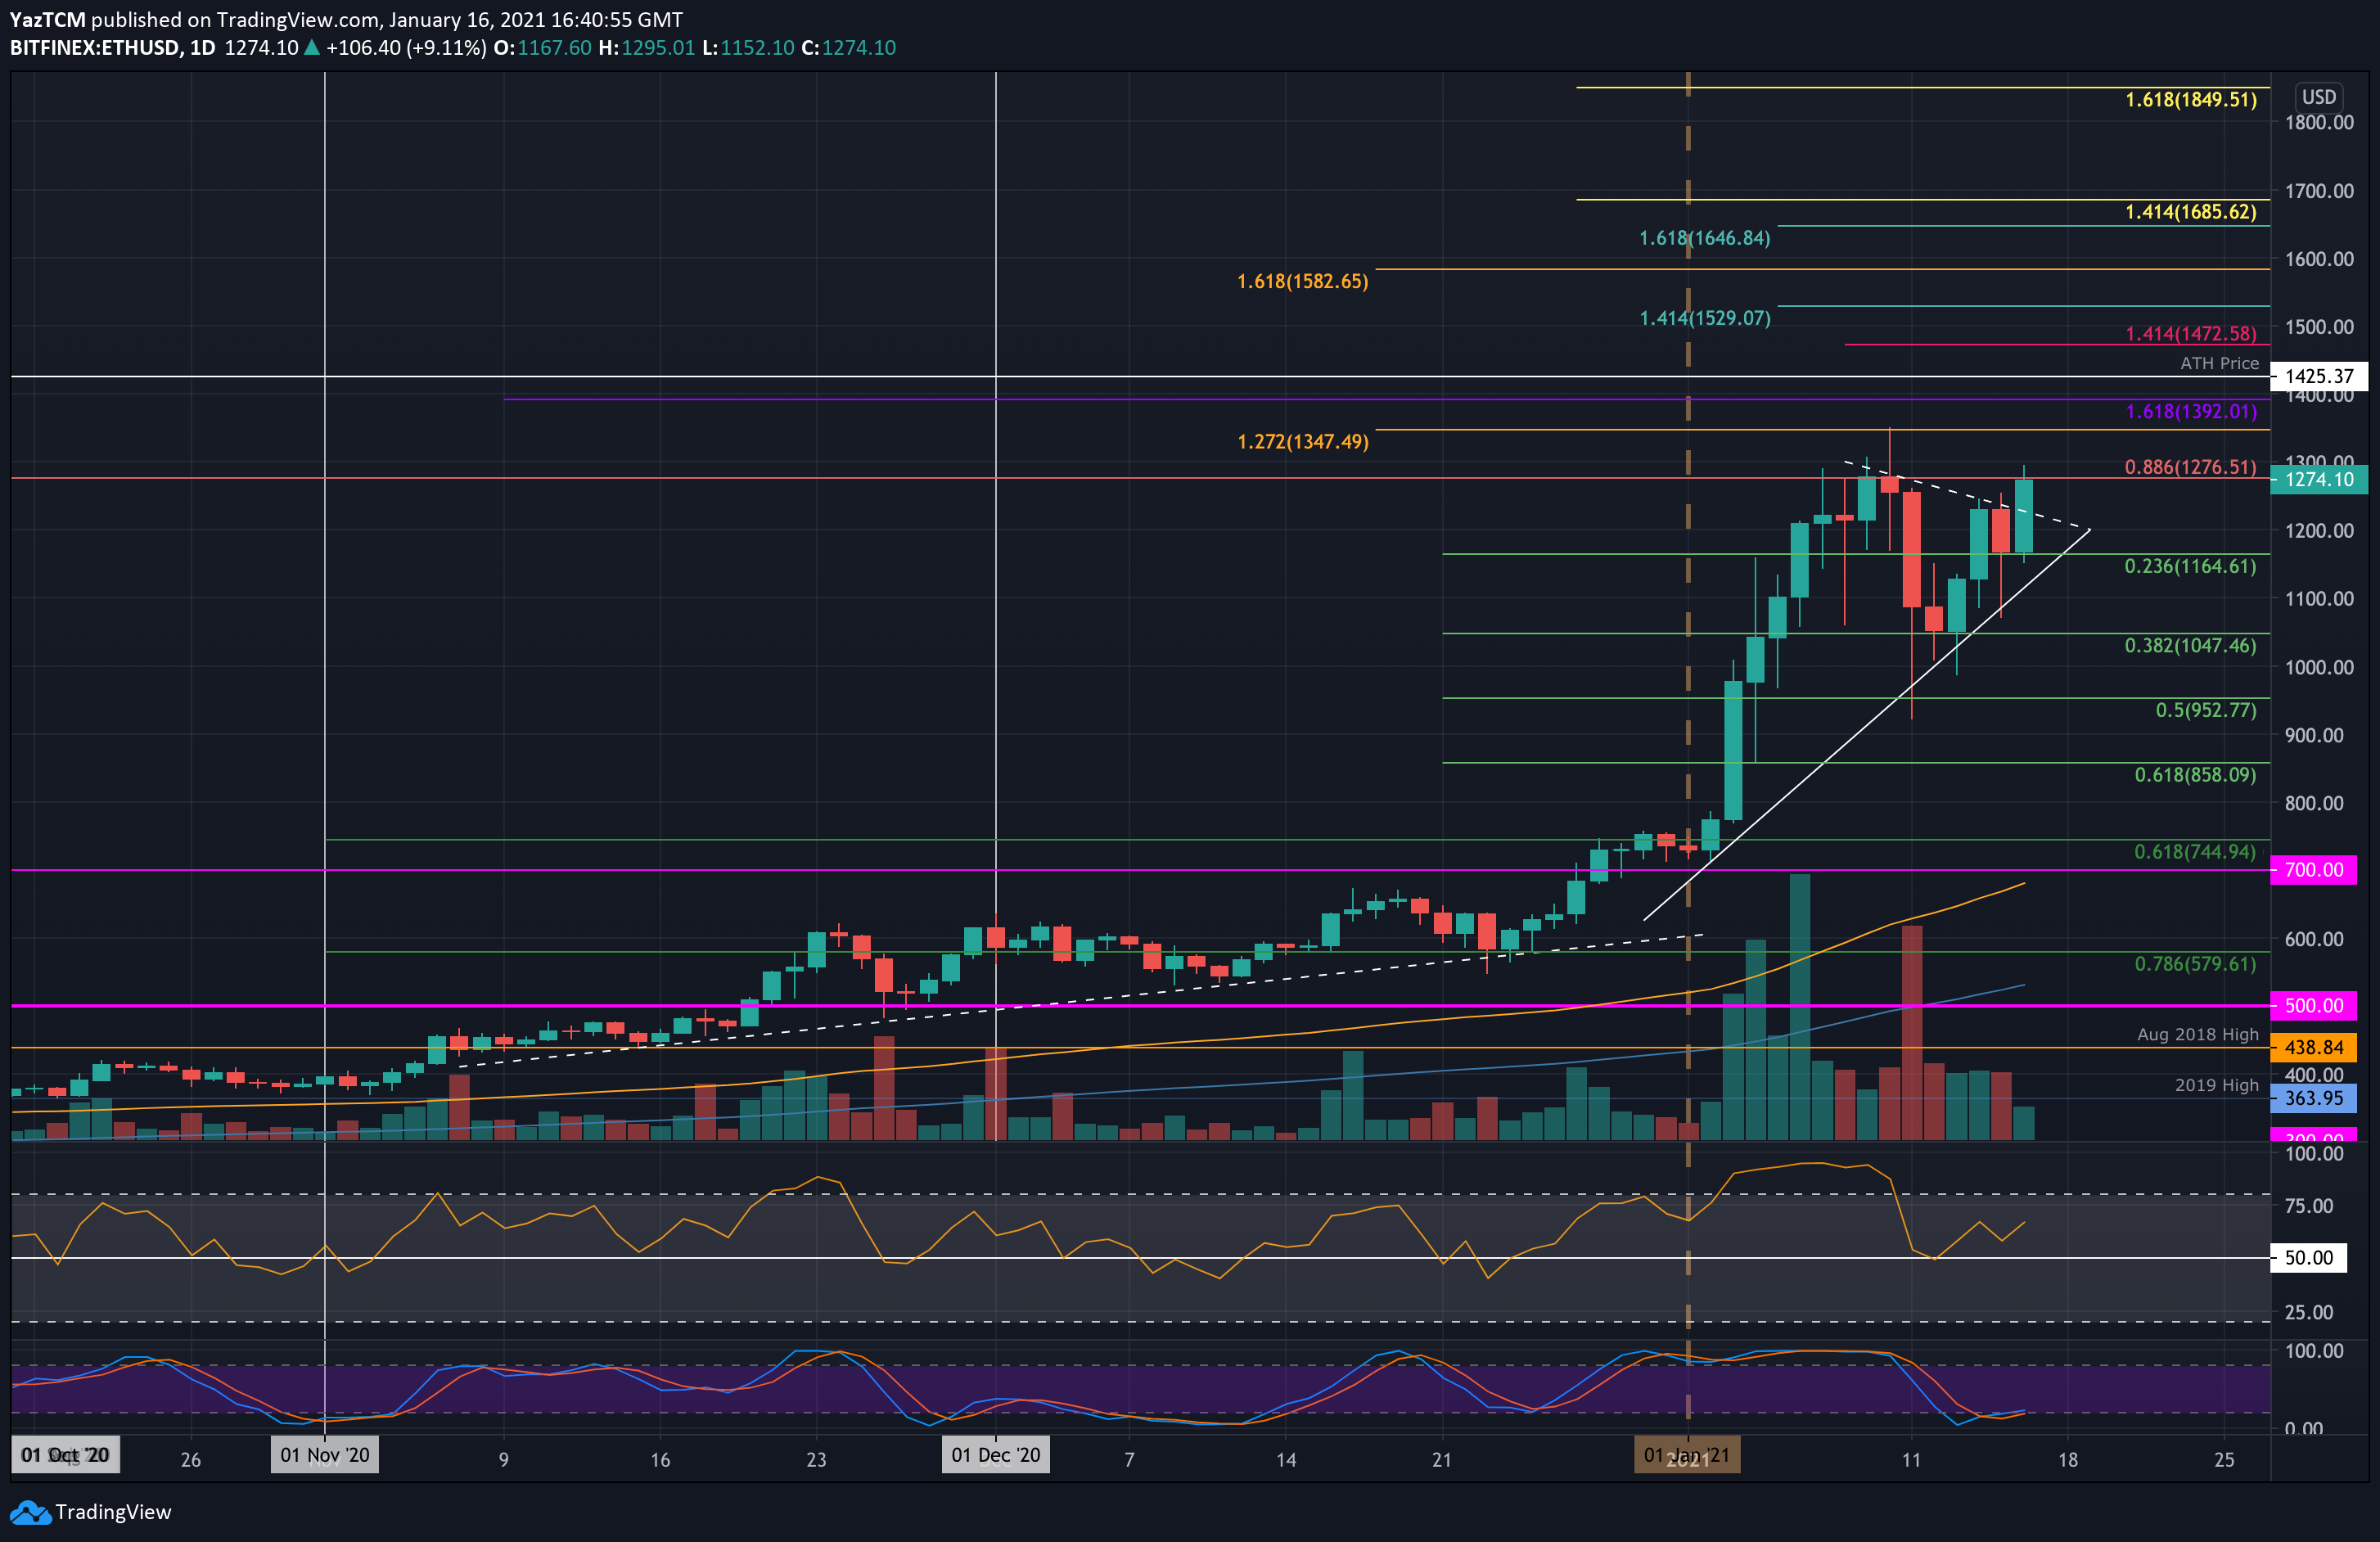
ETH/USD Daily Chart. Source: TradingView
Key Support Levels: $1,200, $1,165, $1,100.
Key Resistance Levels: $1,300, $1,350, $1,392.
Ethereum saw a whipsaw-like action in trading this week after starting above $1,300 and dropping into the $1,050 support (.382 Fib Retracement). From there, it rebounded on Wednesday as it pushed higher but became stuck at a short term falling trend line.
ETH then headed lower but found support at $1,165 (.236 Fib Retracement). It rebounded from this support today to break above the short term falling trend line and reach as high as $1,295. It has since dropped slightly and is trading at the resistance of around $1,275, provided by a bearish .886 Fib Retracement. This resistance stalled the market in the first week of January 2020.
Looking ahead, if the bulls close above $1,275 today (bearish .886 Fib Retracement), the first level of resistance lies at $1,300. This is followed by $1,350 (Jan 2021 High), $1,392 (1.618 Fib Extension – purple), and $1,425 (ATH Price). Beyond the ATH, additional resistance lies at $1,472, $1,530, and $1,582.
On the other side, the first level of support lies at $1,200. This is followed by $1,165 (.236 Fib), $1,100, and $1,050 (.382 Fib Retracement).
The RSI rebounded from the mid0line and is starting to push higher as the bullish momentum increases. It has much room to continue higher before becoming overbought. Additionally, the Stochastic RSI has produced a bullish crossover signal in oversold territory.
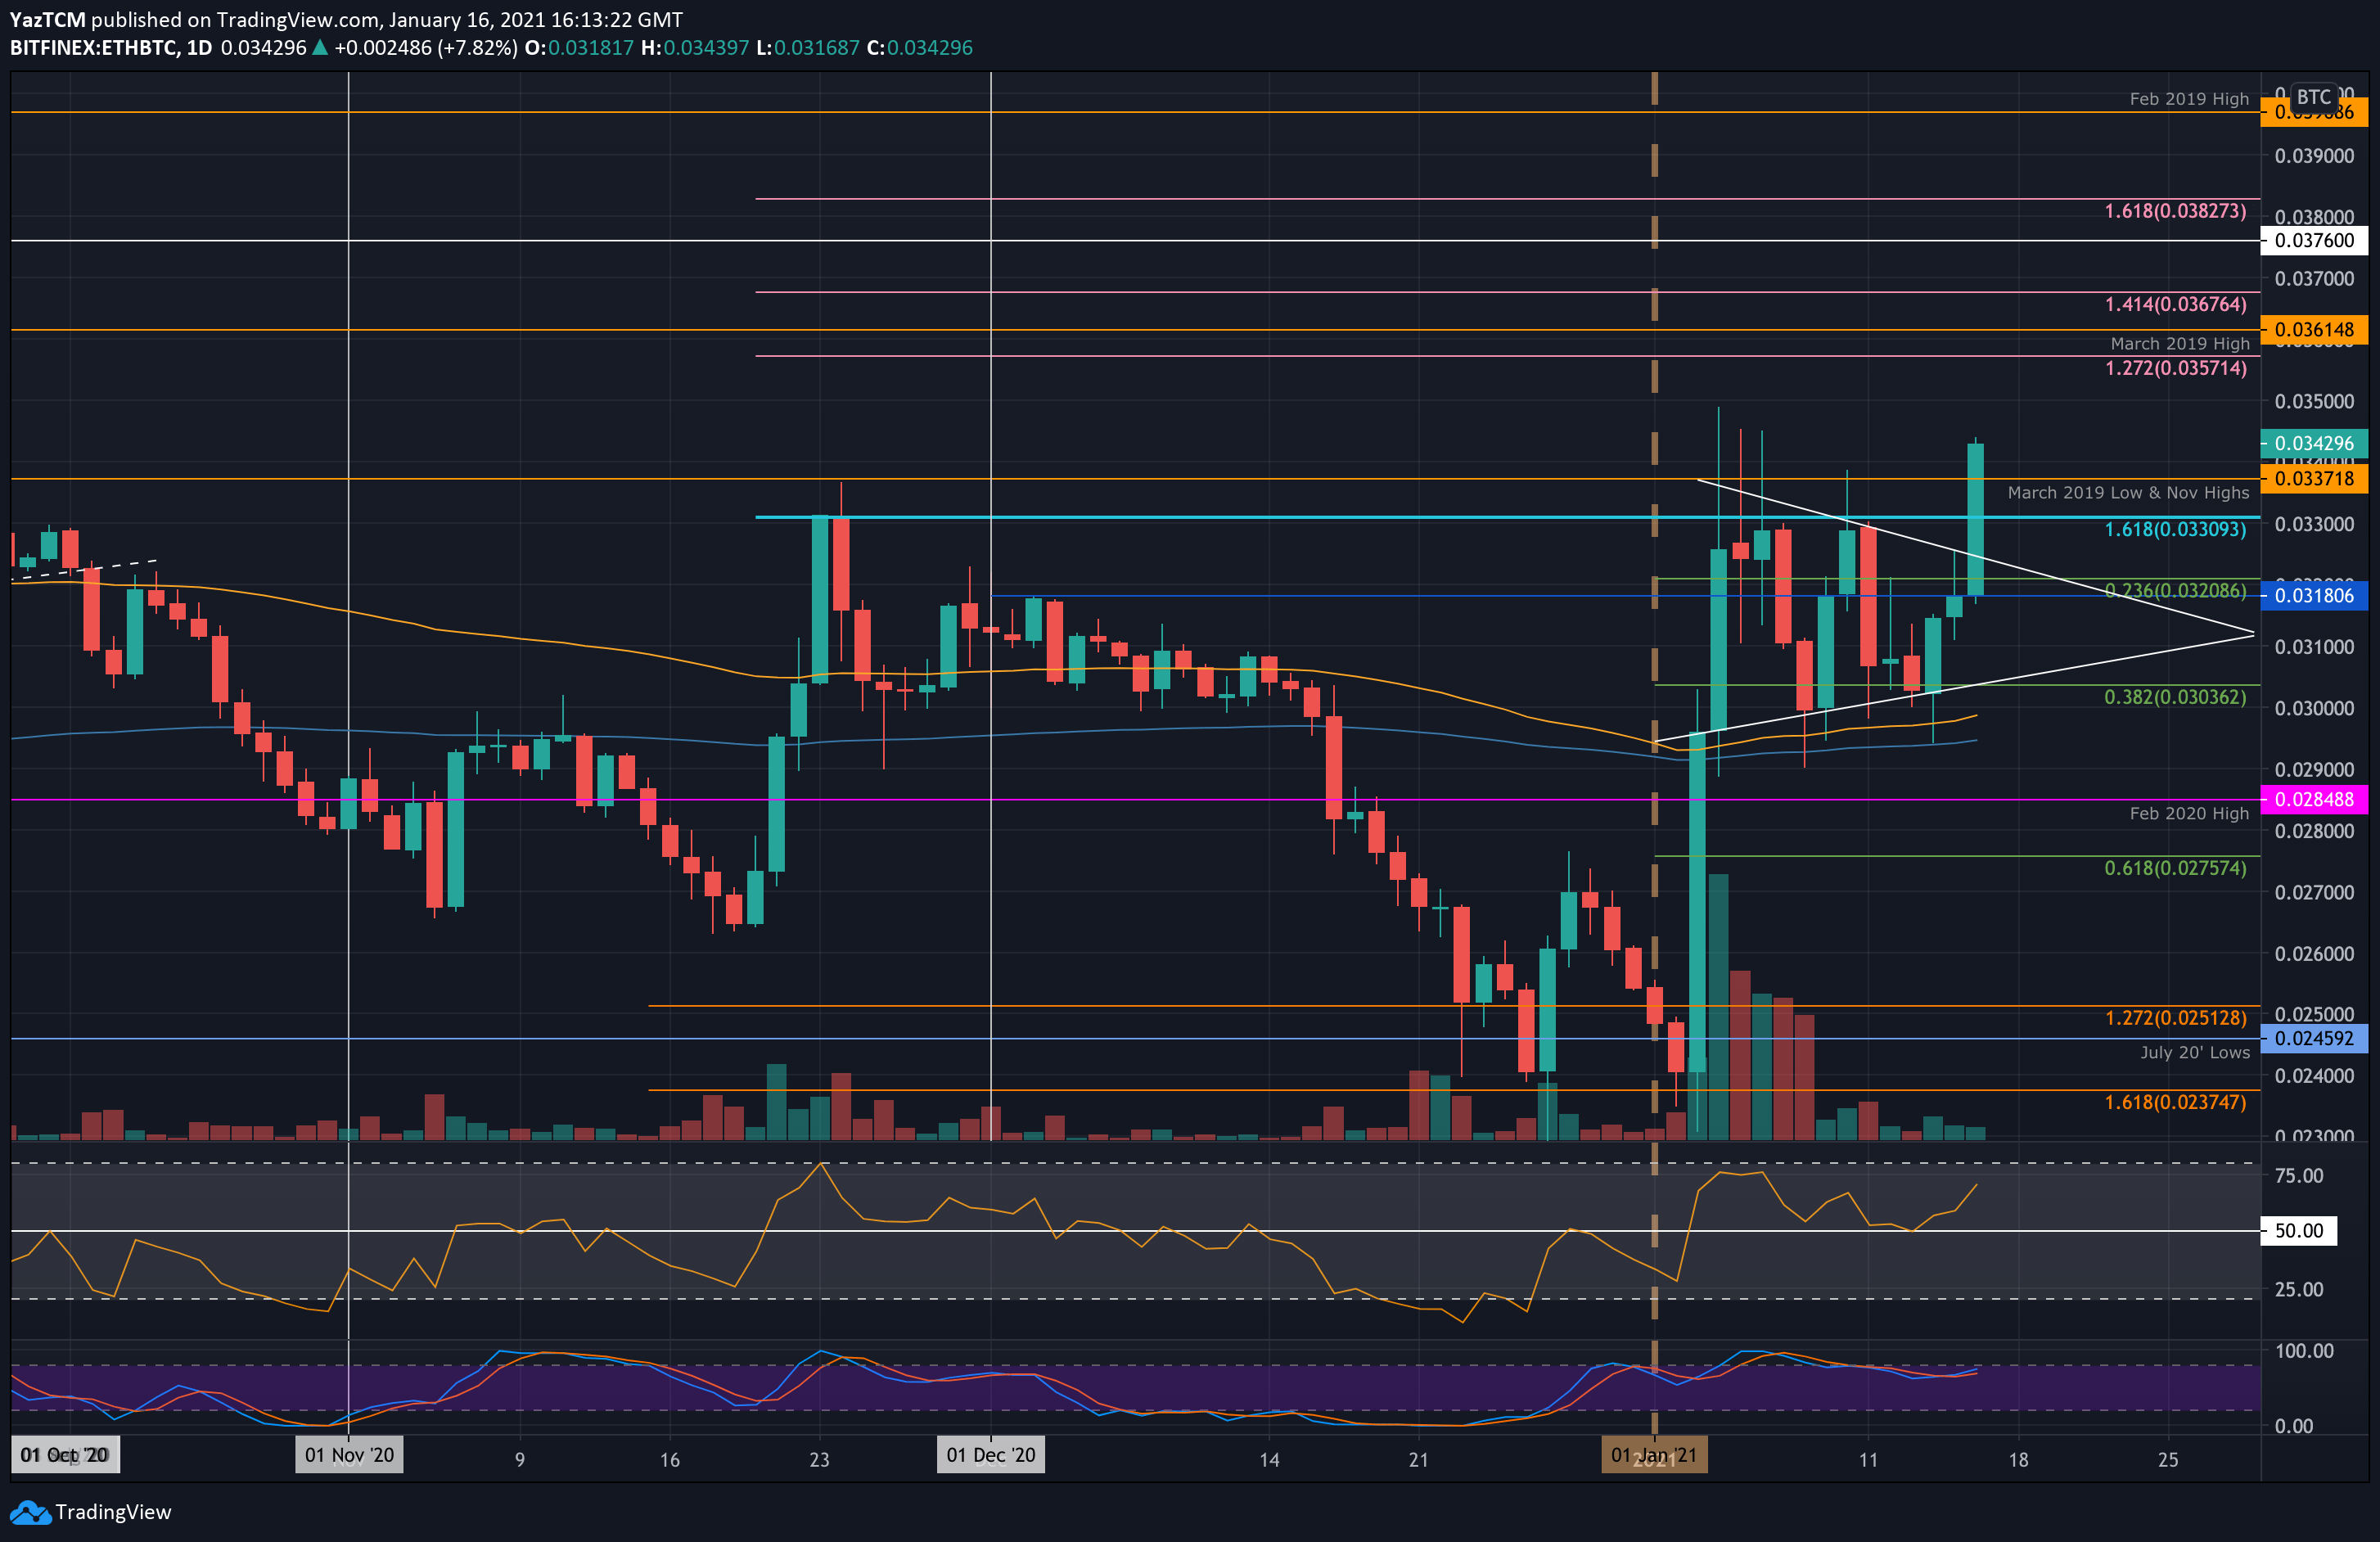
Key Support Levels: 0.0337 BTC, 0.033 BTC, 0.032 BTC.
Key Resistance Levels: 0.035 BTC, 0.0357 BTC, 0.0361 BTC.
Against Bitcoin, ETH has been trapped within a short term symmetrical triangle for most of the month. On Thursday, it rebounded from the support at the lower boundary, around 0.0303 BTC, and started to push higher.
Yesterday, it met resistance at the December 2020 highs around 0.0318 BTC. Today, the price surge allowed ETH to break above the symmetrical triangle, penetrate the Jan 2021 0.033 BTC resistance, and push beyond the November 2020 highs at 0.0337 BTC to reach 0.0342 BTC.
Moving forward, the first level of resistance lies at 0.035 BTC. This is followed by 0.0357 BTC (1.272 Fib Extension), 0.0361 BTC (March 2019 Highs), and 0.0367 BTC (1.414 Fib Extension). Additional resistance is found at 0.0376 BTC and 0.0382 BTC.
On the other side, support first lies at 0.0337 BTC (November 2020 Highs). This is followed by 0.033 BTC, 0.032 BTC (.236 Fib), and 0.0318 BTC (December 2020 highs).
Likewise, the RSI is rising and still has room to continue higher before the market becomes exhausted.