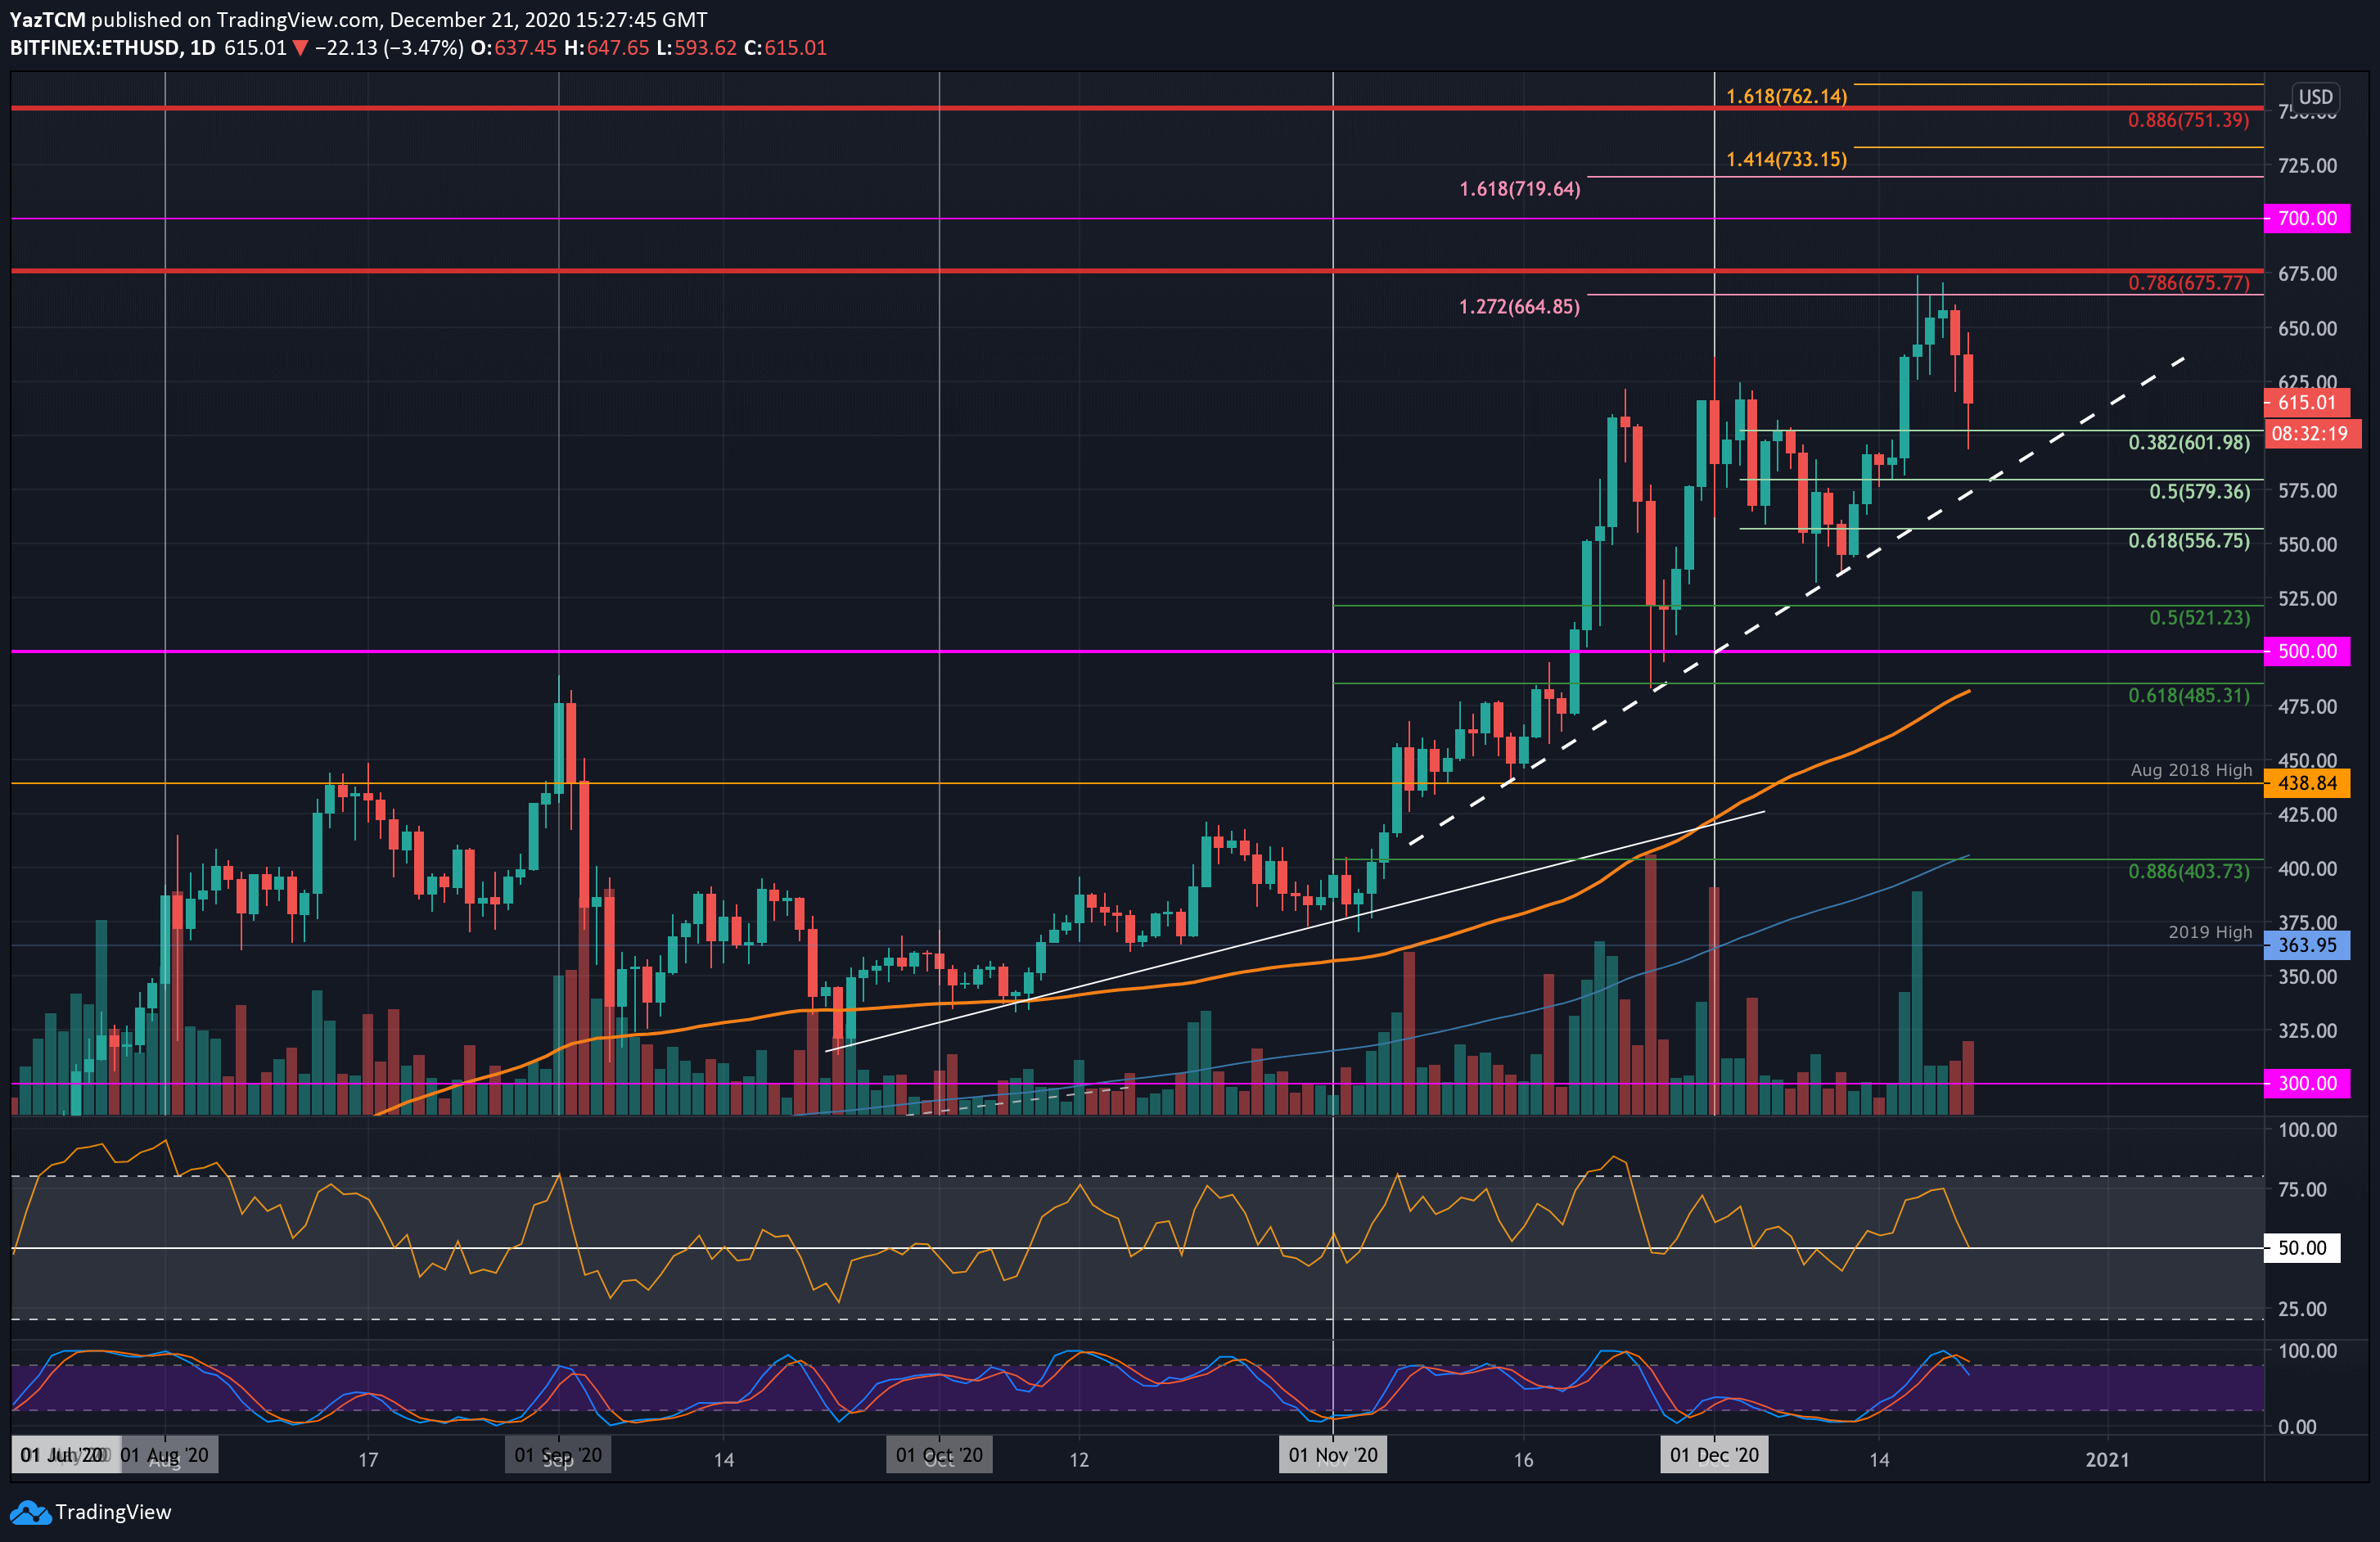
ETH/USD Daily Chart. Source: TradingView
Key Support Levels: $600, $580, $556.
Key Resistance Levels: $625, $650, $665.
Last week, Ethereum surged higher after rebounding from $580 to break above $600 on the same day that Bitcoin penetrated $20,000. The coin continued to climb over the following few days but couldn’t break past the $675 resistance (long term .786 Fib Retracement).
Over the weekend, ETH struggled to maintain itself above $650 and eventually rolled over to fall as low as $625. This price drop continued today as ETH briefly spiked beneath $600 again. It is currently trading at $614.
Looking ahead, if the buyers can hold the $600 support and rebound, the first level of resistance lies at $625. This is followed by $650, $665, and $675 (bearish .786 Fib). Additional resistance then lies at $700.
On the other side, if the bears push beneath the $600 (.382 Fib) level, support is expected at $580 (.5 Fib & Rising trend line), $556 (.618 Fib), and $530 (December lows).
Bearish Divergence had been developing on the RSI over the past week, which eventually resulted in Ethereum reversing over the weekend. If it continues beneath the mid-line, the bearish momentum is likely to drive ETH toward $580.
Additionally, the Stochastic RSI also produced a bearish crossover signal.
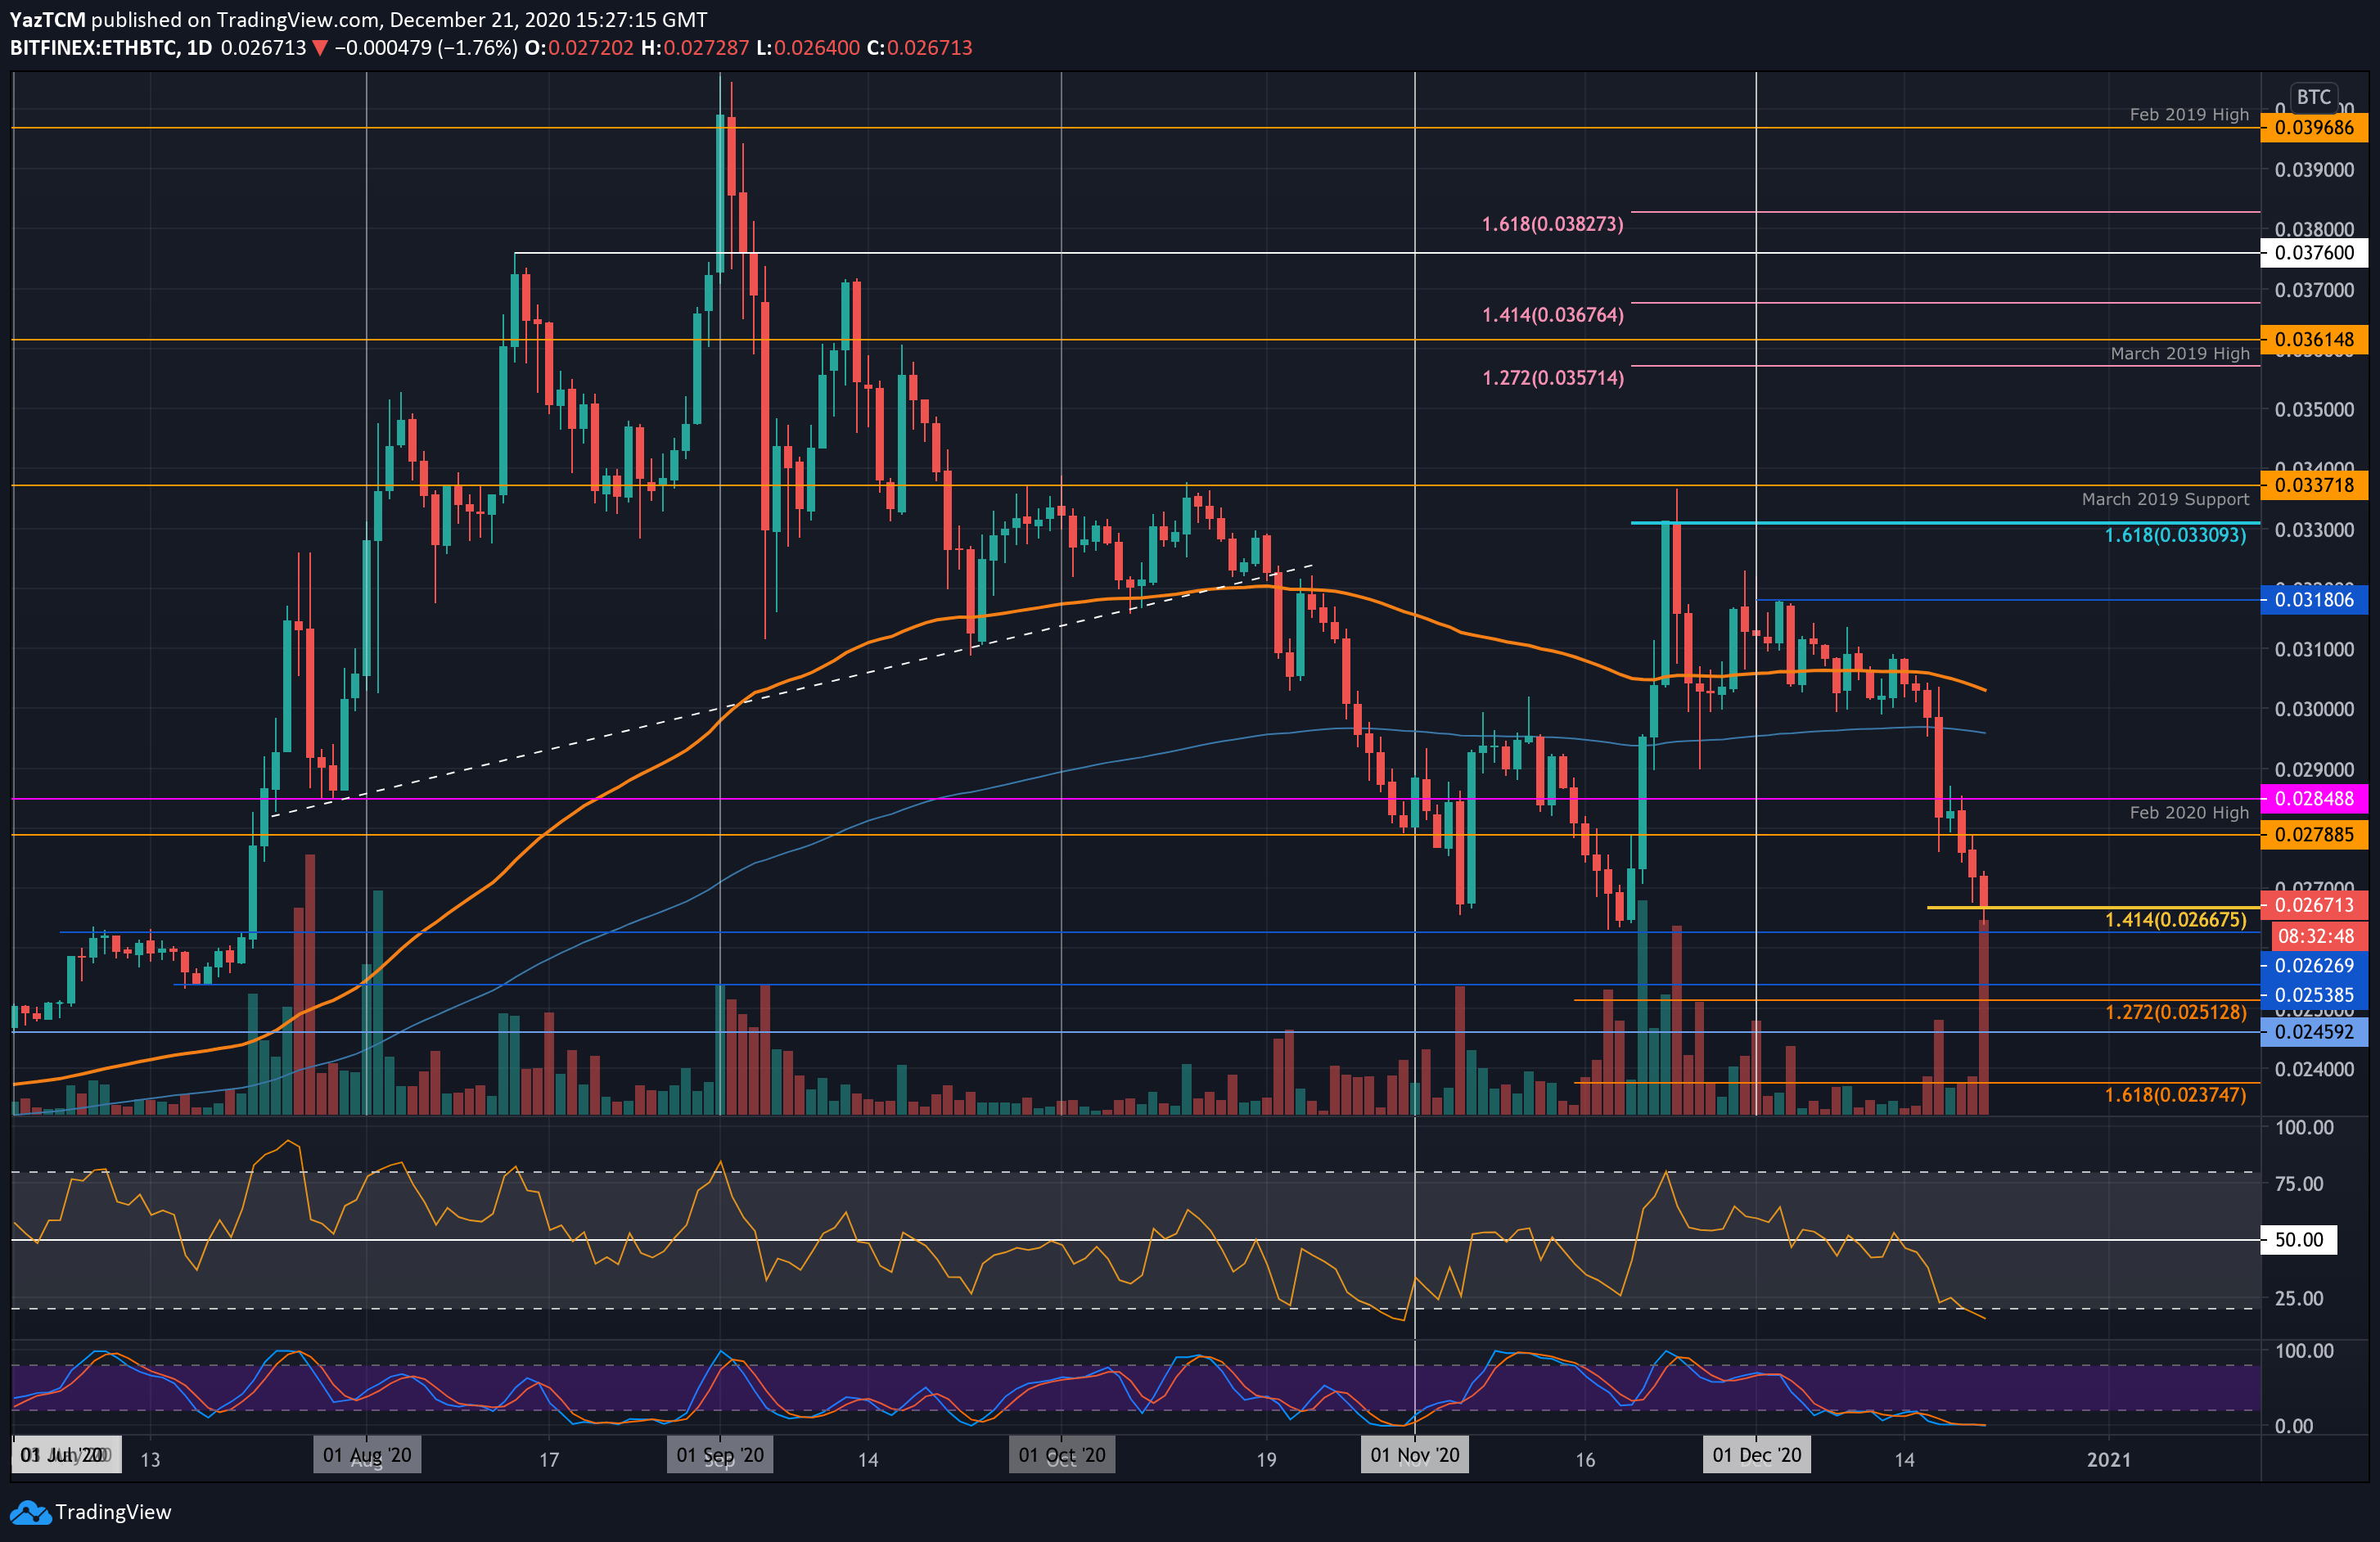
Key Support Levels: 0.0266 BTC, 0.0262 BTC, 0.0253 BTC.
Key Resistance Levels: 0.0278 BTC, 0.0284 BTC, 0.029 BTC.
Ethereum has been struggling heavily against Bitcoin this month. It was trading at 0.0318 BTC during the first week of December but dropped lower into the 0.03 BTC support during the first half of the month.
Last week, the bears pushed ETH beneath the 0.03 BTC support and sent it below the 200-days EMA to hit the 0.0278 BTC level. The coin continued beneath 0.0278 BTC over the weekend and dropped into the 0.0266 BTC support today.
The November lows are located at 0.0262 BTC, and a break beneath that would put Ethereum at fresh five-month lows.
Looking ahead, if the sellers break 0.0266 BTC, the first level of support lies at 0.0262 BTC. This is followed by 0.0253 BTC, 0.0251 BTC, 0.0245 BTC.
On the other side, the first level of resistance lies at 0.0278 BTC. This is followed by 0.0284 BTC (Feb 2020 Highs), 0.029 BTC, and 0.03 BTC.
Both the RSI and Stochastic RSI are in extremely oversold areas, which could suggest that the bears might be a little overextended at this moment in time.