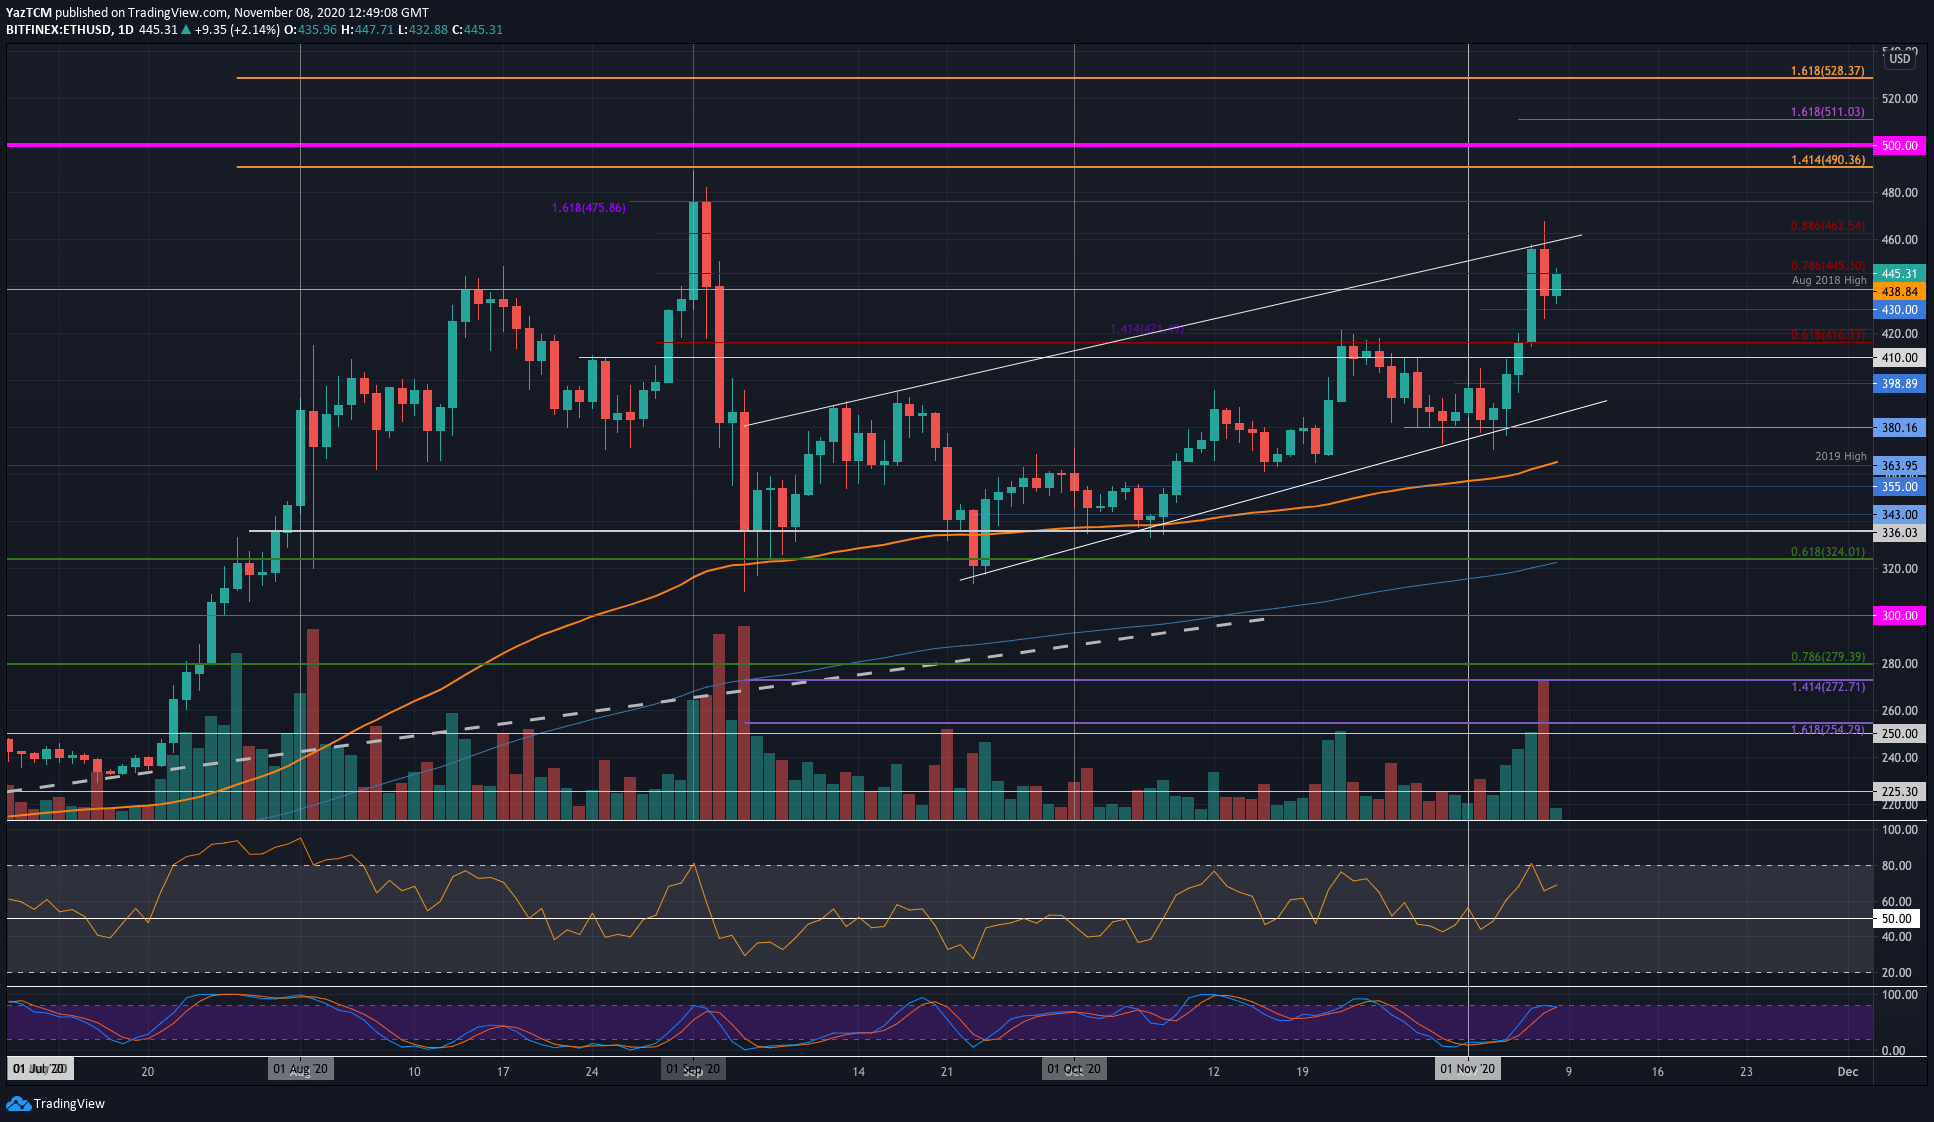
ETH/USD Daily Chart. Source: TradingView
Key Support Levels:$438, $430, $421.
Key Resistance Levels: $445, $462, $475.
Last week, Ethereum surged from a low of $380 to break above $400 and reach as high as $470 yesterday. Unfortunately, the buyers met resistance at the upper boundary of a rising price channel that spans over the last two months and fell lower from here yesterday.
During the drop, Ethereum found support at $425 and rebounded higher to reach $445 today (bearish .786 Fib Retracement). The coin remains strongly bullish, and it would need to drop back beneath $410 to turn neutral again.
Looking ahead, if the bulls can break $445, the first level of resistance is located at the upper boundary of the price channel. The bearish .886 Fib Retracement further bolsters this resistance at $462. Above this, resistance lies at $475 (September high-day closing price), $490, and $500.
On the other side, the first level of support lies at $439 (August 2018 Highs). Beneath this, support is found at $430, $421, $416, $410, and $400.
The Stochastic RSI is in the process of producing a bearish crossover signal that is likely to put downward pressure on the market.
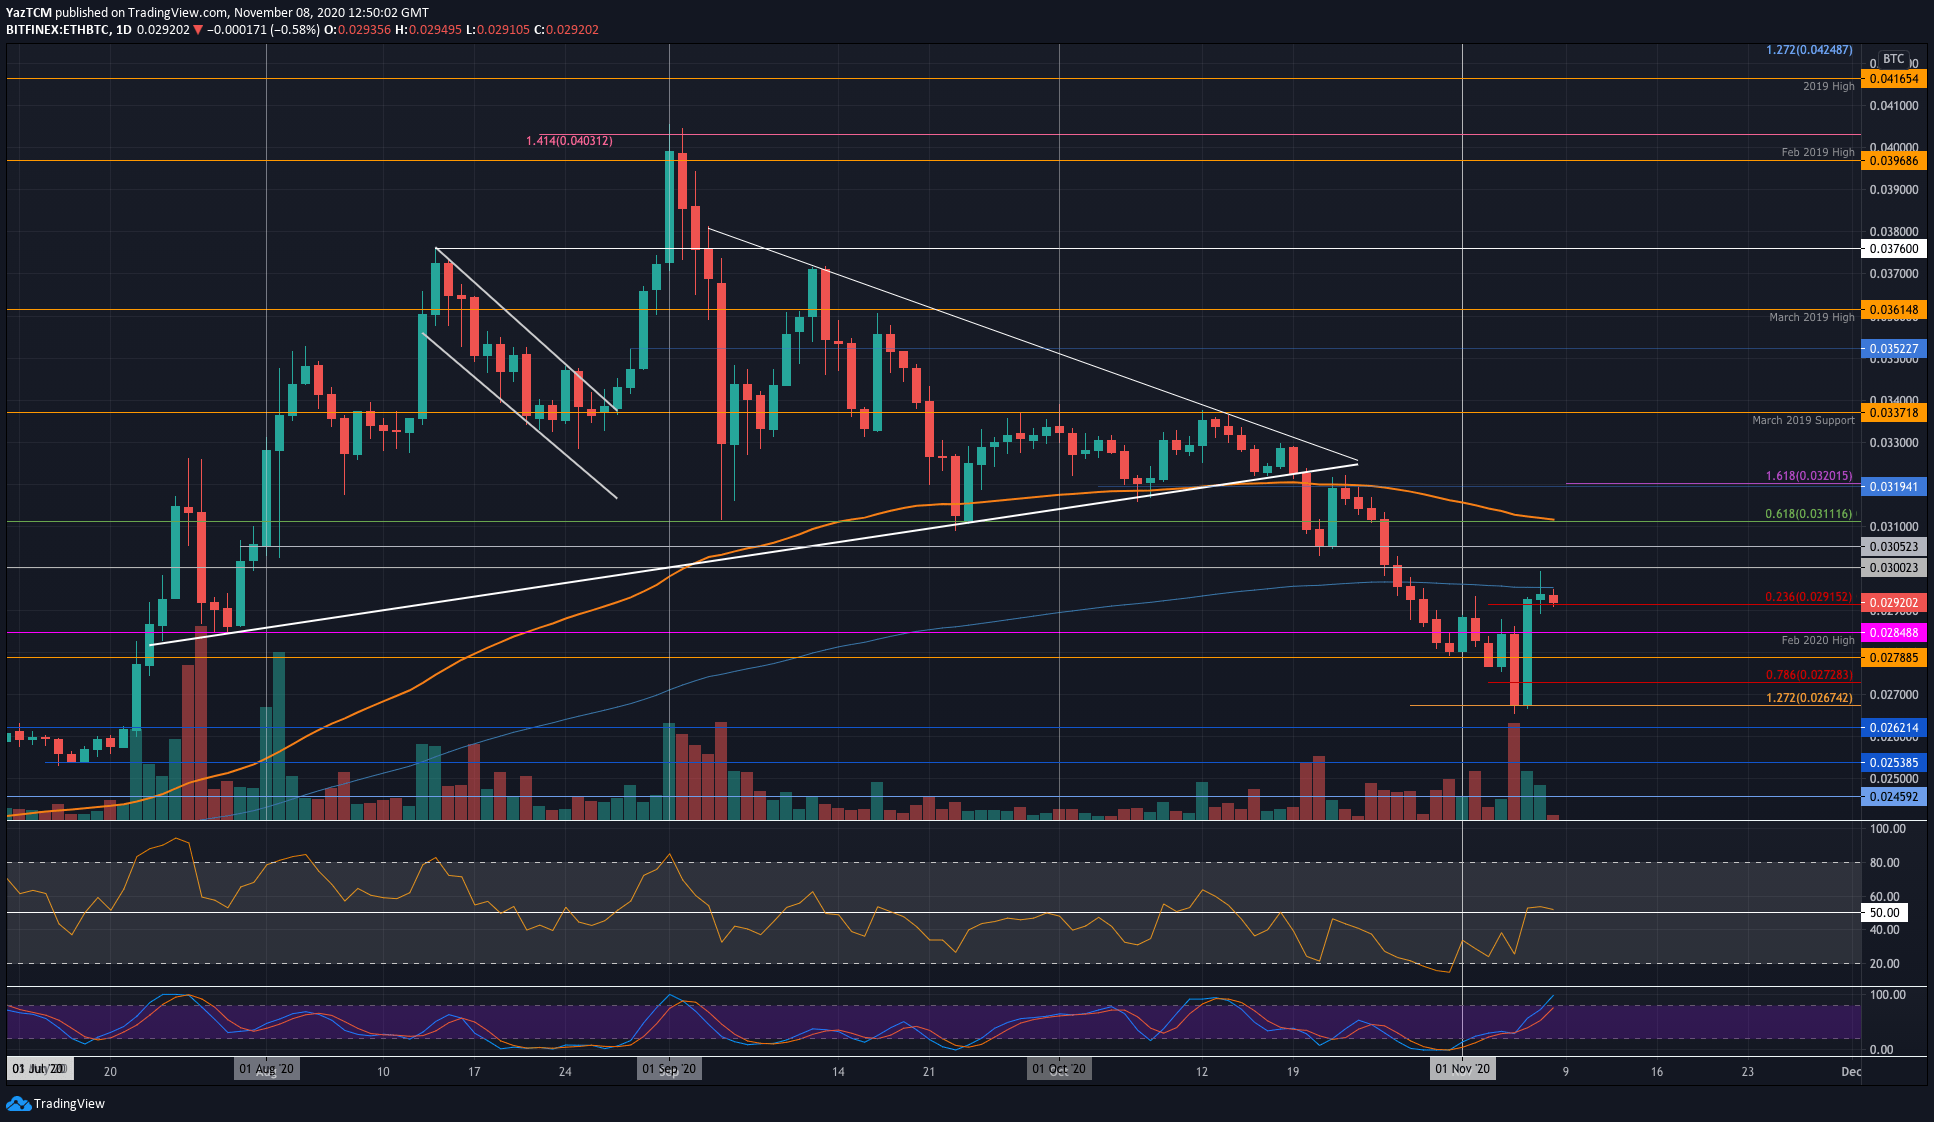
Key Support Levels: 0.0291 BTC, 0.0285 BTC, 0.0278 BTC.
Key Resistance Levels: 0.0295 BTC, 0.03 BTC, 0.0305 BTC.
Against Bitcoin, Ethereum found support at the 0.0267 BTC level (downside 1.272 FIb Extension) toward the end of last week. It rebounded from it on Friday to reach as high as 0.0292 BTC.
Yesterday, BTC pushed higher as it scratched the 0.03 BTC level, but it was never able to break the resistance at the 200-days EMA. The cryptocurrency has since dropped slightly but is holding the support at 0.0291 BTC (.236 Fib Retracement).
Looking ahead, if the bulls rebound from here and break beyond the 200-days EMA at 0.0295 BTC, the first level of resistance lies at 0.03 BTC. Above this, resistance is found at 0.0305 BTC and 0.0311 BTC (100-days EMA).
On the other side, if the sellers push beneath the 0.0291 BTC level, support lies at 0.0285 BTC (Feb 2020 Highs), 0.0278 BTC, and 0.0272 BTC (.786 Fib).
The RSI is trading along the mid-line to indicate indecision within the market. If it falls beneath the mid-line, the sellers will take control of the momentum and likely push ETH lower.