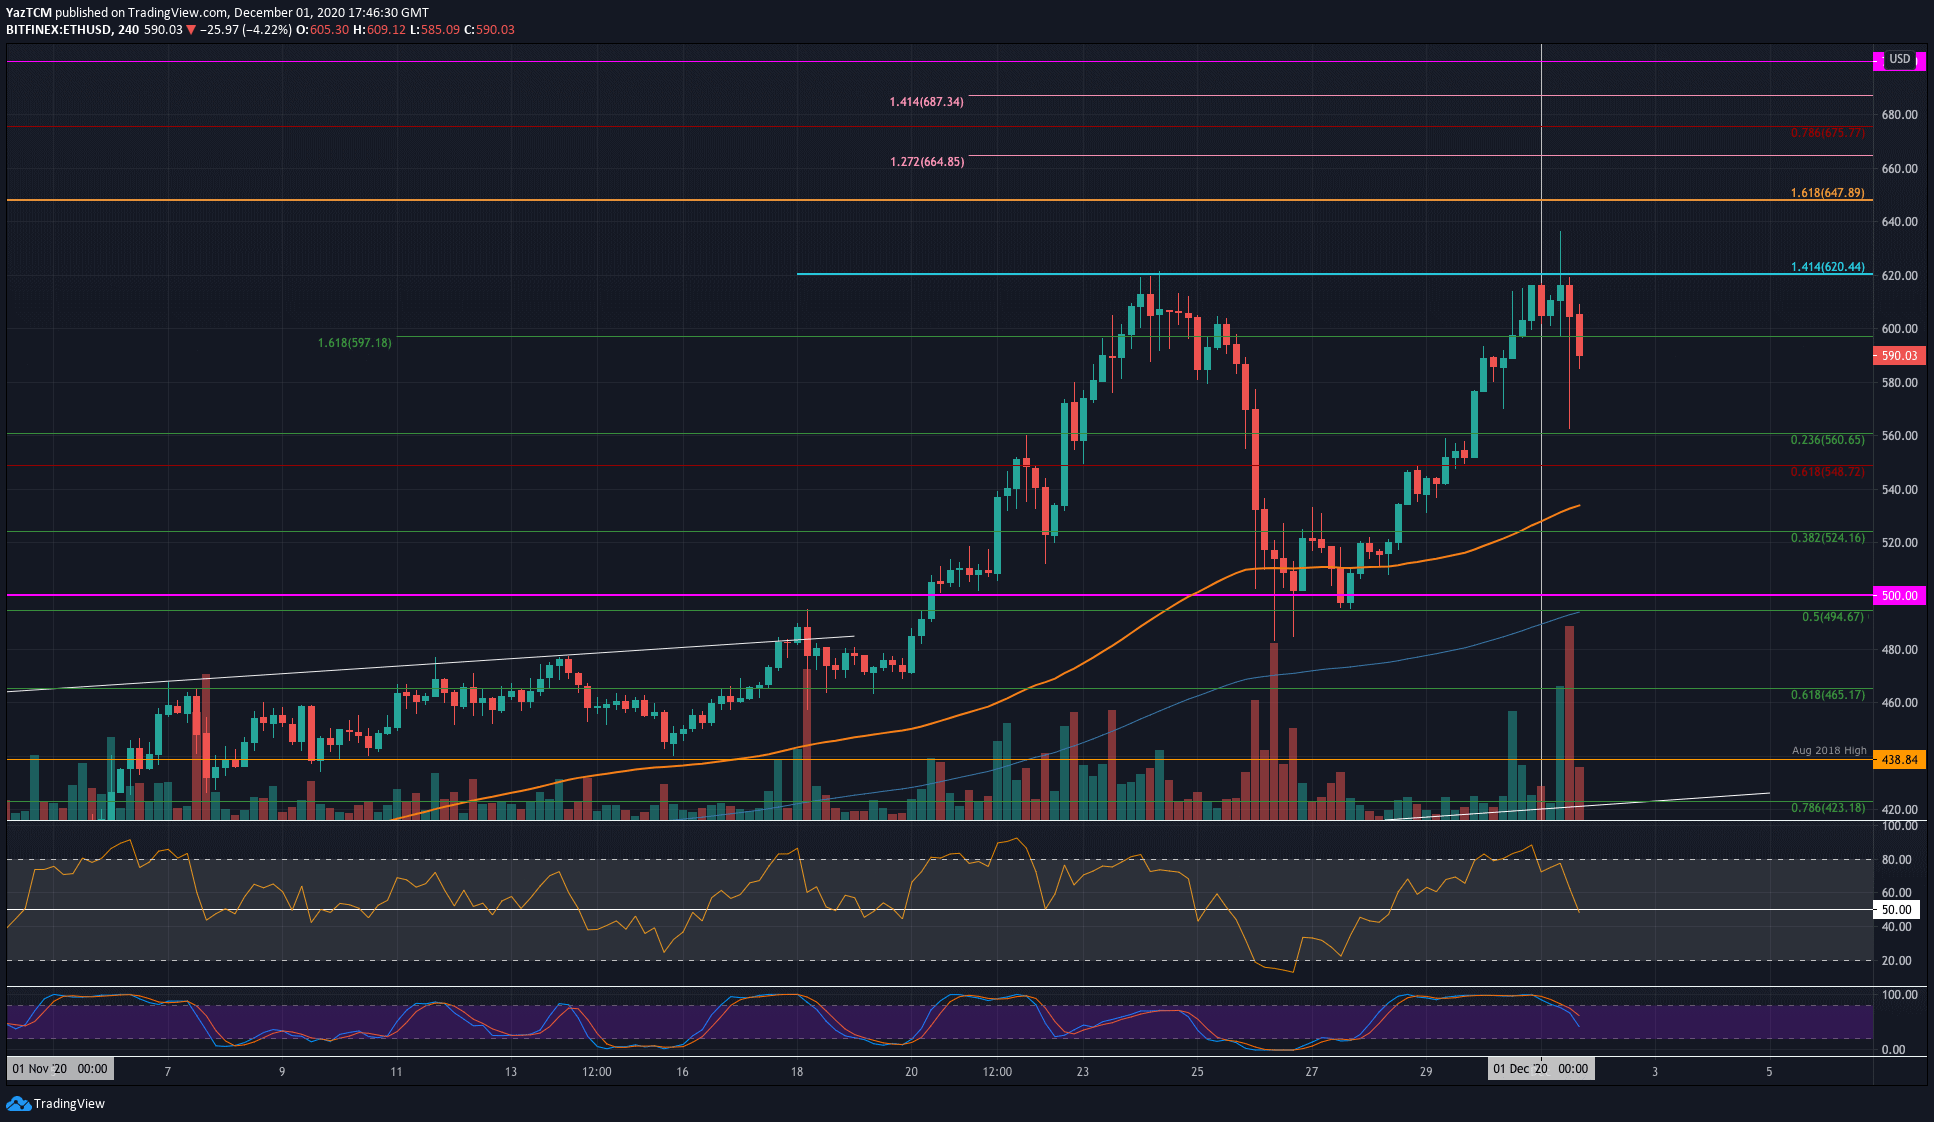
ETH/USD 4HR Chart. Source: TradingView
Key Support Levels: $580, $560, $550.
Key Resistance Levels: $620, $650, $665.
Earlier today, Ethereum spiked lower by around 9% when it dropped from the resistance at $620 to break beneath $600 and reach $560. There, it found support at the .236 Fib Retracement level and rebounded to climb back above $600 and hit $607. It has since dropped back beneath $600 as it trades around $590. Interestingly enough, all of this coincided with the launch of Phase 0 of Ethereum 2.0.
The next level of resistance to break lies at $620, which caused problems for the market earlier in November.
Looking ahead, if the buyers break $620, the first level of higher resistance lies at $650. This is followed by $665 (1.272 Fib extension), $675 (bearish .786 Fib Retracement), $687 (1.414 Fib Extension), and $700.
On the other side, the first level of support lies at $600. Additional support is found at $580, $560 (.236 Fib), and $550.
The 4HR RSI has started to point lower, suggesting that the bullish momentum might be starting to fade.
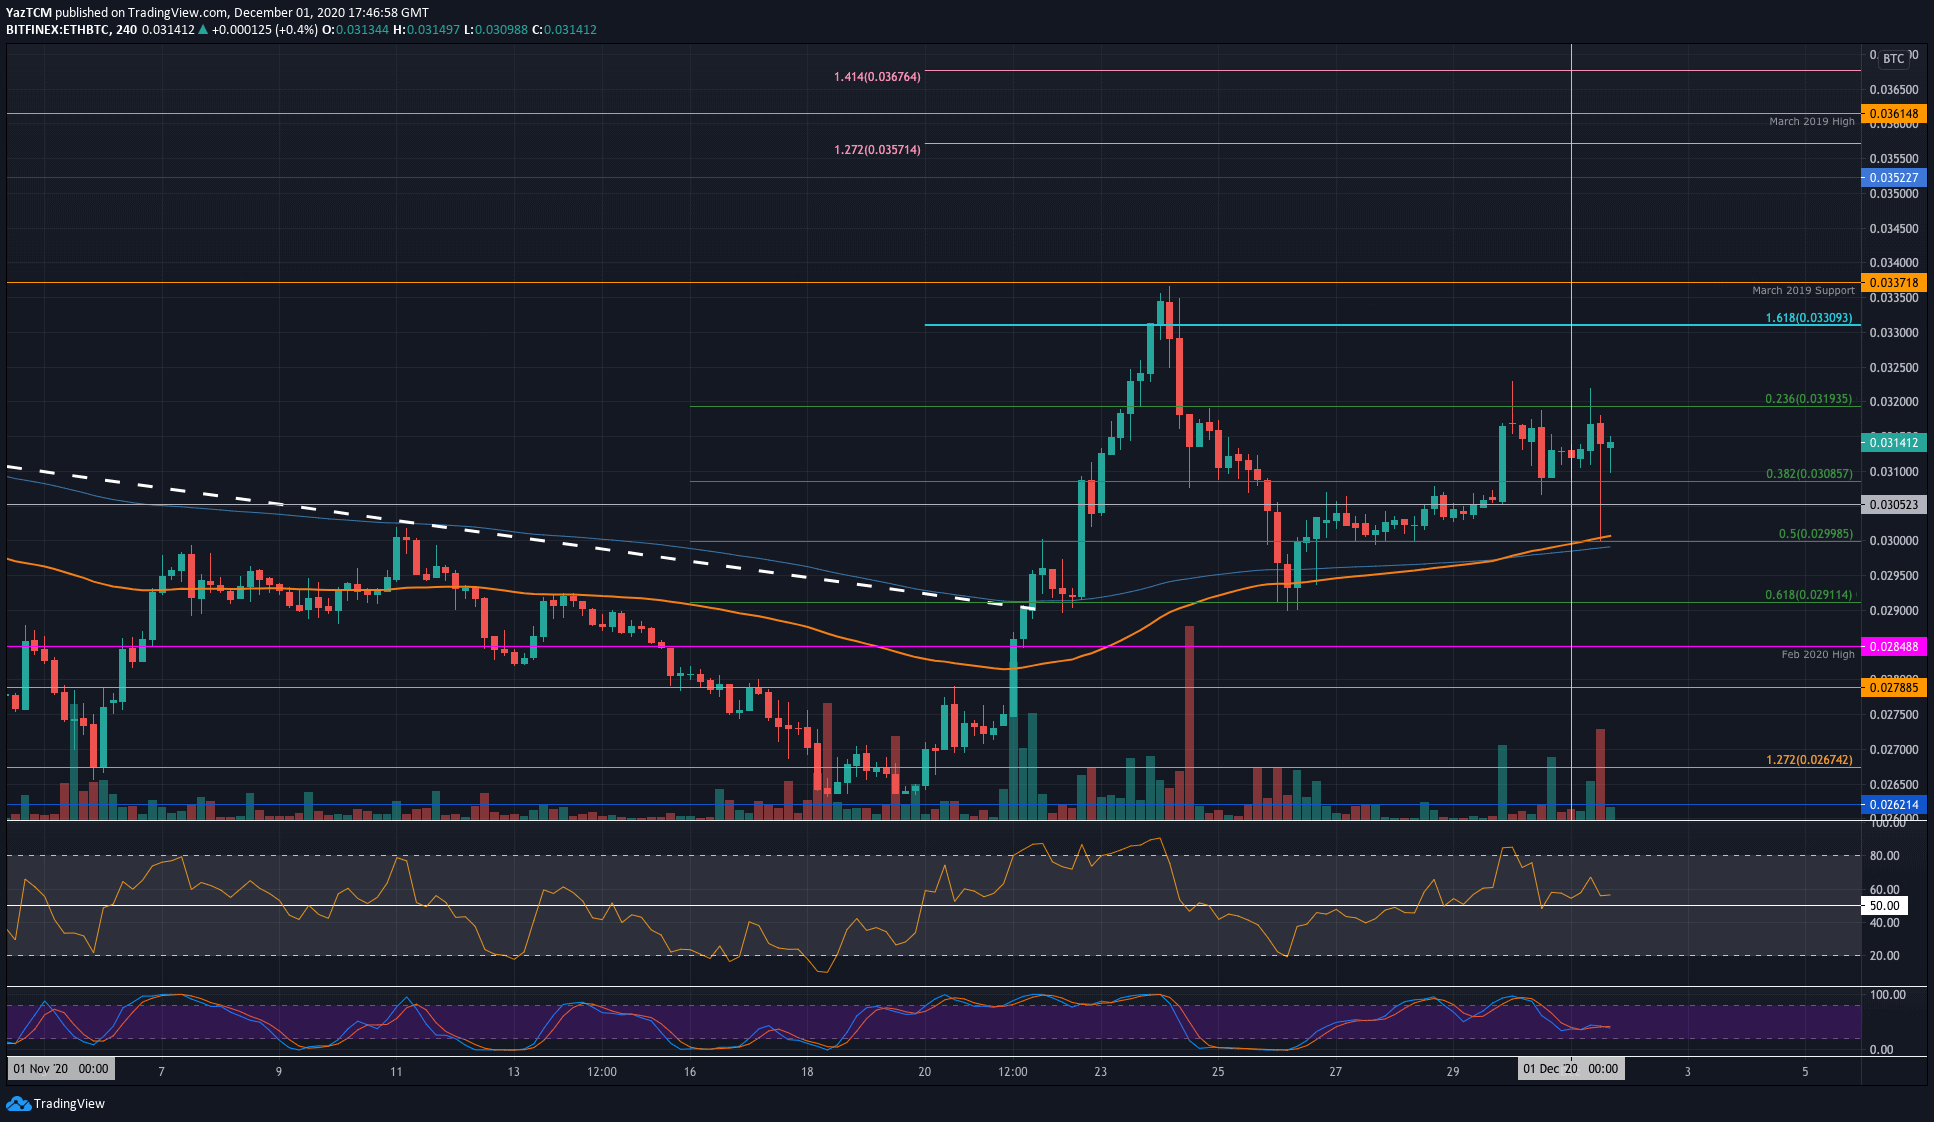
Key Support Levels: 0.031 BTC, 0.03 BTC, 0.0291 BTC.
Key Resistance Levels: 0.032 BTC, 0.033 BTC, 0.0337 BTC.
Against Bitcoin, Ethereum also spiked lower as it dropped from 0.0318 BTC to hit as low as 0.03 BTC. There, it found support at the .5 Fib Retracement, which allowed it to rebound higher to reach the current 0.0314 BTC level.
Looking ahead, the first level of resistance lies at 0.032 BTC. This is followed by 0.033 BTC, 0.0337 BTC, and 0.0345 BTC.
On the other side, support first lies at 0.031 BTC. This is followed by 0.03 BTC (.5 Fib), 0.0295 BTC, 0.0291 BTC (.618 Fib), and 0.0284 BTC (Feb 2020 High).
The RSI is also showing that the bullish momentum is slowly starting to fade here.