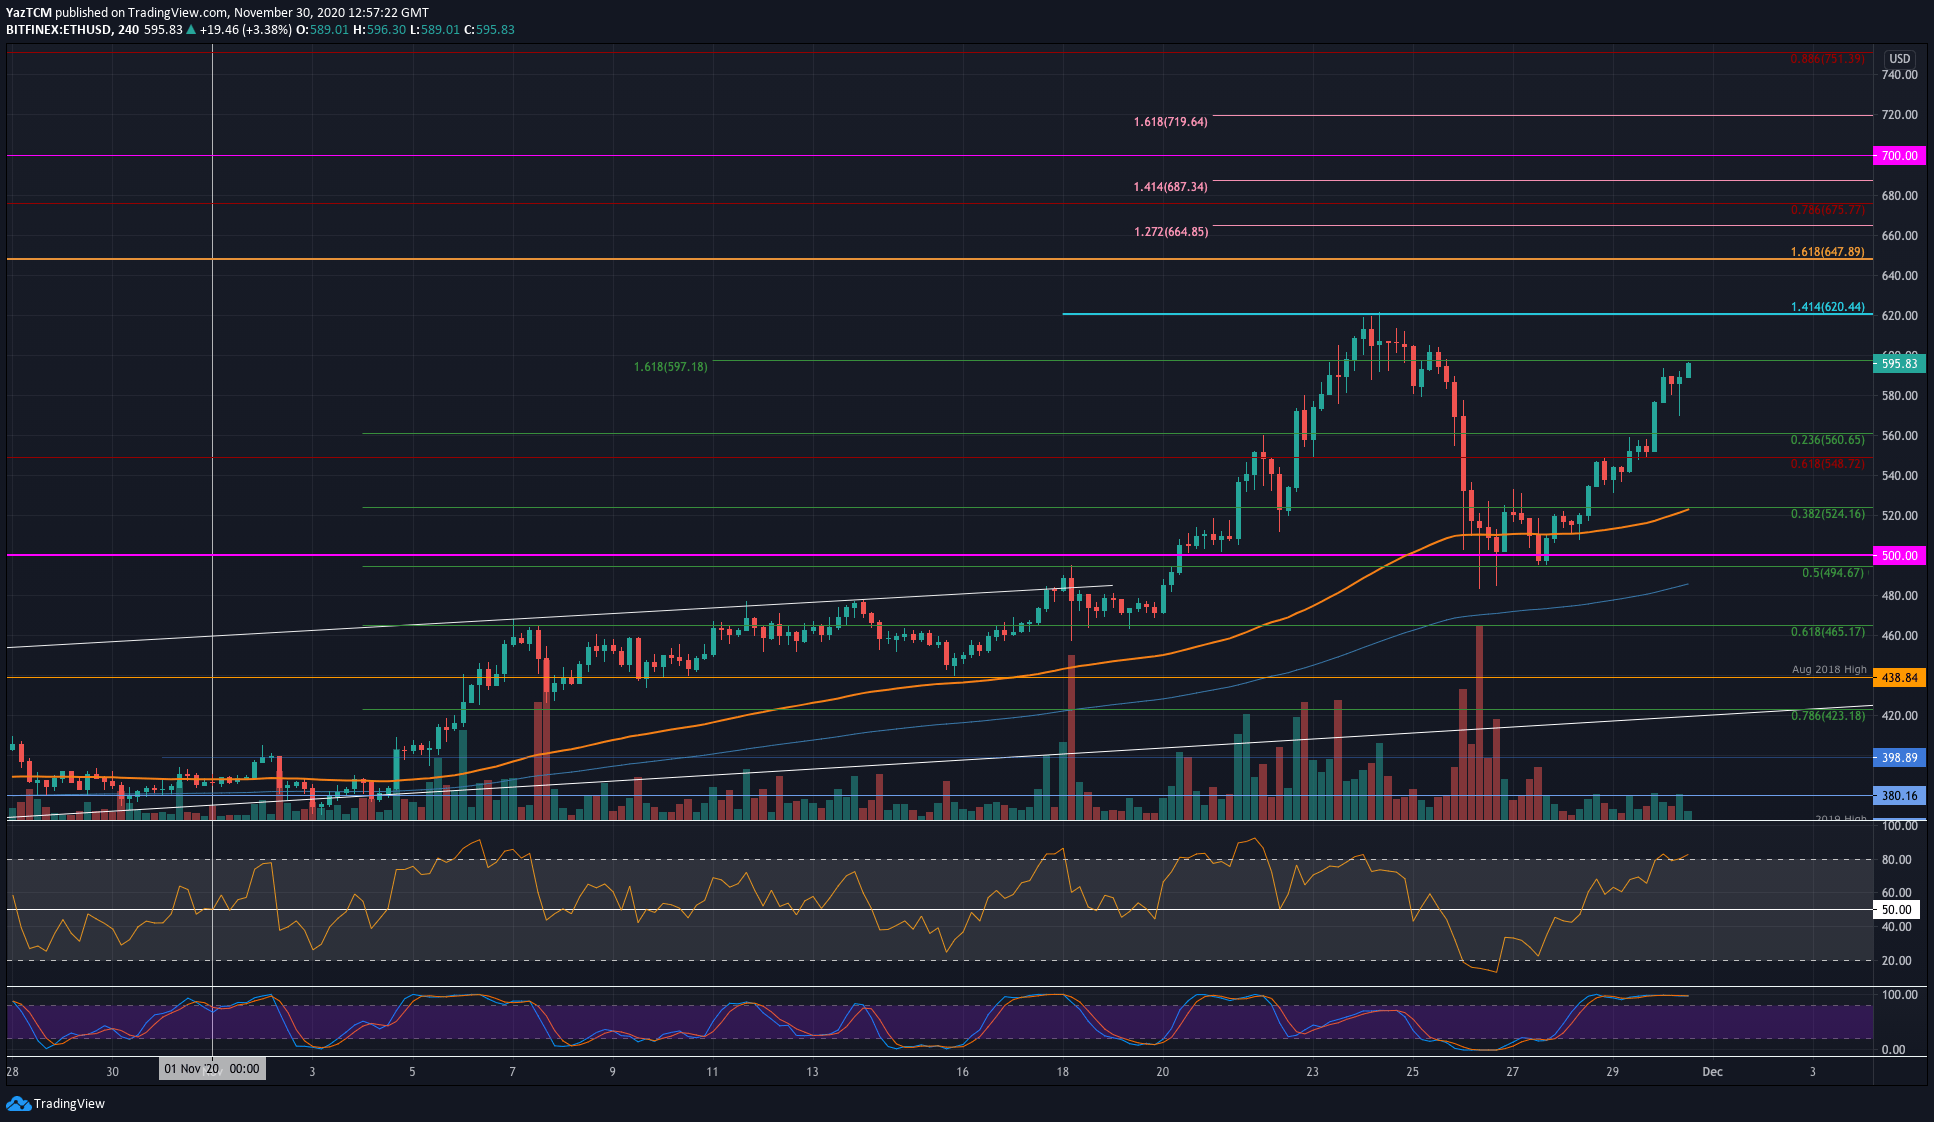
ETH/USD 4HR Chart. Source: TradingView
Key Support Levels: $560, $524, $500.
Key Resistance Levels: $600, $620, $650.
Ethereum dropped from the $620 resistance toward the end of last week as Thanksgiving put a downer on the market. It continued to drop over the weekend as it penetrated beneath $600 and fell as low as $495, where it found support at the .5 Fib Retracement.
From there, ETH started to rebound higher as it broke back above $550 to hit $595 at the time of writing. The coin is well on the way to head back above $600 again today.
Looking ahead, once the buyers break $600, the first level to look at is at $620. Above this, resistance lies at $650, $665 (1.272 Fib Extension), $675 (bearish .786 Fib), and $687 (1.414 Fib Extension).
On the other side, the first level of support lies at $560 (.236 Fib). Beneath this, support lies at $524 (.382 Fib), $500, and $495 (.5 Fib).
Both the 4HR RSI and Stochastic RSI are in overbought conditions, which could suggest the buyers might be overextended.
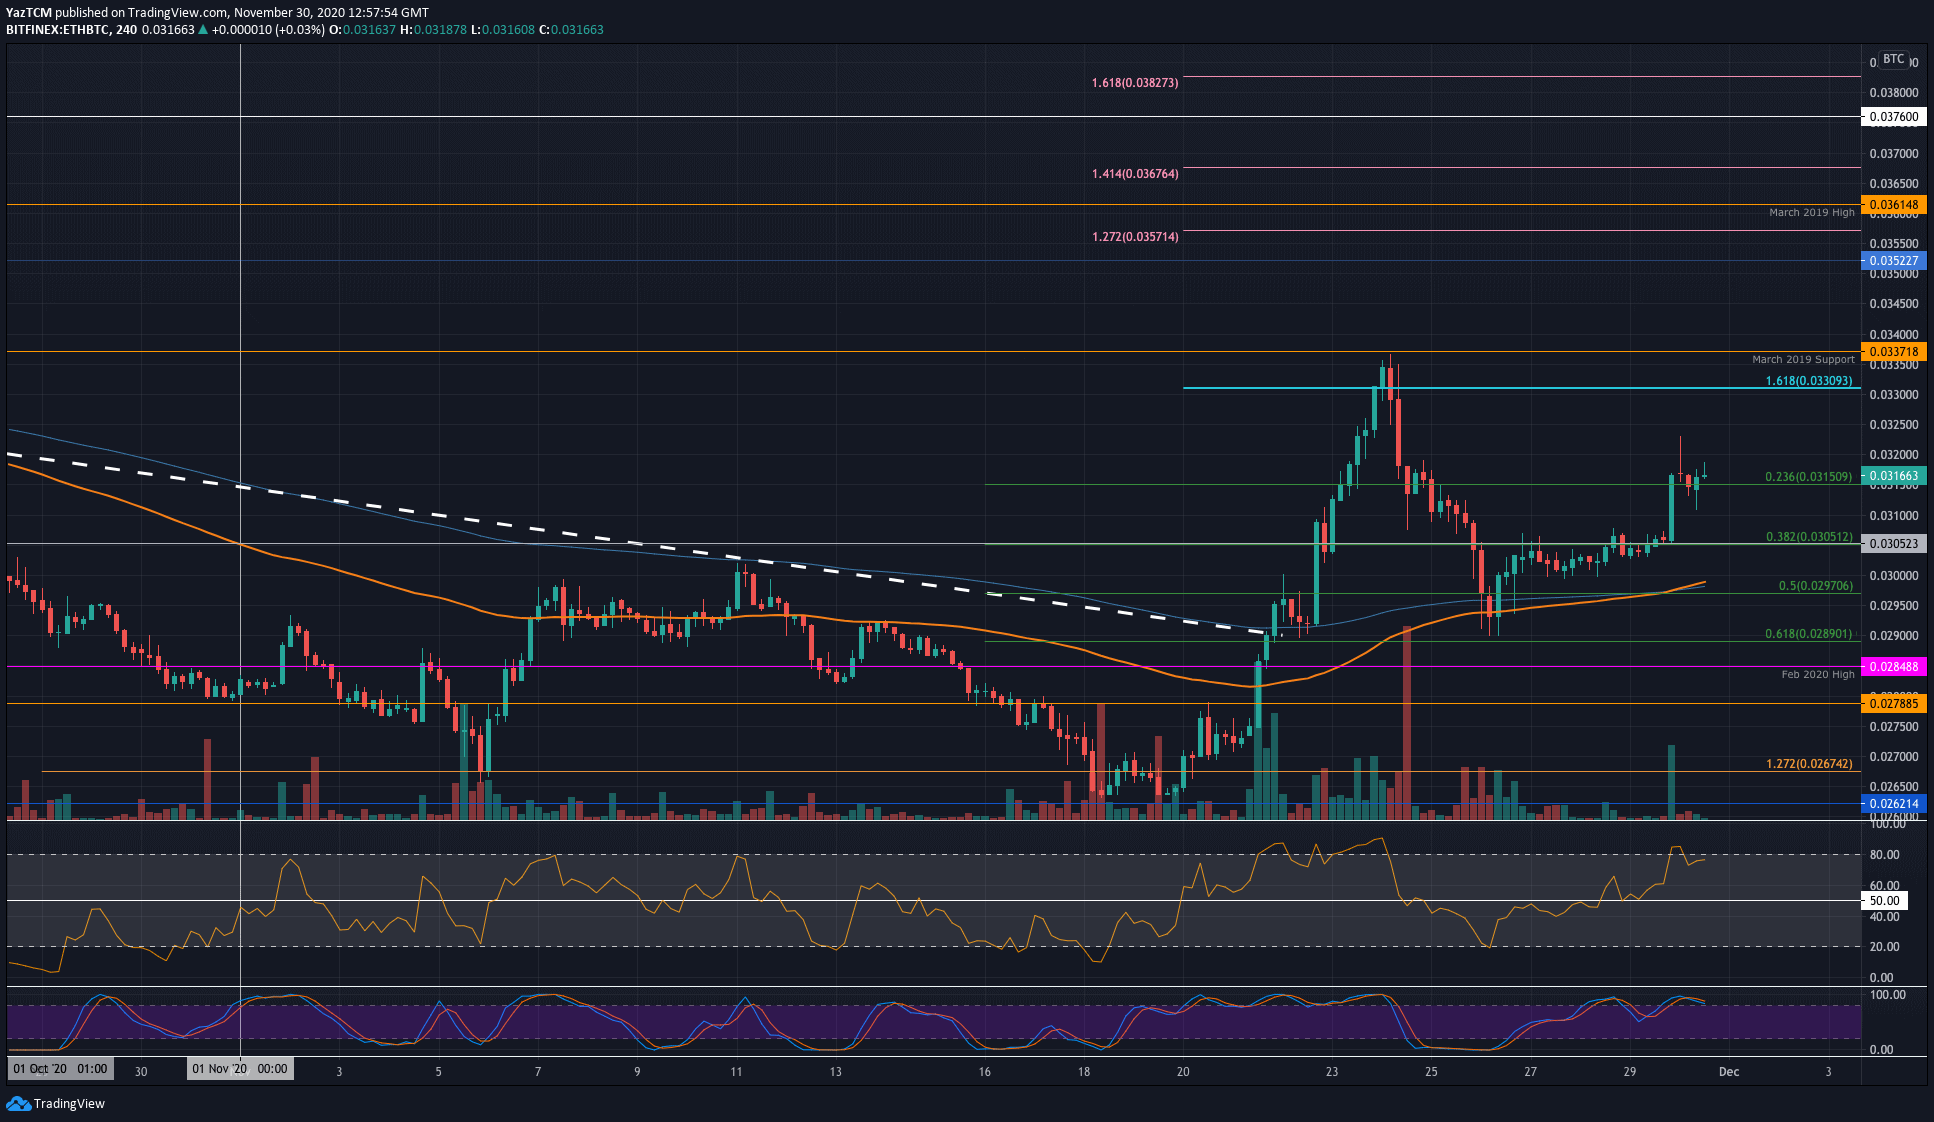
Key Support Levels: 0.031 BTC, 0.0305 BTC, 0.0297 BTC.
Key Resistance Levels: 0.032 BTC, 0.033 BTC, 0.0337 BTC.
Against Bitcoin, Ethereum fell lower last week from the 0.0337 BTC level. It continued to drop until support was found around 0.029 BTC on Friday.
The coin rebounded over the weekend but struggled to break 0.0305 BTC until earlier today, when it pushed higher to reach 0.0316 BTC.
Looking ahead, if the buyers continue to push above 0.032 BTC, the first level of higher resistance lies at 0.0325 BTC. This is followed by 0.033 BTC and 0.0337 BTC (November highs & March 2019 Support). Above this, additional resistance lies at 0.0345 BTC 0.035 BTC.
On the other side, support is first expected at 0.031 BTC. Beneath this, support lies at 0.0305 BTC, 0.0297 BTC (.5 Fib), and 0.029 BTC.
The 4HR Stocahstic RSI is shaping up for a bearish crossover signal that could send the market lower.