The Ethereum price action has the potential to form a double top pattern. Currently, the bulls are fighting to break through the psychological resistance at $3,000. In the last seven days, the cryptocurrency market has been positively correlated with the US stock market.
ETH has surged by about 20% over the previous ten days. But are these signals confirming the end of the downtrend?
This analysis looks into the price structure and on-chain data to see what challenges ETH faces in its recovery trend.
Technical Analysis By Grizzly
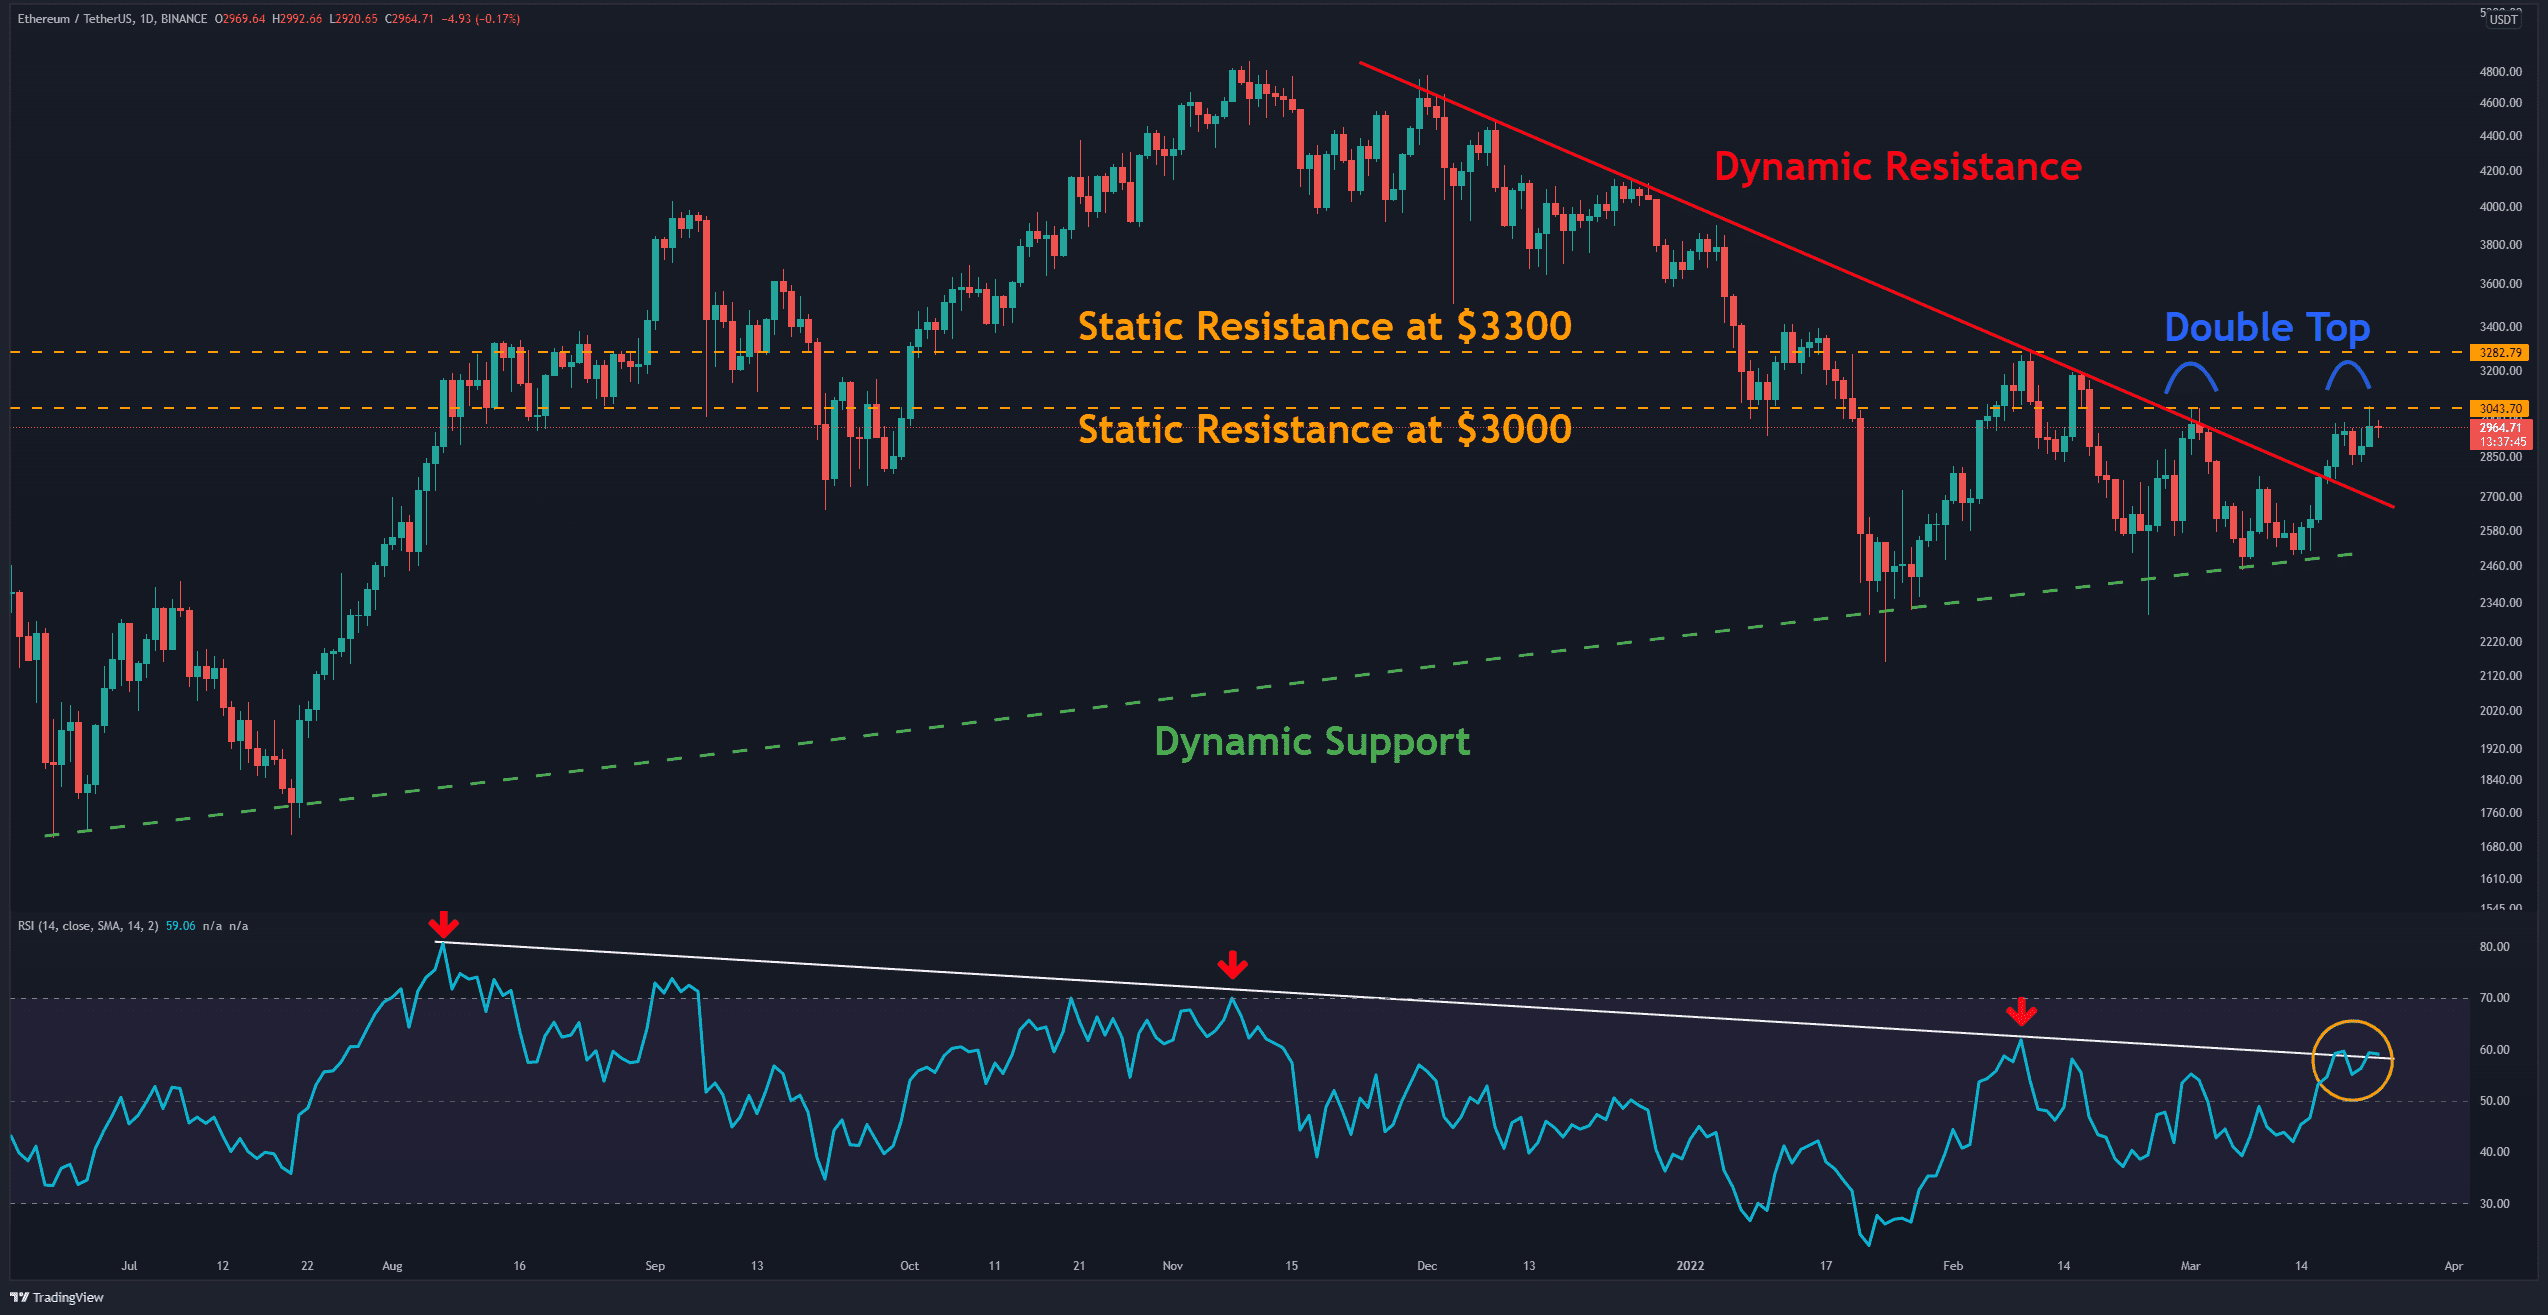
The dynamic support (marked by green) indicates ETH forming higher lows which is a must for a healthy uptrend on the daily timeframe. After overcoming the dynamic resistance (marked by red), the cryptocurrency is now facing static resistance at $3,000. The RSI-14 is also retesting (yellow circle) the downtrend line (marked white) in the bullish area.
If the bulls can cross above this area, technically, one can talk about the end of the downtrend when the price can at least form a higher high (above $3300) and confidence might return to the market. Otherwise, due to the potential of developing a double top pattern, ETH can descend to the support areas at $2700 and $2500.
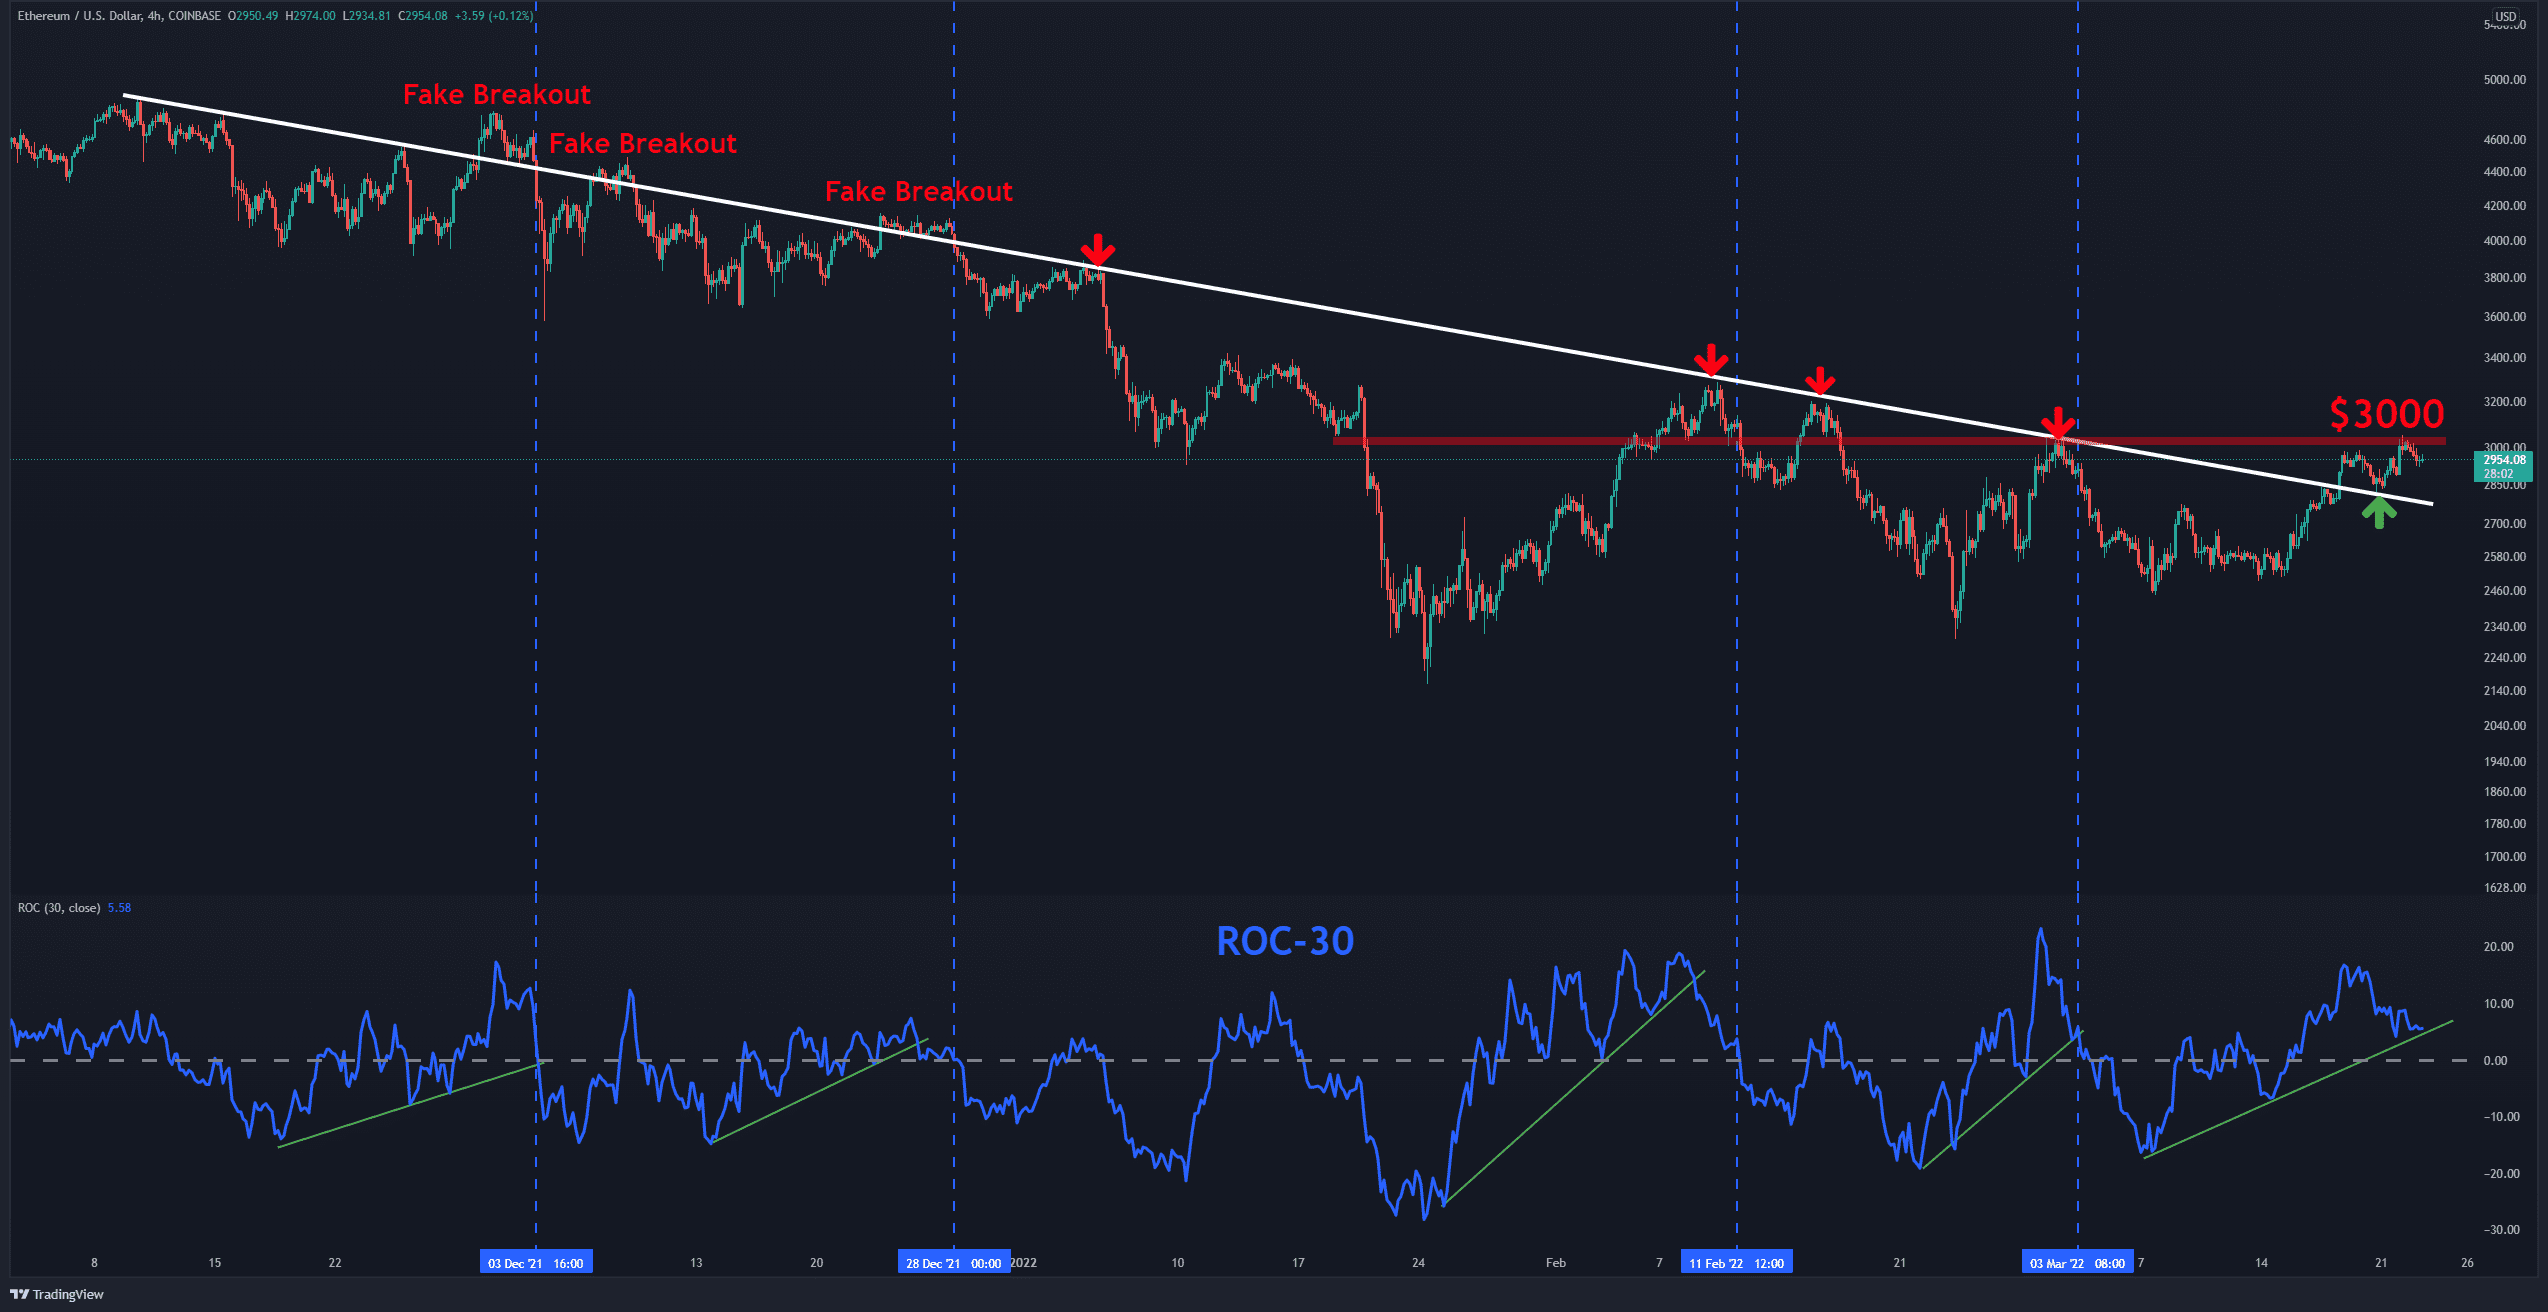
On the 4-hour timeframe, ETH was able to break above the trend line (marked by white), which has played an essential role in the downtrend since the all-time high in November. By adding the ROC-30 to the chart, a correction has been inevitable whenever this index has broken below its dynamic support (marked by green) and crosses the baseline.
Currently, this indicator is moving to the dynamic support, and if it can not keep moving up and crosses down the baseline, it might provide a strong signal for upcoming declines. As discussed on the daily chart, the main challenge for ETH is the resistance at $3000.
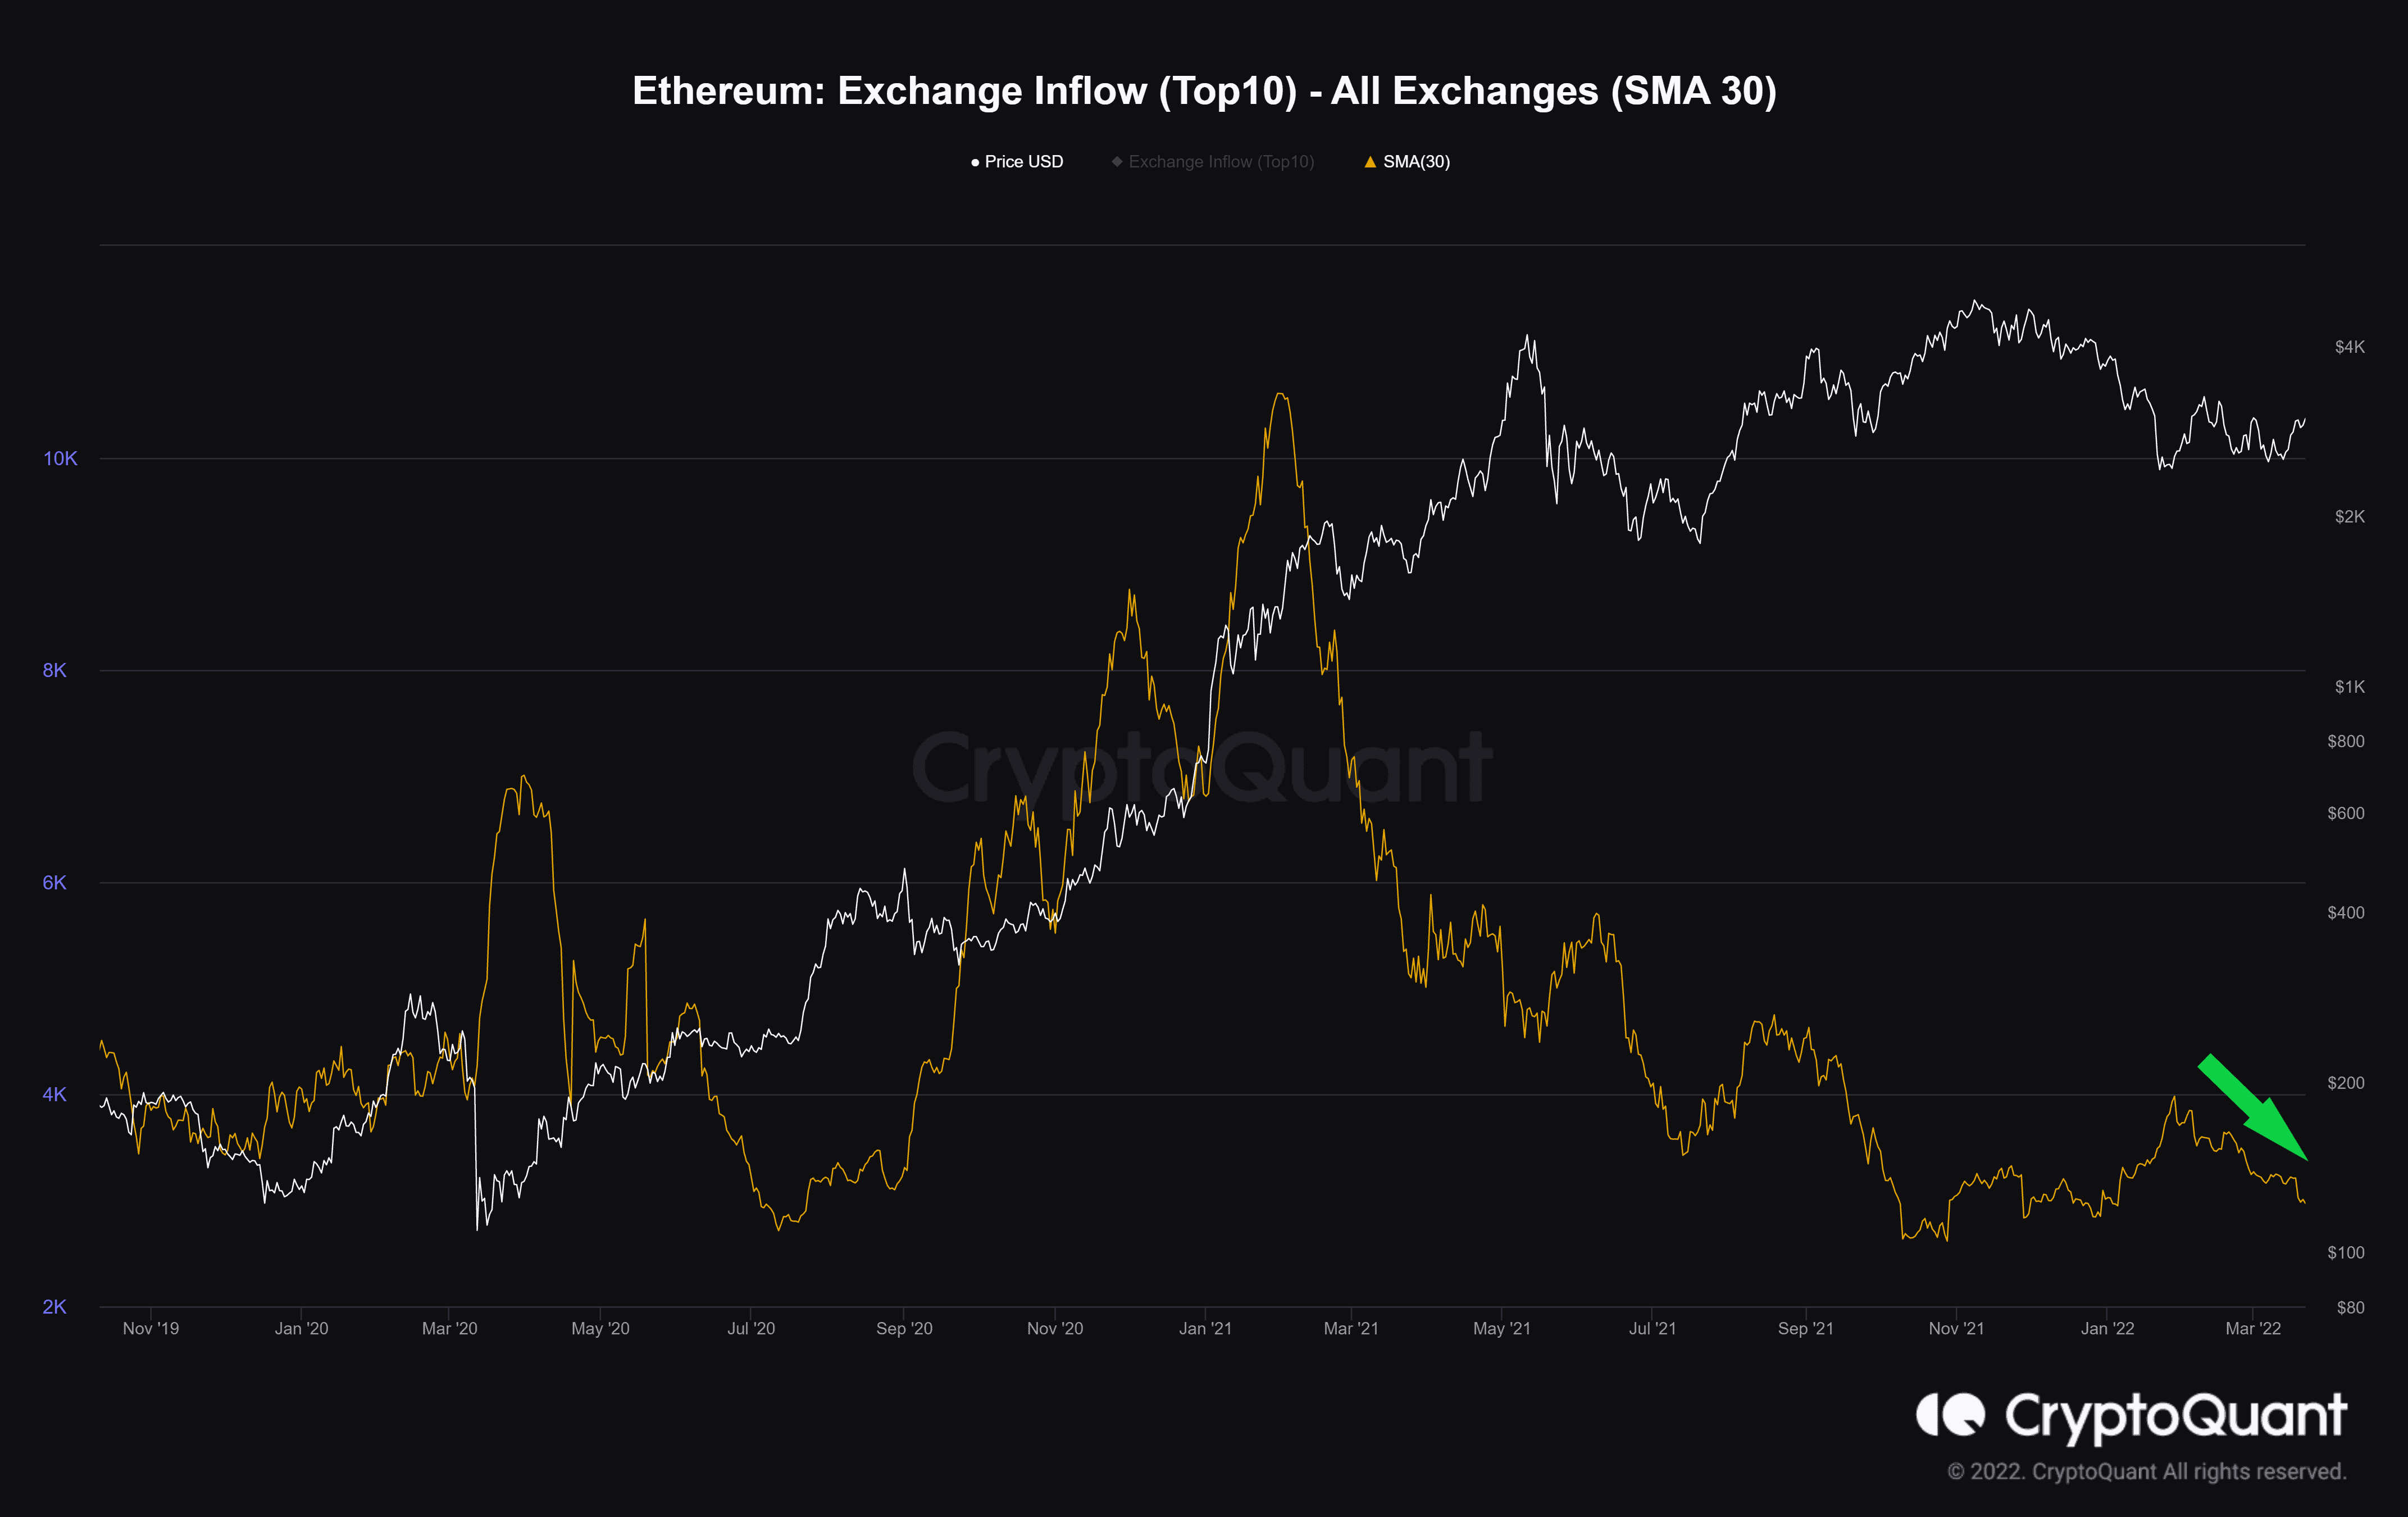
This section studies the total volume attributed to the top 10 inflow/outflows to/from all exchanges.
As shown in the chart below, when the cumulative top 10 transactions outflow from exchange moves up, one can expect a price increase. A high value indicates that the demand by big investors who withdrew in large transactions has increased.
On the other hand, on the chart below, the total volume of the top 10 inflows to all exchanges are also decreasing. Higher value in this metric could indicate higher selling pressure and future price drops.
Considering these two metrics, the selling pressure from the whales may be decreasing, which could signal a possibility of a trend reversal. However, in the first step, ETH must be able to regain its lost support, as mentioned above.