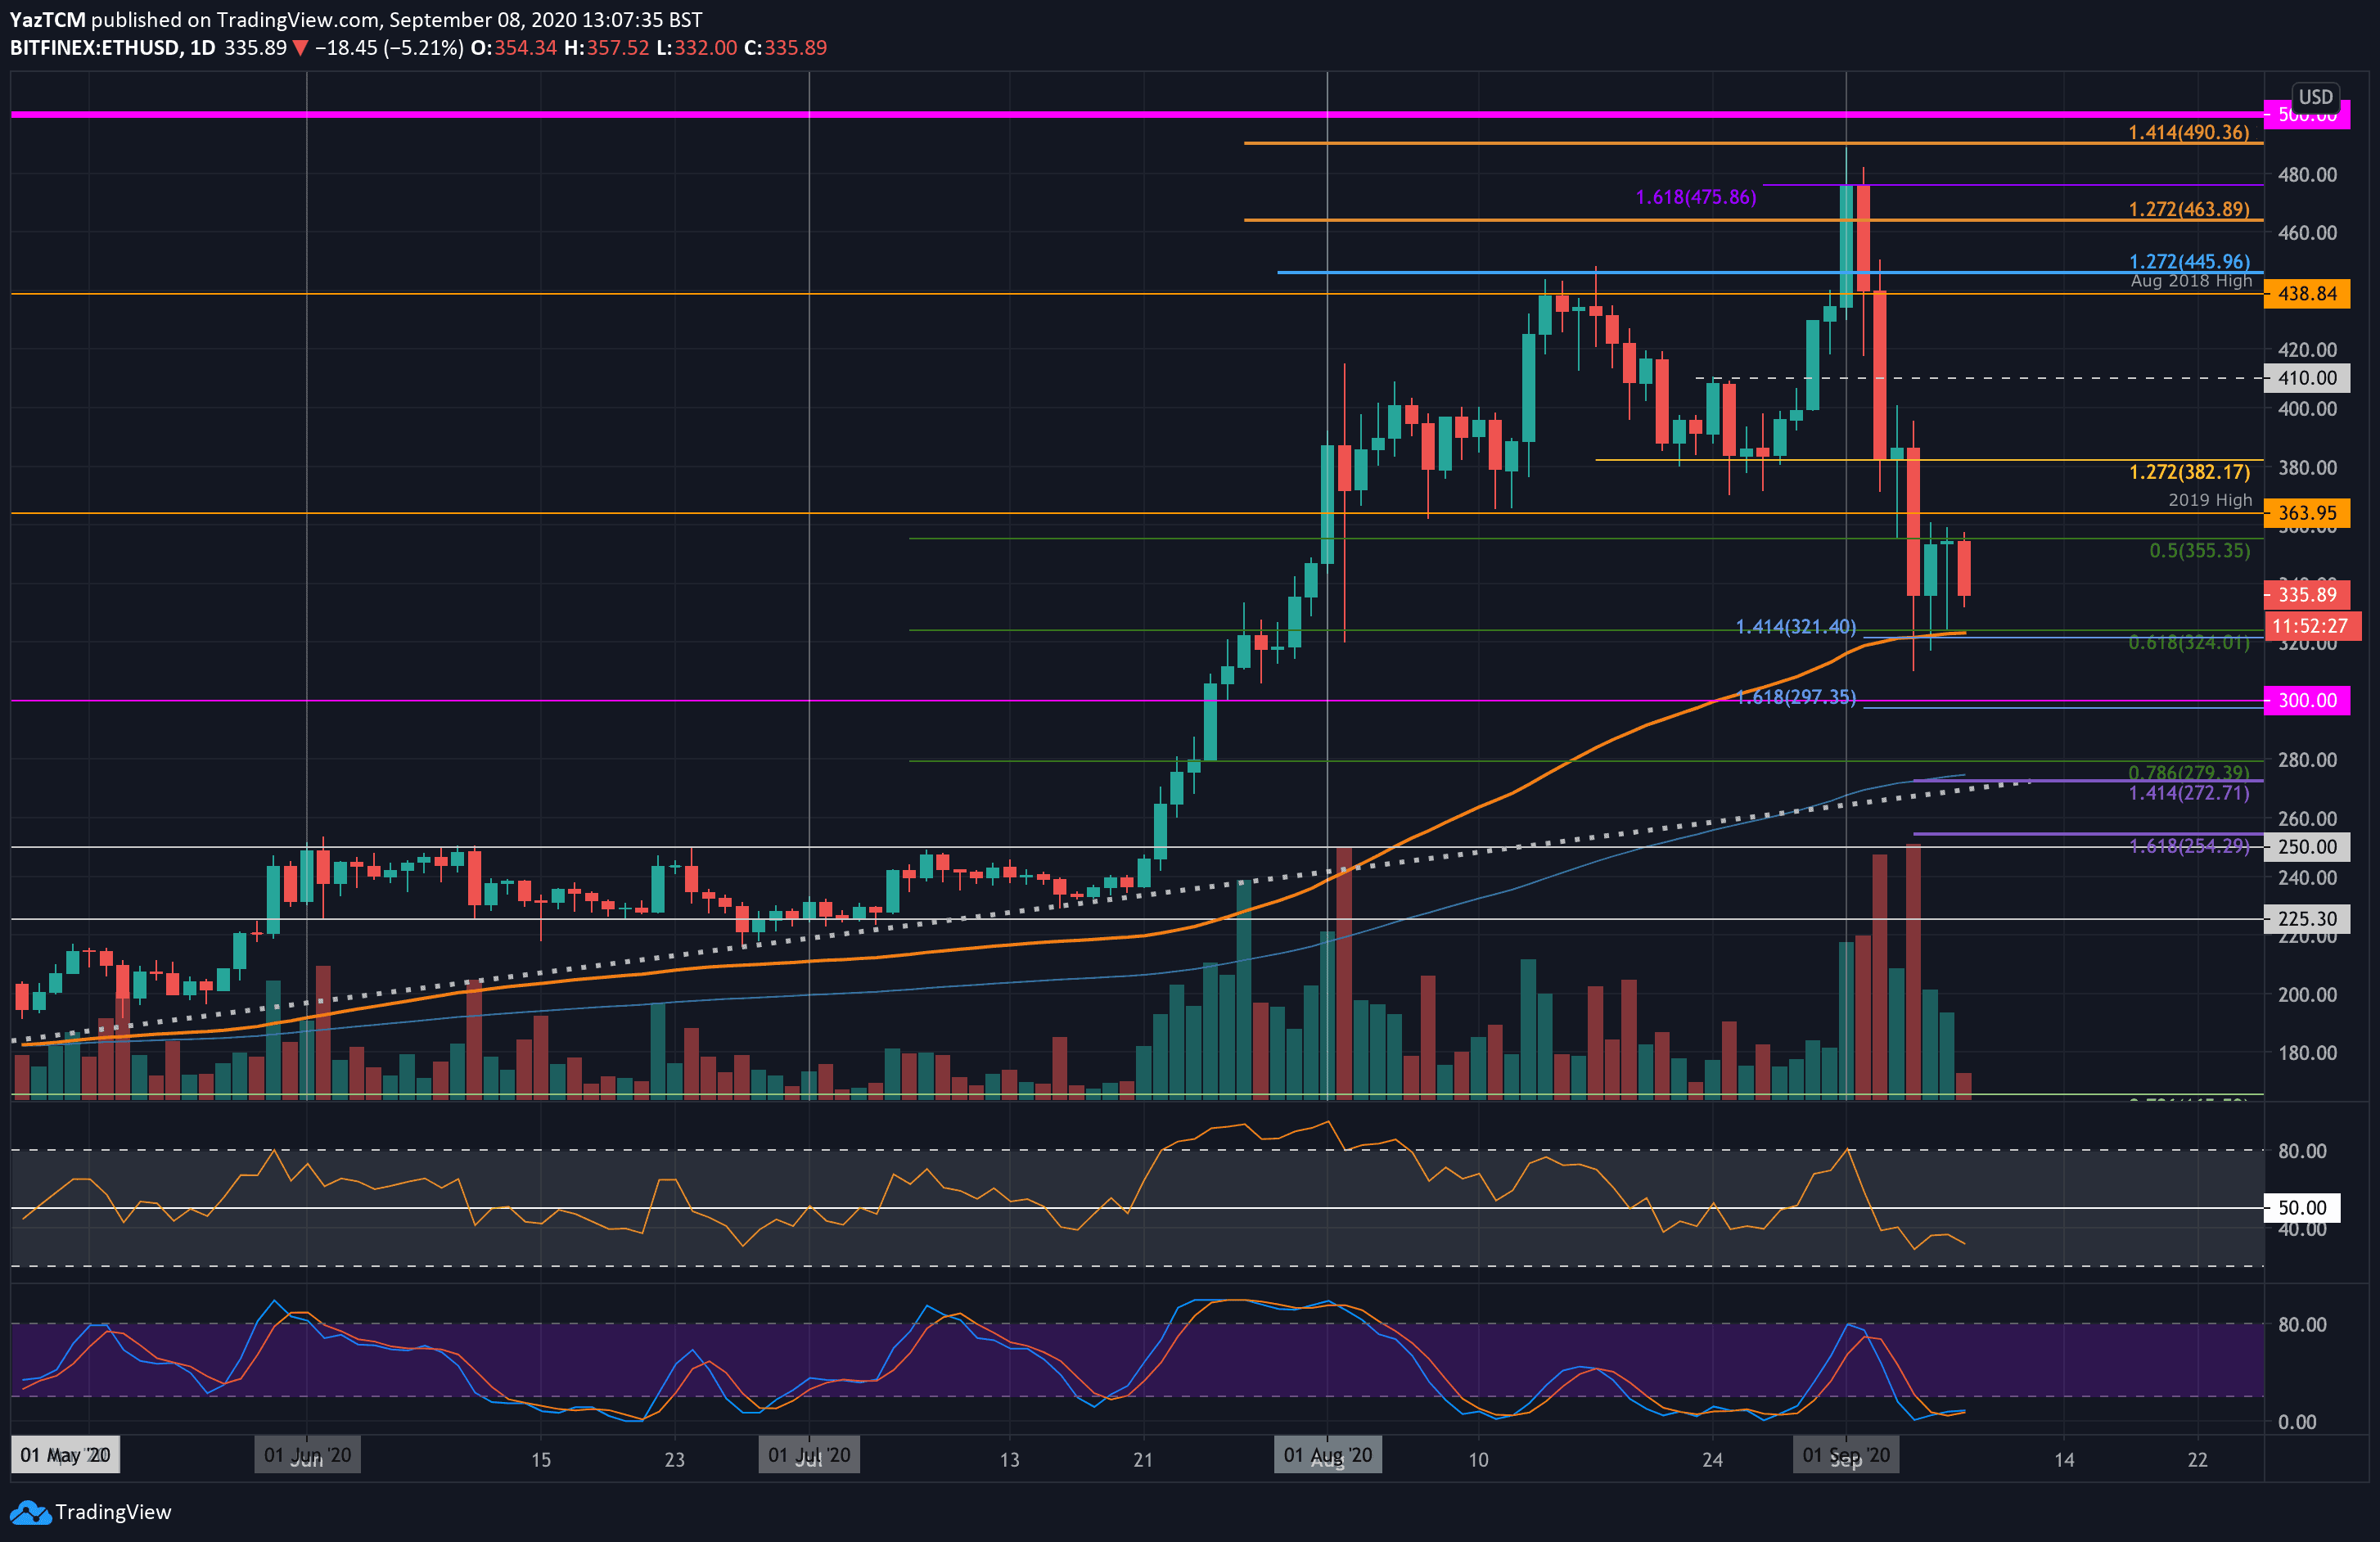
ETH/USD Daily Chart. Source: TradingView
Key Support Levels: $325, $300, $280.
Key Resistance Levels: $355, $364, $380.
Ethereum has been battling the $355 resistance level over the past three days of trading as the bulls fail to break it. Since the weekend, each daily candle has managed to close at the $335 support level.
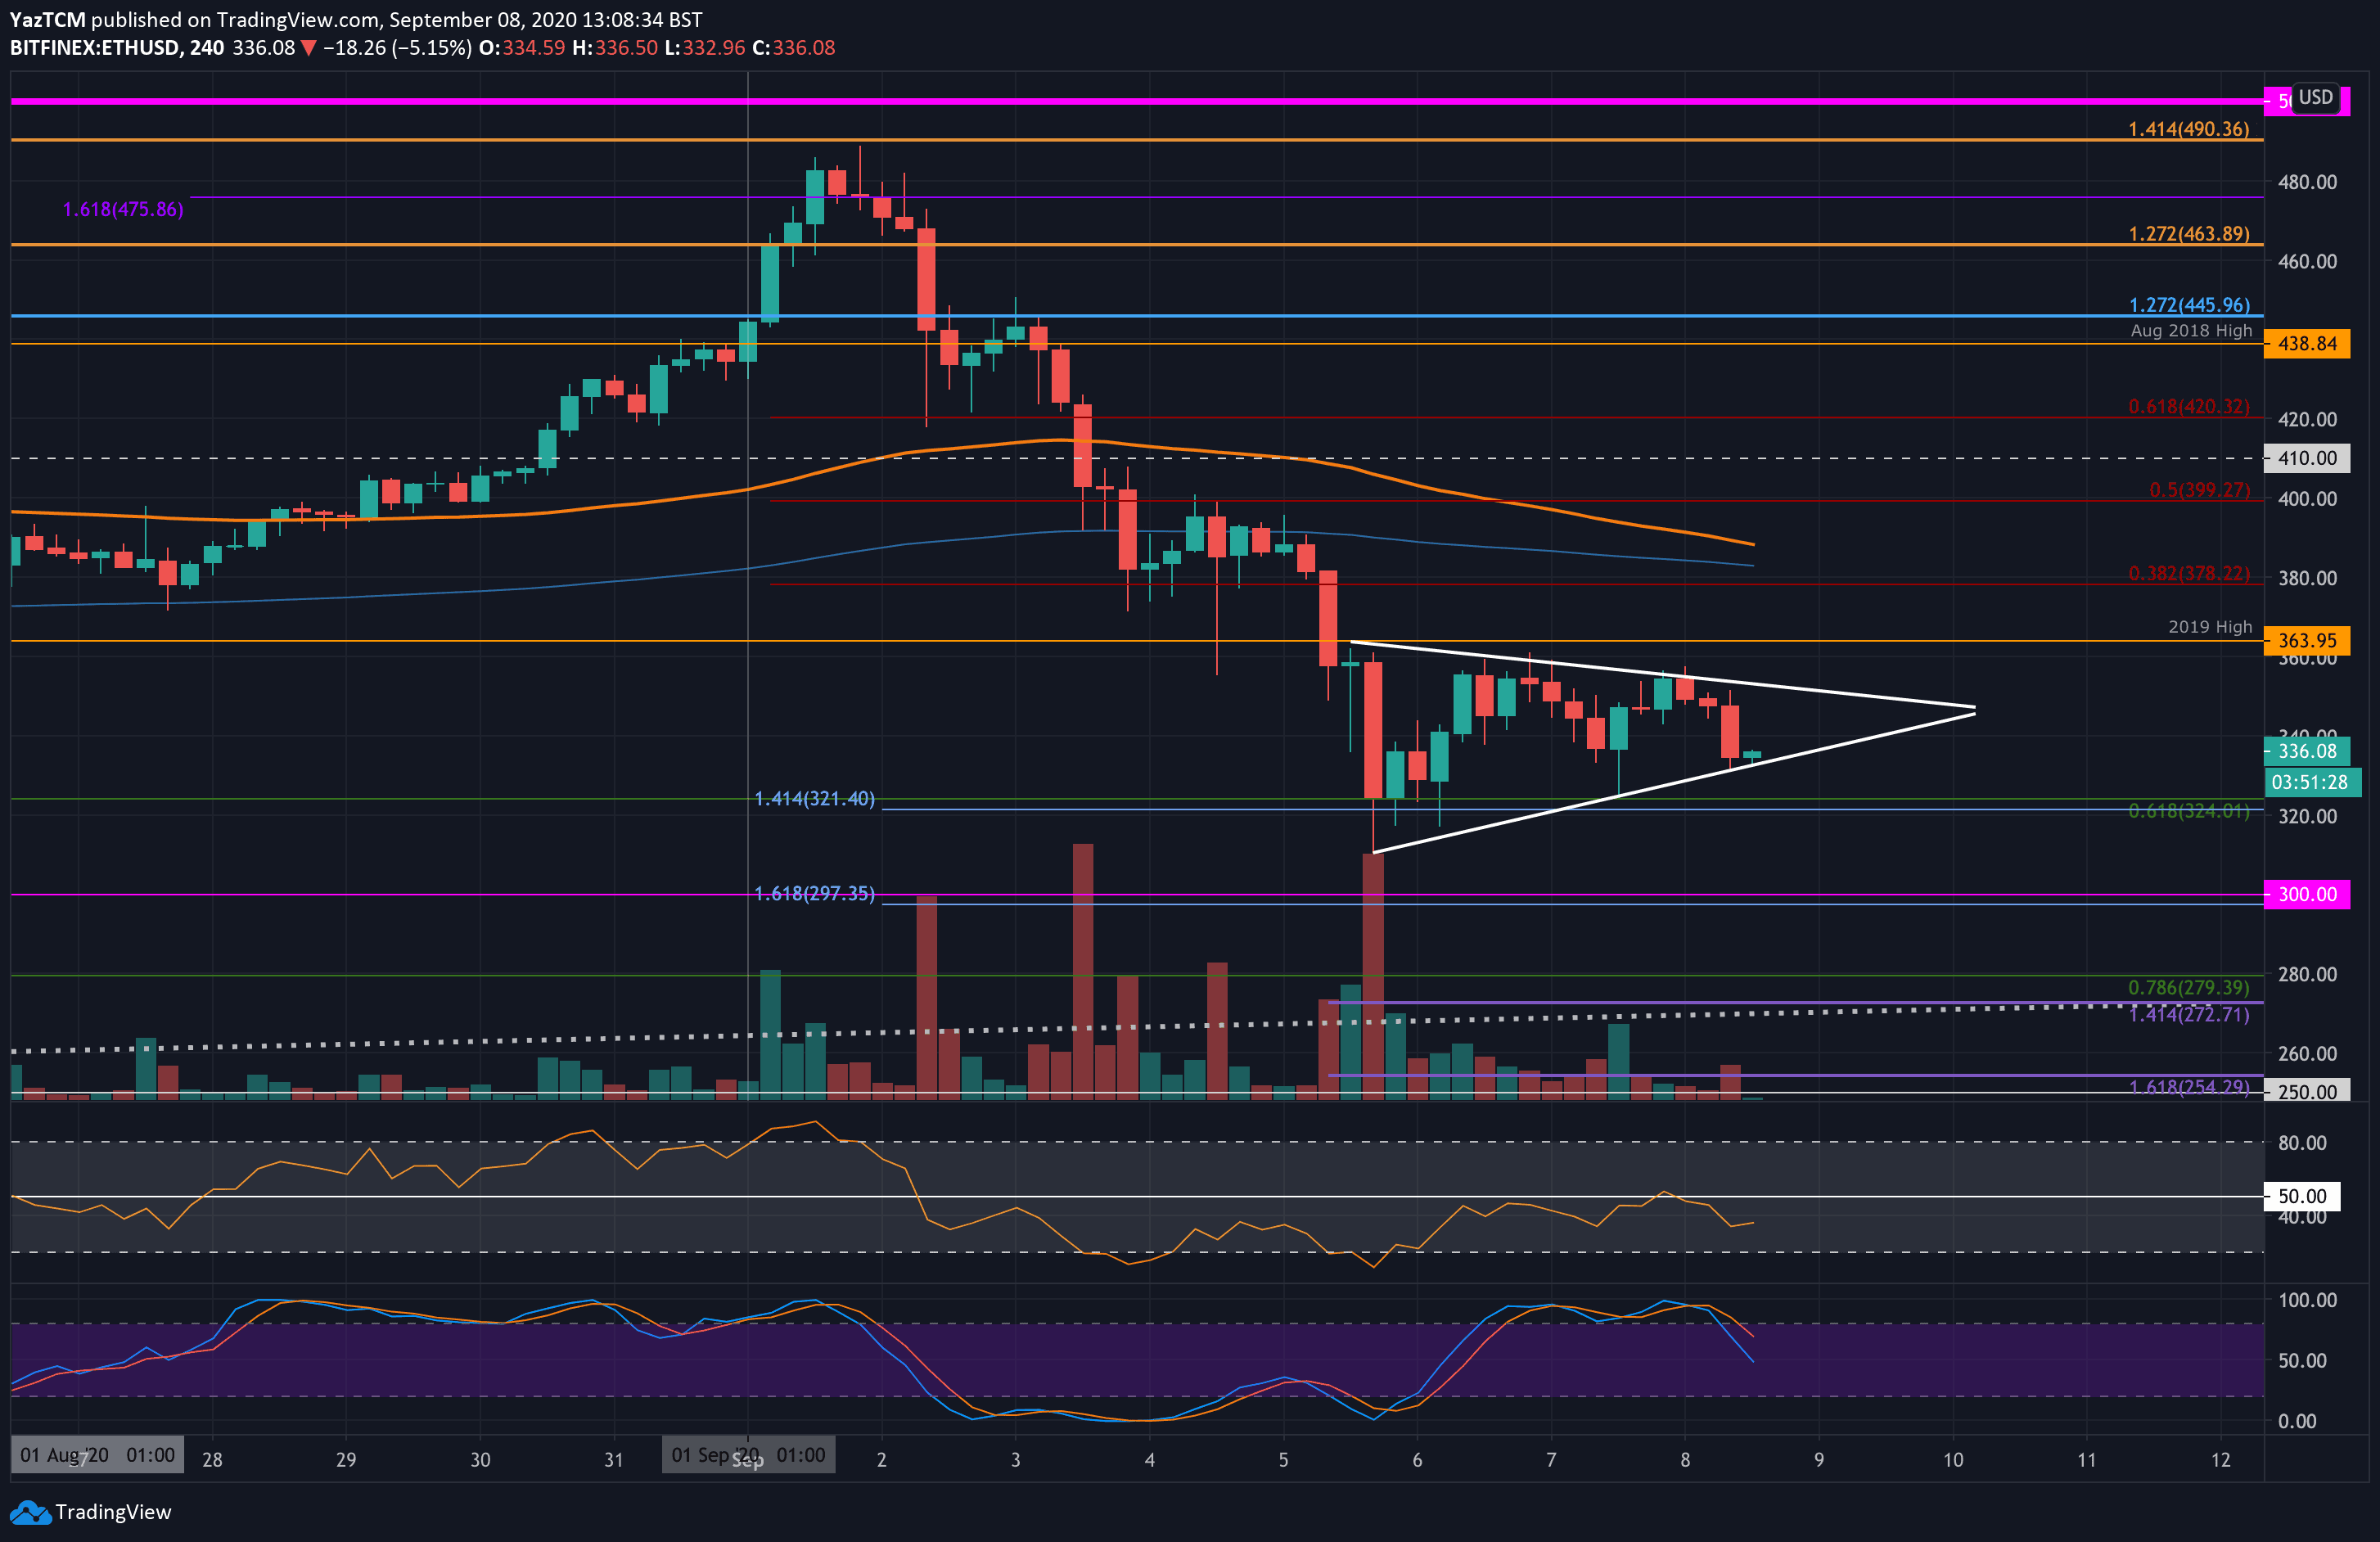
Looking at the 4HR chart, Ethereum has established a short term symmetrical triangle and would need to break this pattern to dictate the next direction for the market moving forward.
Looking at the 4HR chart, the first level of support lies at the lower boundary of the symmetrical triangle. Typically, symmetrical triangles break in the direction of the previous trend, which, in this case, would be bearish.
Beneath the triangle, support lies at $325 (.618 Fib Retracement & 100-day EMA) and $300. Looking at the daily chart, if $300 breaks, added support is found at $280 (.786 Fib Retracement), $272 (200-day EMA & downside 1.414 Fib Extension), and a long term rising trend line (dotted line).
On the other side, the first level of resistance lies at the upper boundary of the triangle. Above this, resistance lies at $355, $364 (2019 High), and $380.
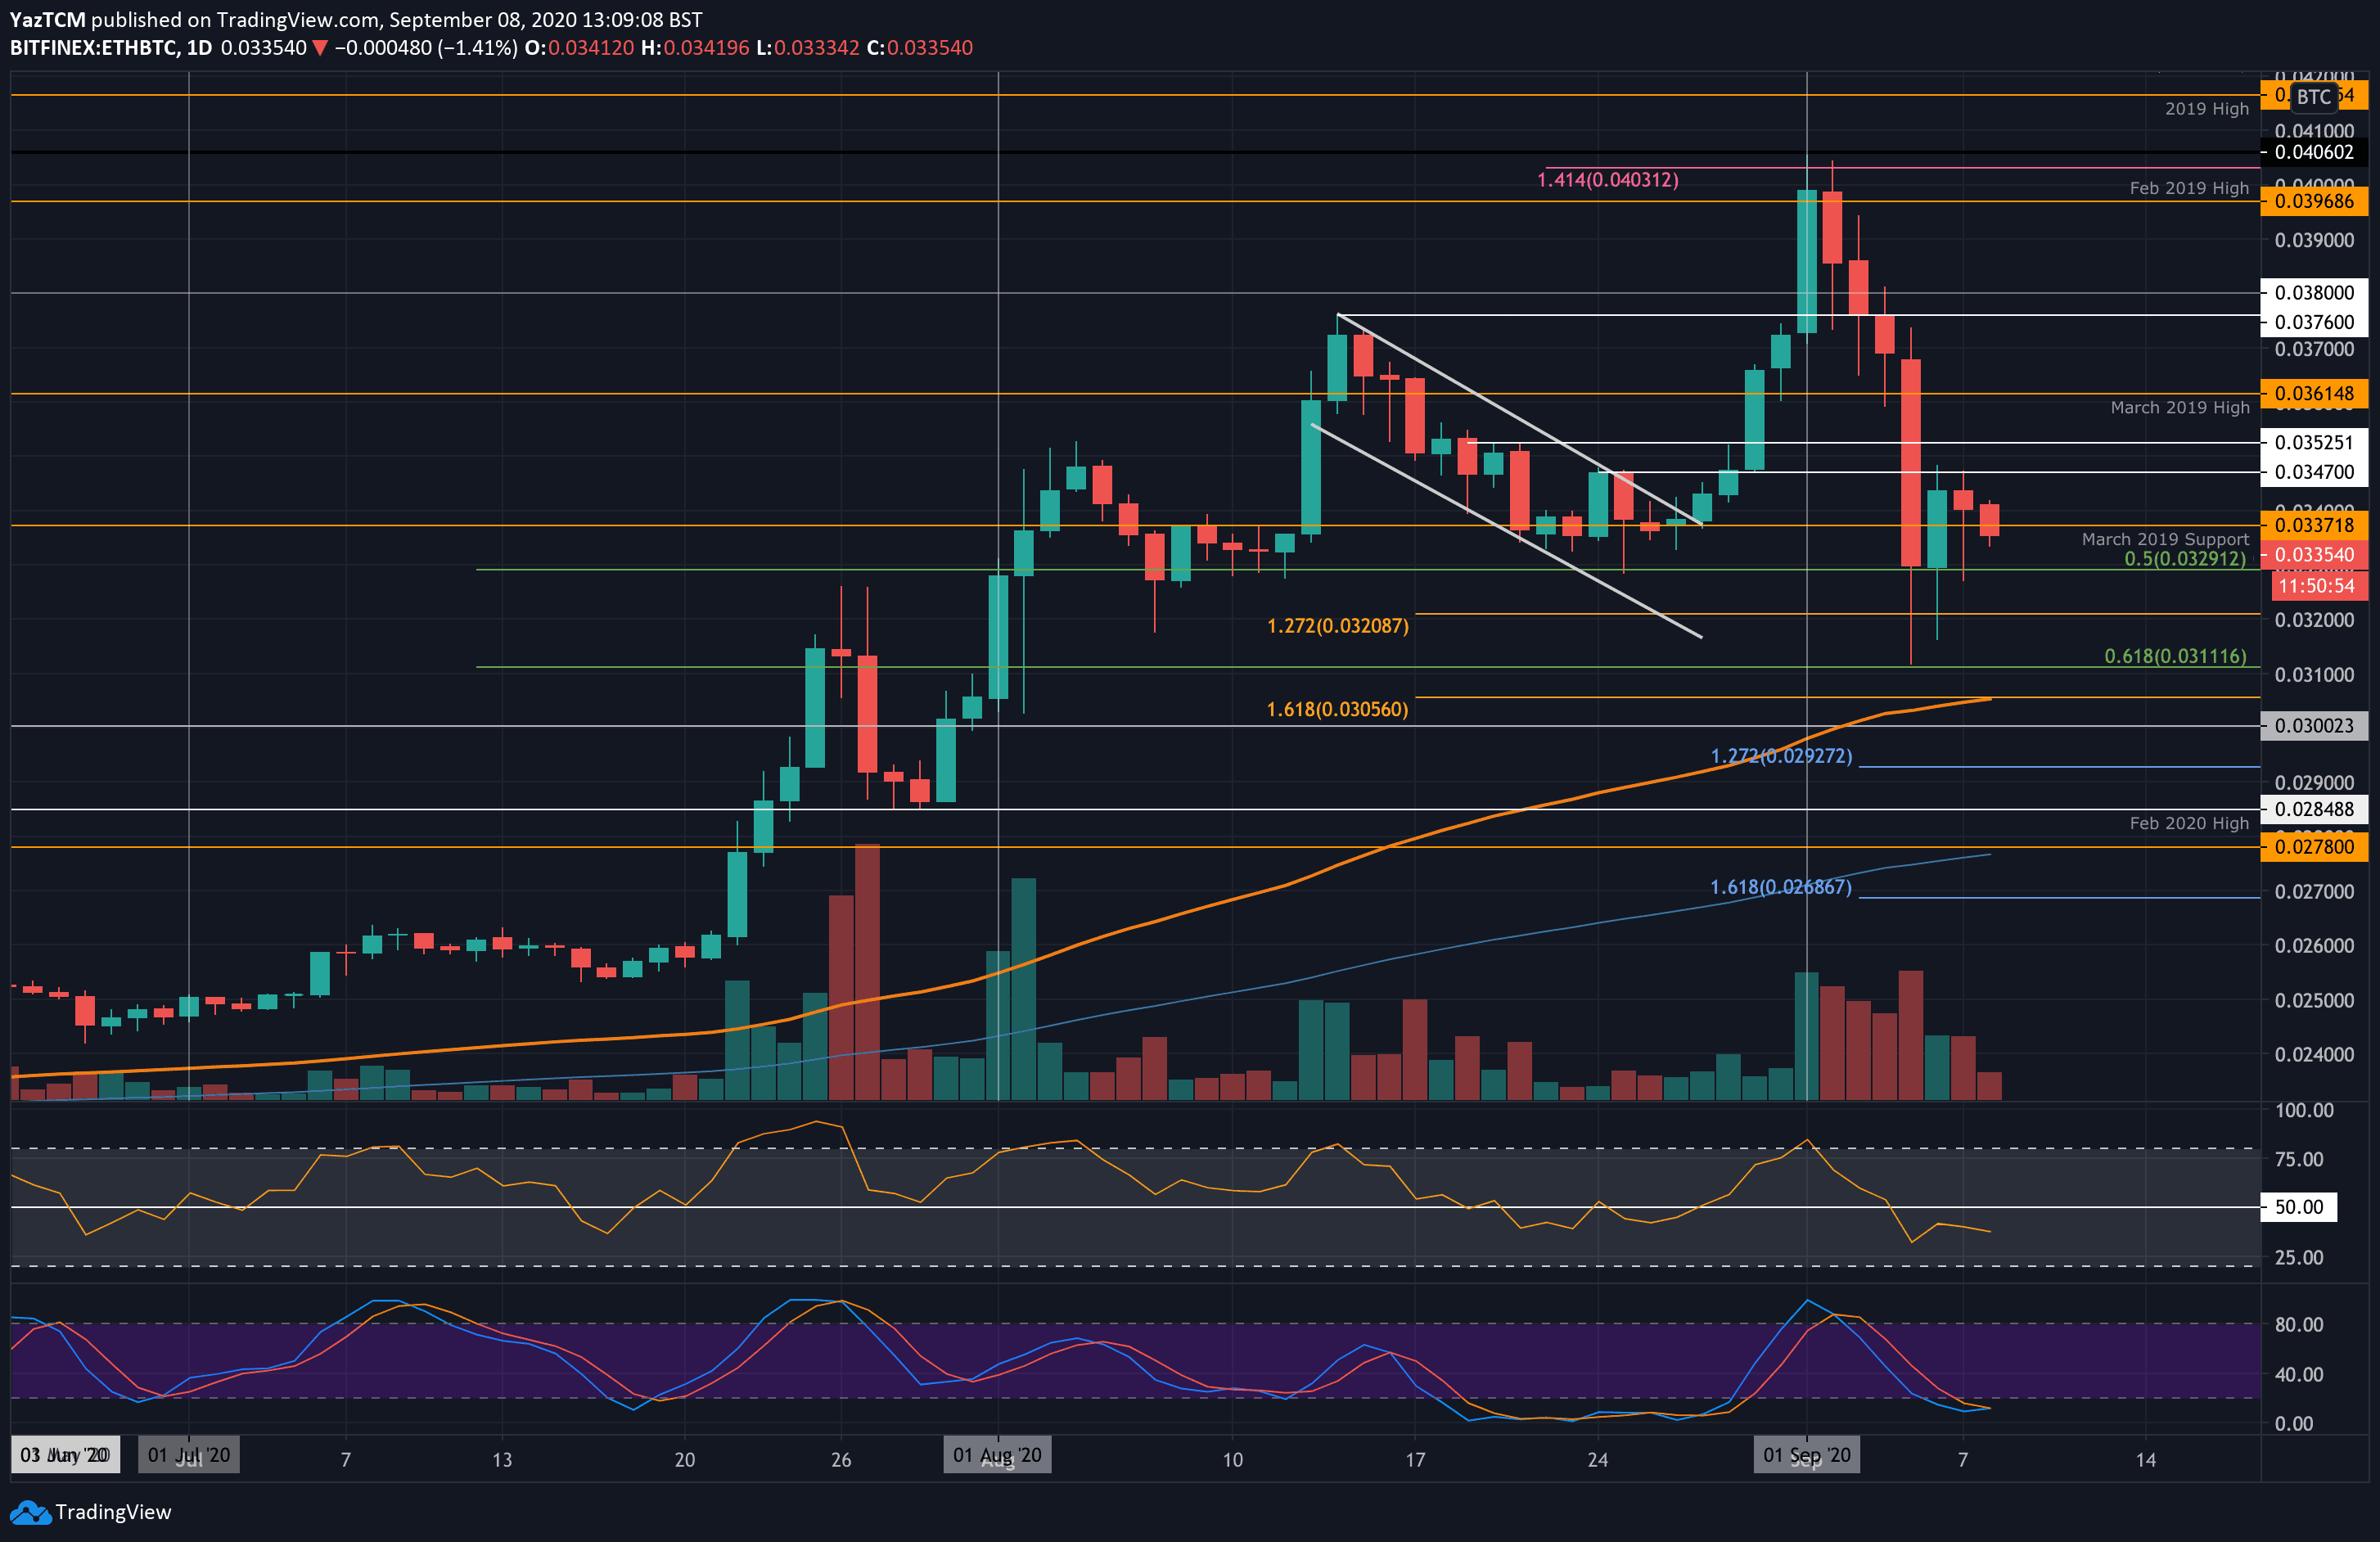
Key Support Levels: 0.0329 BTC, 0.032 BTC, 0.0311 BTC.
Key Resistance Levels: 0.0337 BTC, 0.0347 BTC, 0.0352 BTC
Ethereum has been testing the resistance at 0.0347 BTC over the past 2-days. It failed to break this level on each attempt and has started to drop lower as it trades at 0.0335 BTC.
Nevertheless, despite this drop, there is quite strong support at 0.0329 BTC, provided by a .5 Fib Retracement.
Looking ahead, if the sellers push lower, the first level of support lies at 0.0329 BTC (.5 Fib Retracement). Beneath this, support lies at 0.032 BTC (downside 1.272 Fib Extension), 0.0311 BTC (.618 Fib Retracement), and 0.0305 BTC (downside 1.618 Fib Extension & 100-day EMA).
On the other side, resistance is located at 0.0337 BTC, 0.0347 BTC, and 0.0352 BTC.
The Stochastic RSI is in oversold conditions, and a bullish crossover signal could end the current downtrend.