After a significant crash in the cryptocurrency market due to the FTX bankruptcy, Ethereum’s price has dropped to a decisive support level of $1K.
A further decline is expected if the mentioned level fails to hold. The upcoming price action should determine Ethereum’s mid-term direction.
By Shayan
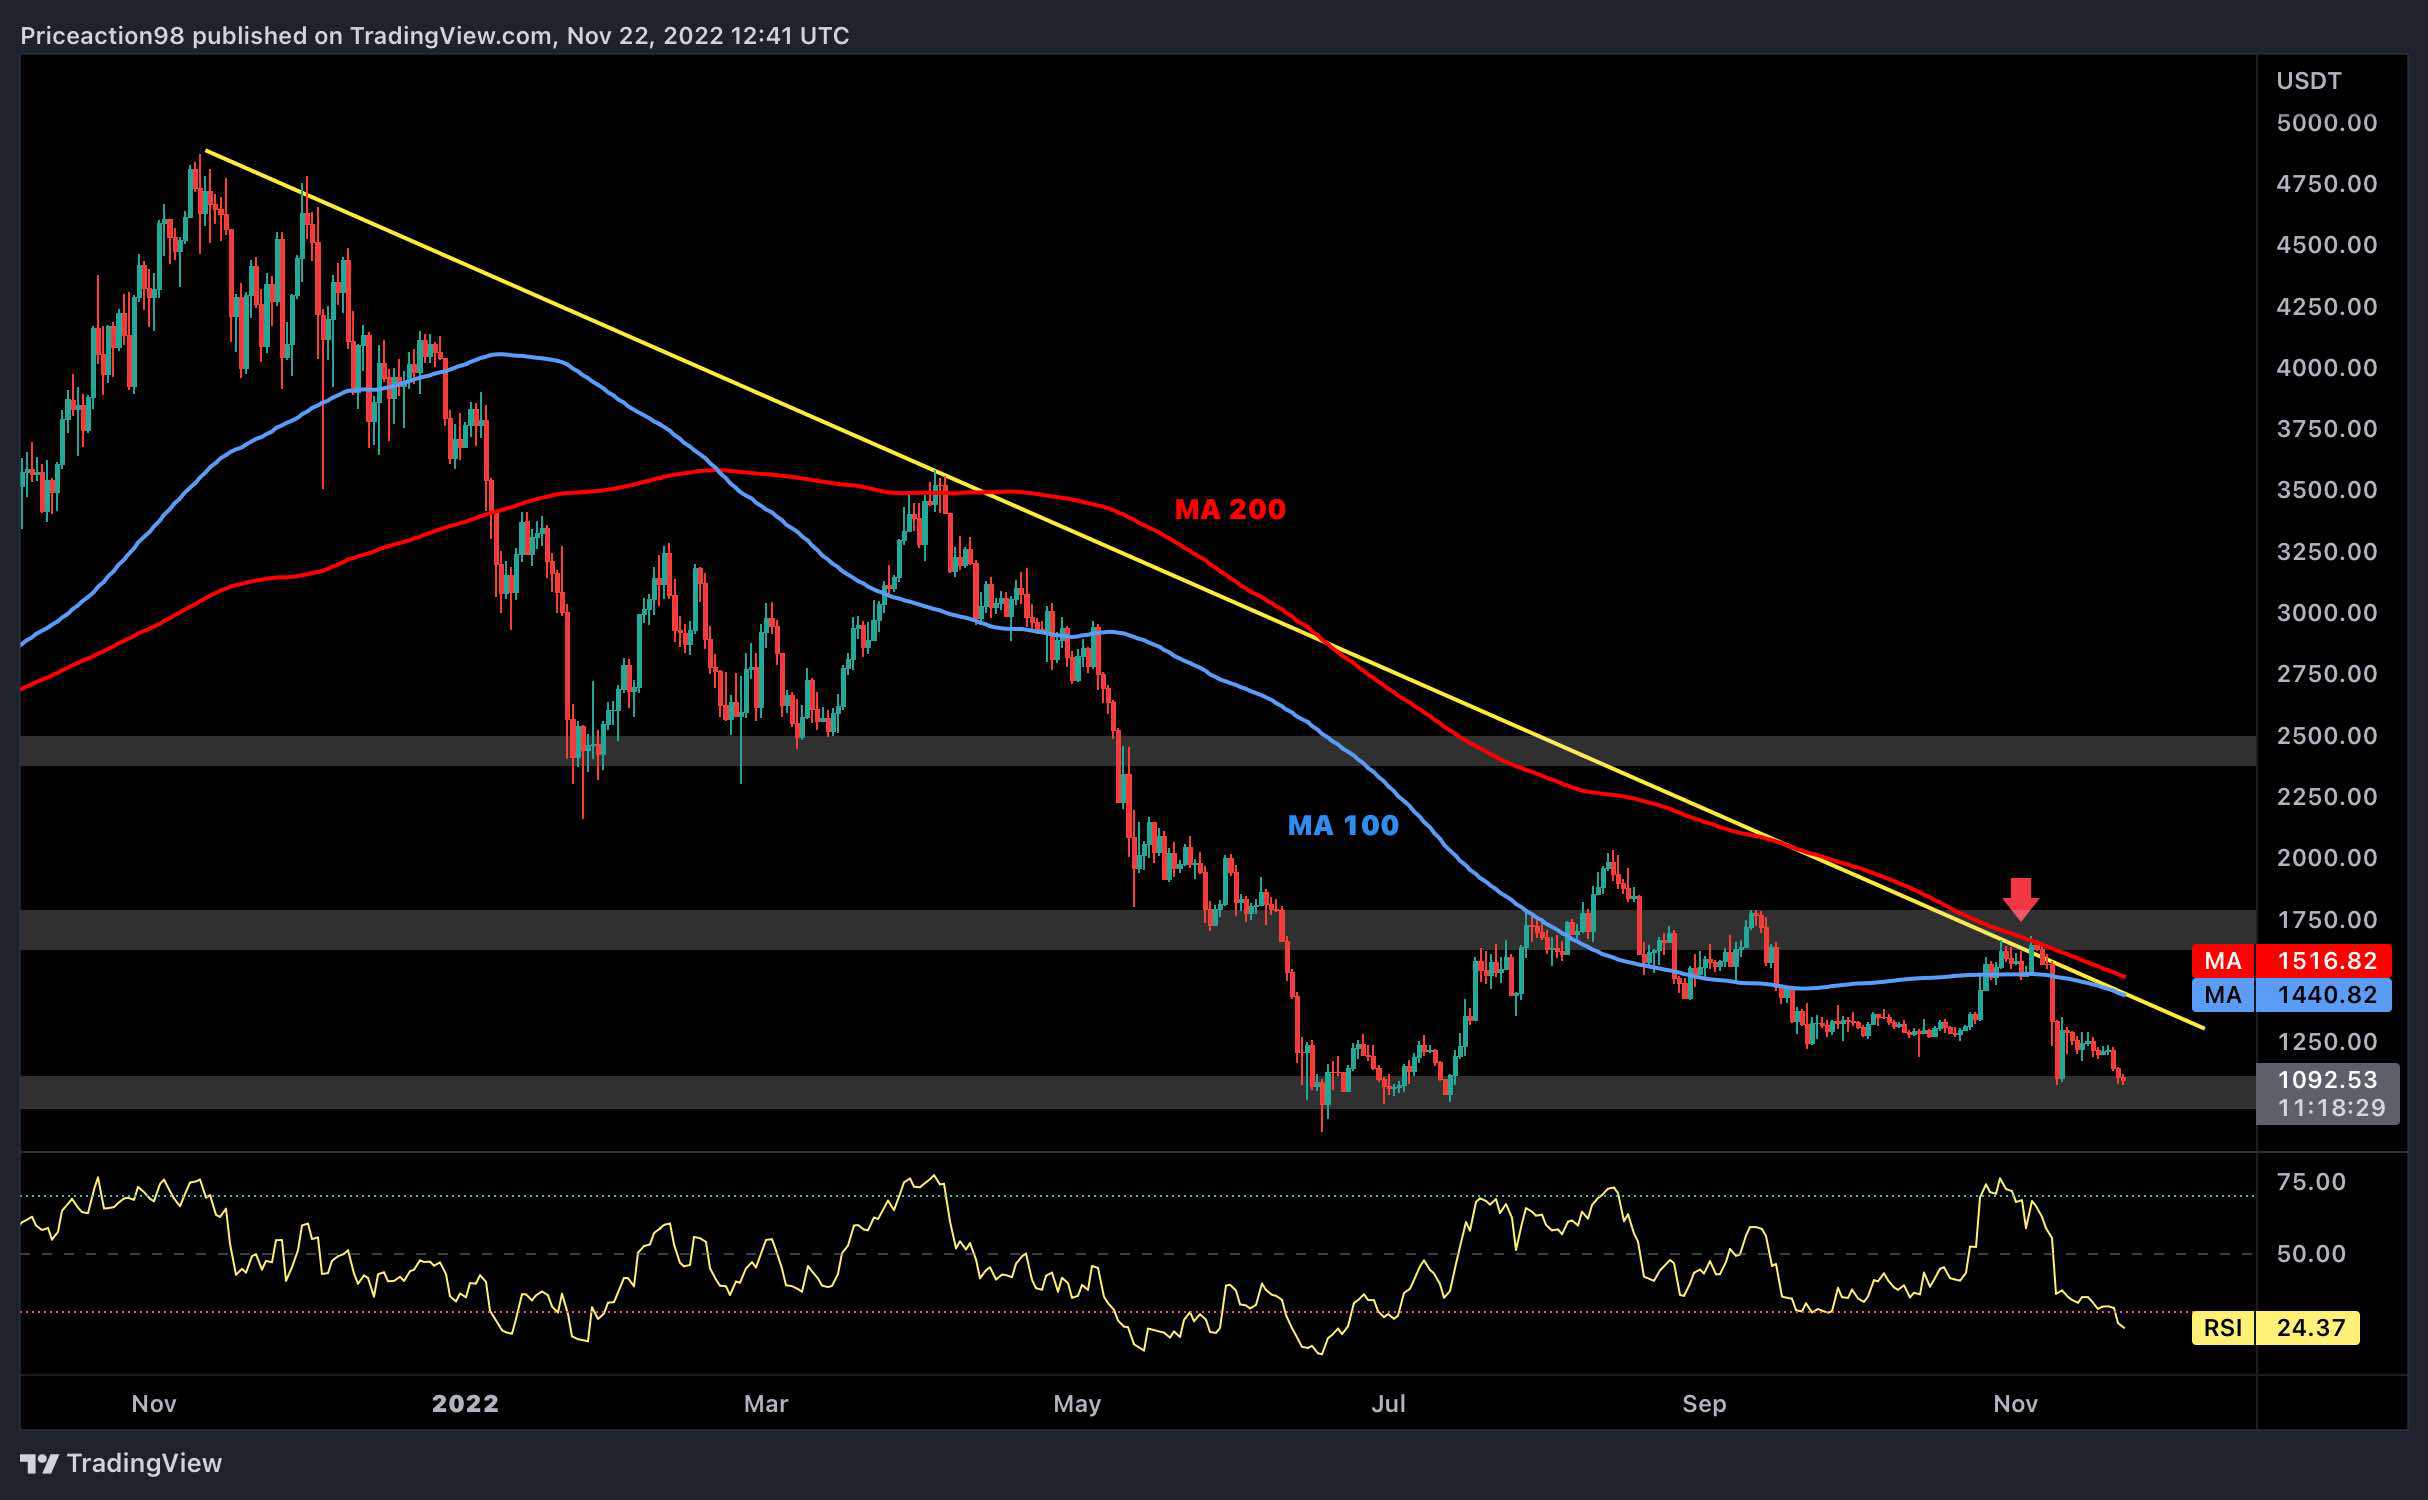
Ethereum’s price has been rejected by the multi-month descending trendline several times. Recently, the cryptocurrency experienced a significant crash after attempting to surpass the trendline and the 200-day moving average, sitting at $1.7K. This is currently the most critical dynamic resistance for ETH.
The cryptocurrency is now facing the most decisive support level at the $1K region and is about to break it to the downside. If the level fails to hold, a cascade toward lower-price regions is anticipated, as ETH will mark a new low during this bearish cycle.
However, in the event of a reversal, the price should spike and retest the 200-day moving average and the descending trendline.
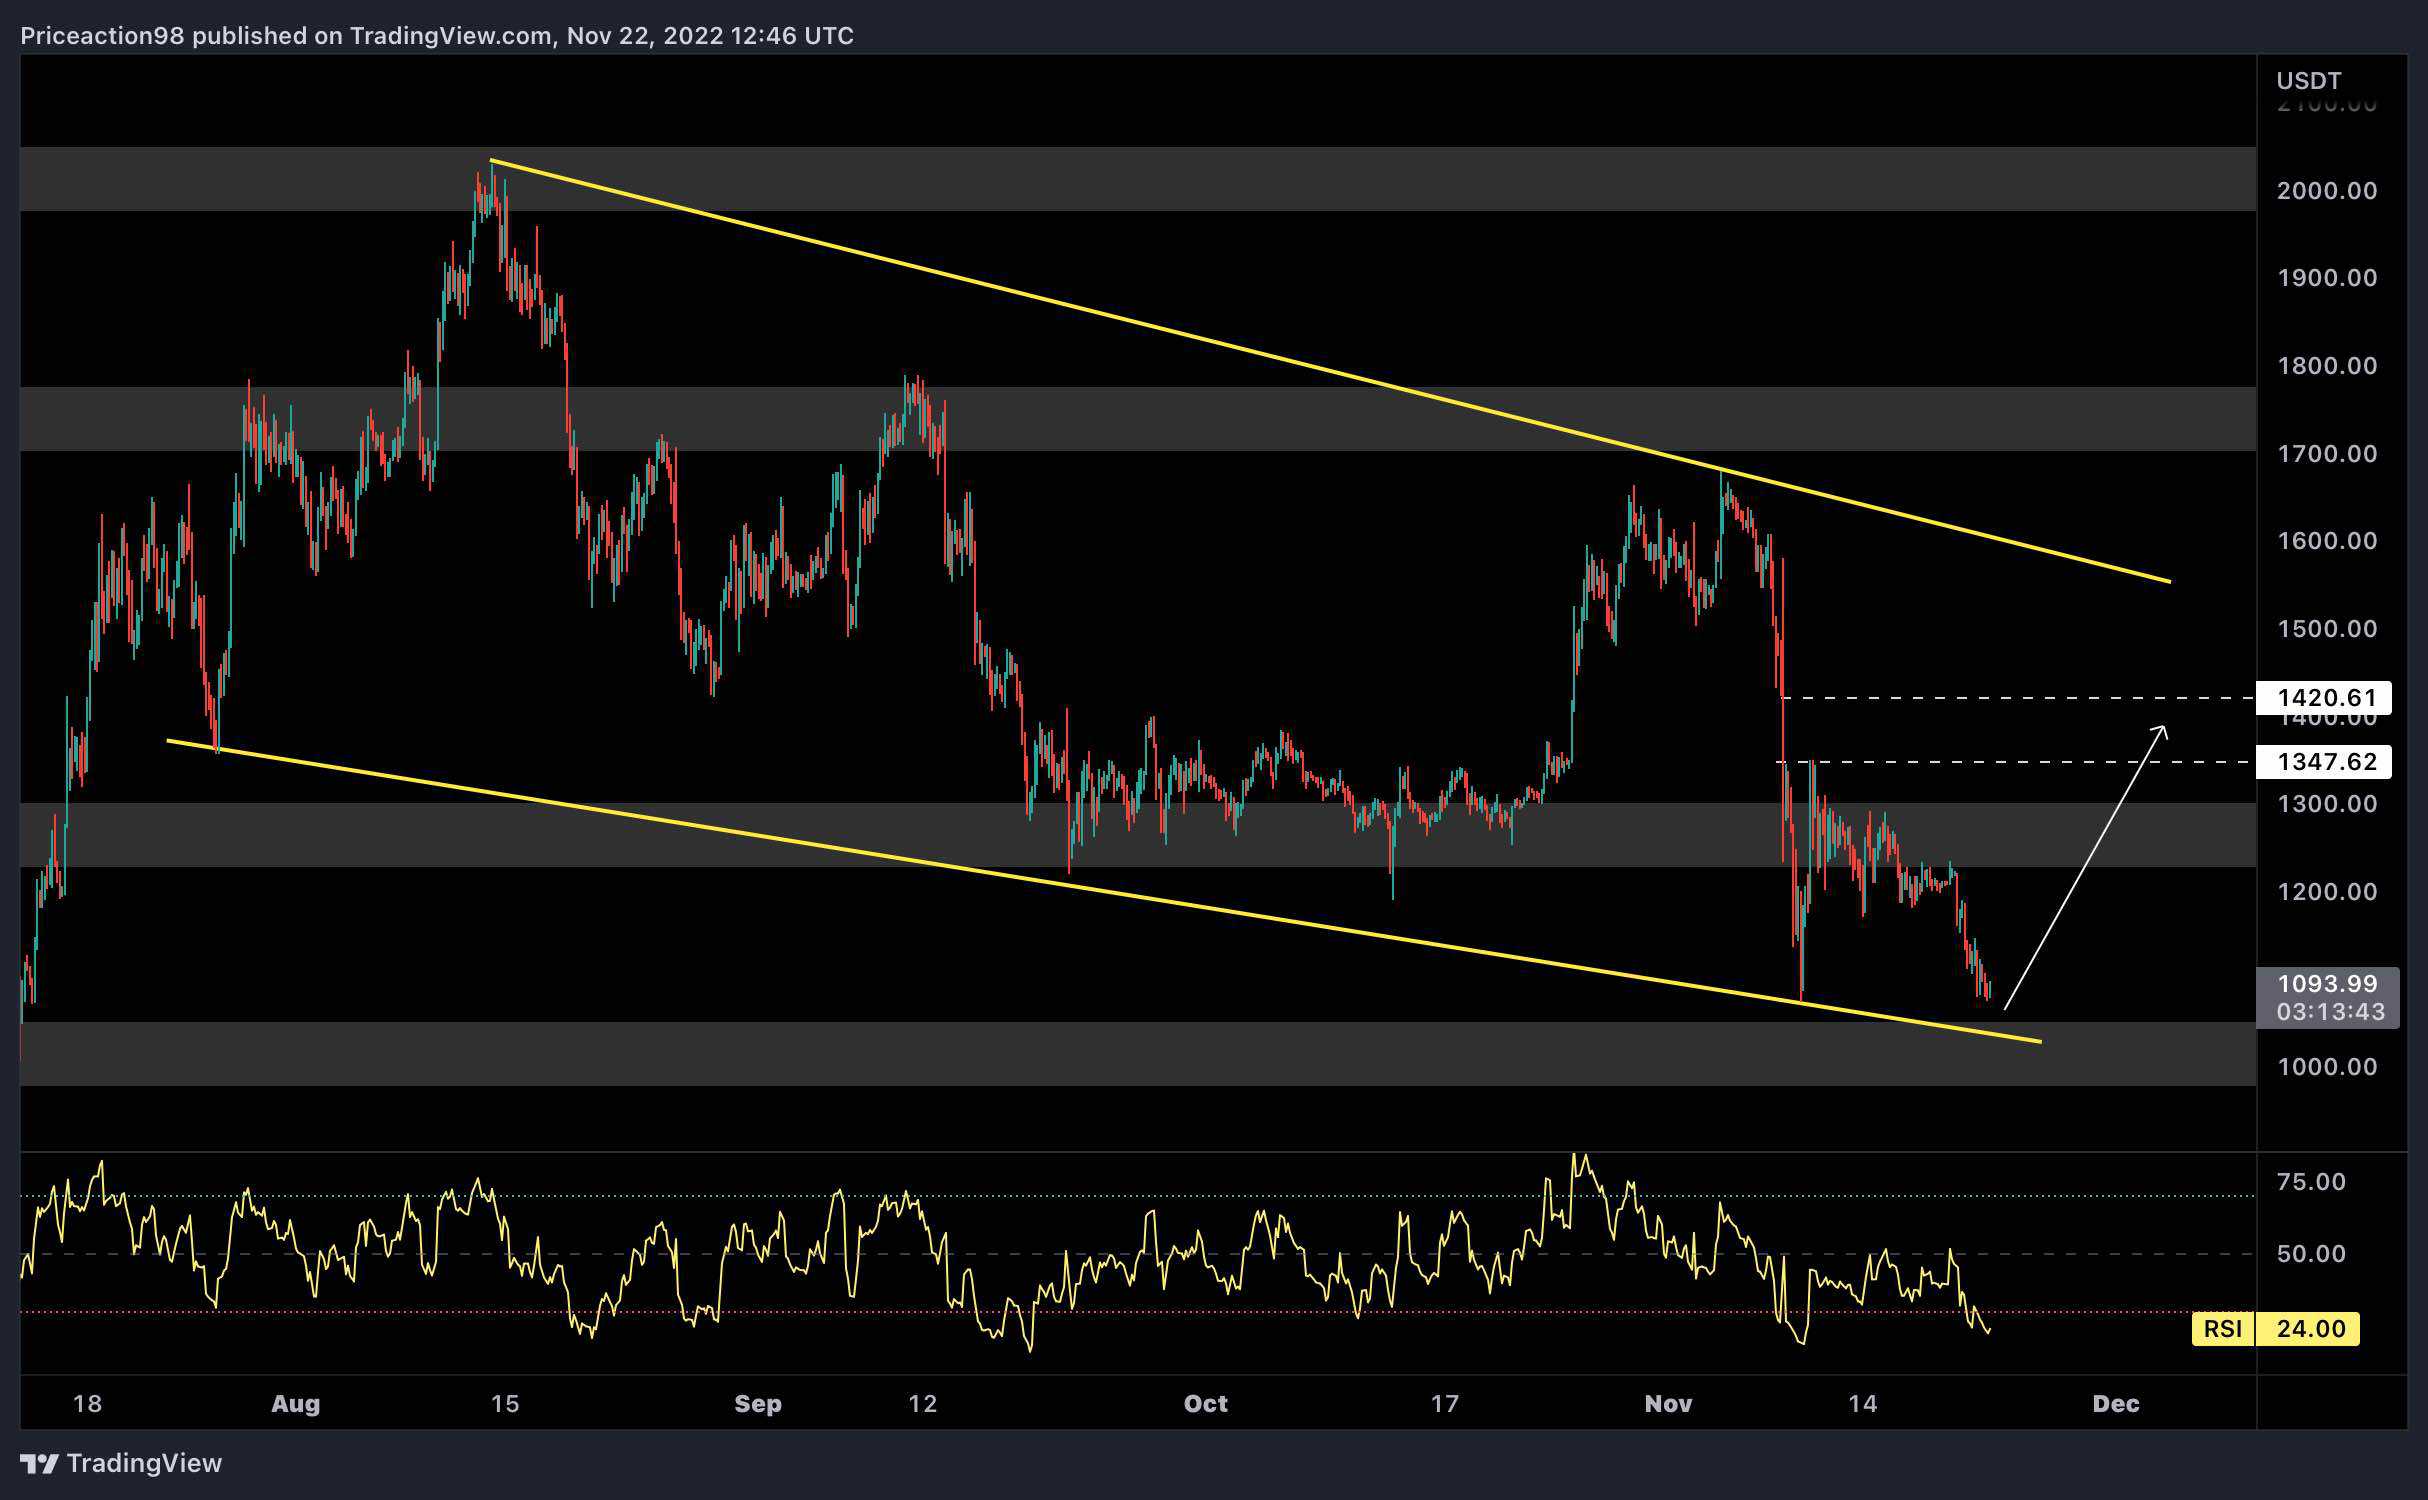
In the 4-hour timeframe, a descending wedge pattern was formed during the past few months, and the price is testing the lower boundary for the third time.
This is known as a bullish continuation consolidation pattern in the classic price action methods. However, an existing imbalance between the $1347 and $1420 price levels should be tested before the next impulsive move.
And yet, according to the overlap of the lower boundary of the wedge, as well as the powerful support level at the $1K region and the untested imbalance, the price seems more likely to undergo a short-term reversal toward the wedge’s upper boundary.
Nevertheless, the upcoming price action should decide Ethereum’s direction for the mid-term.
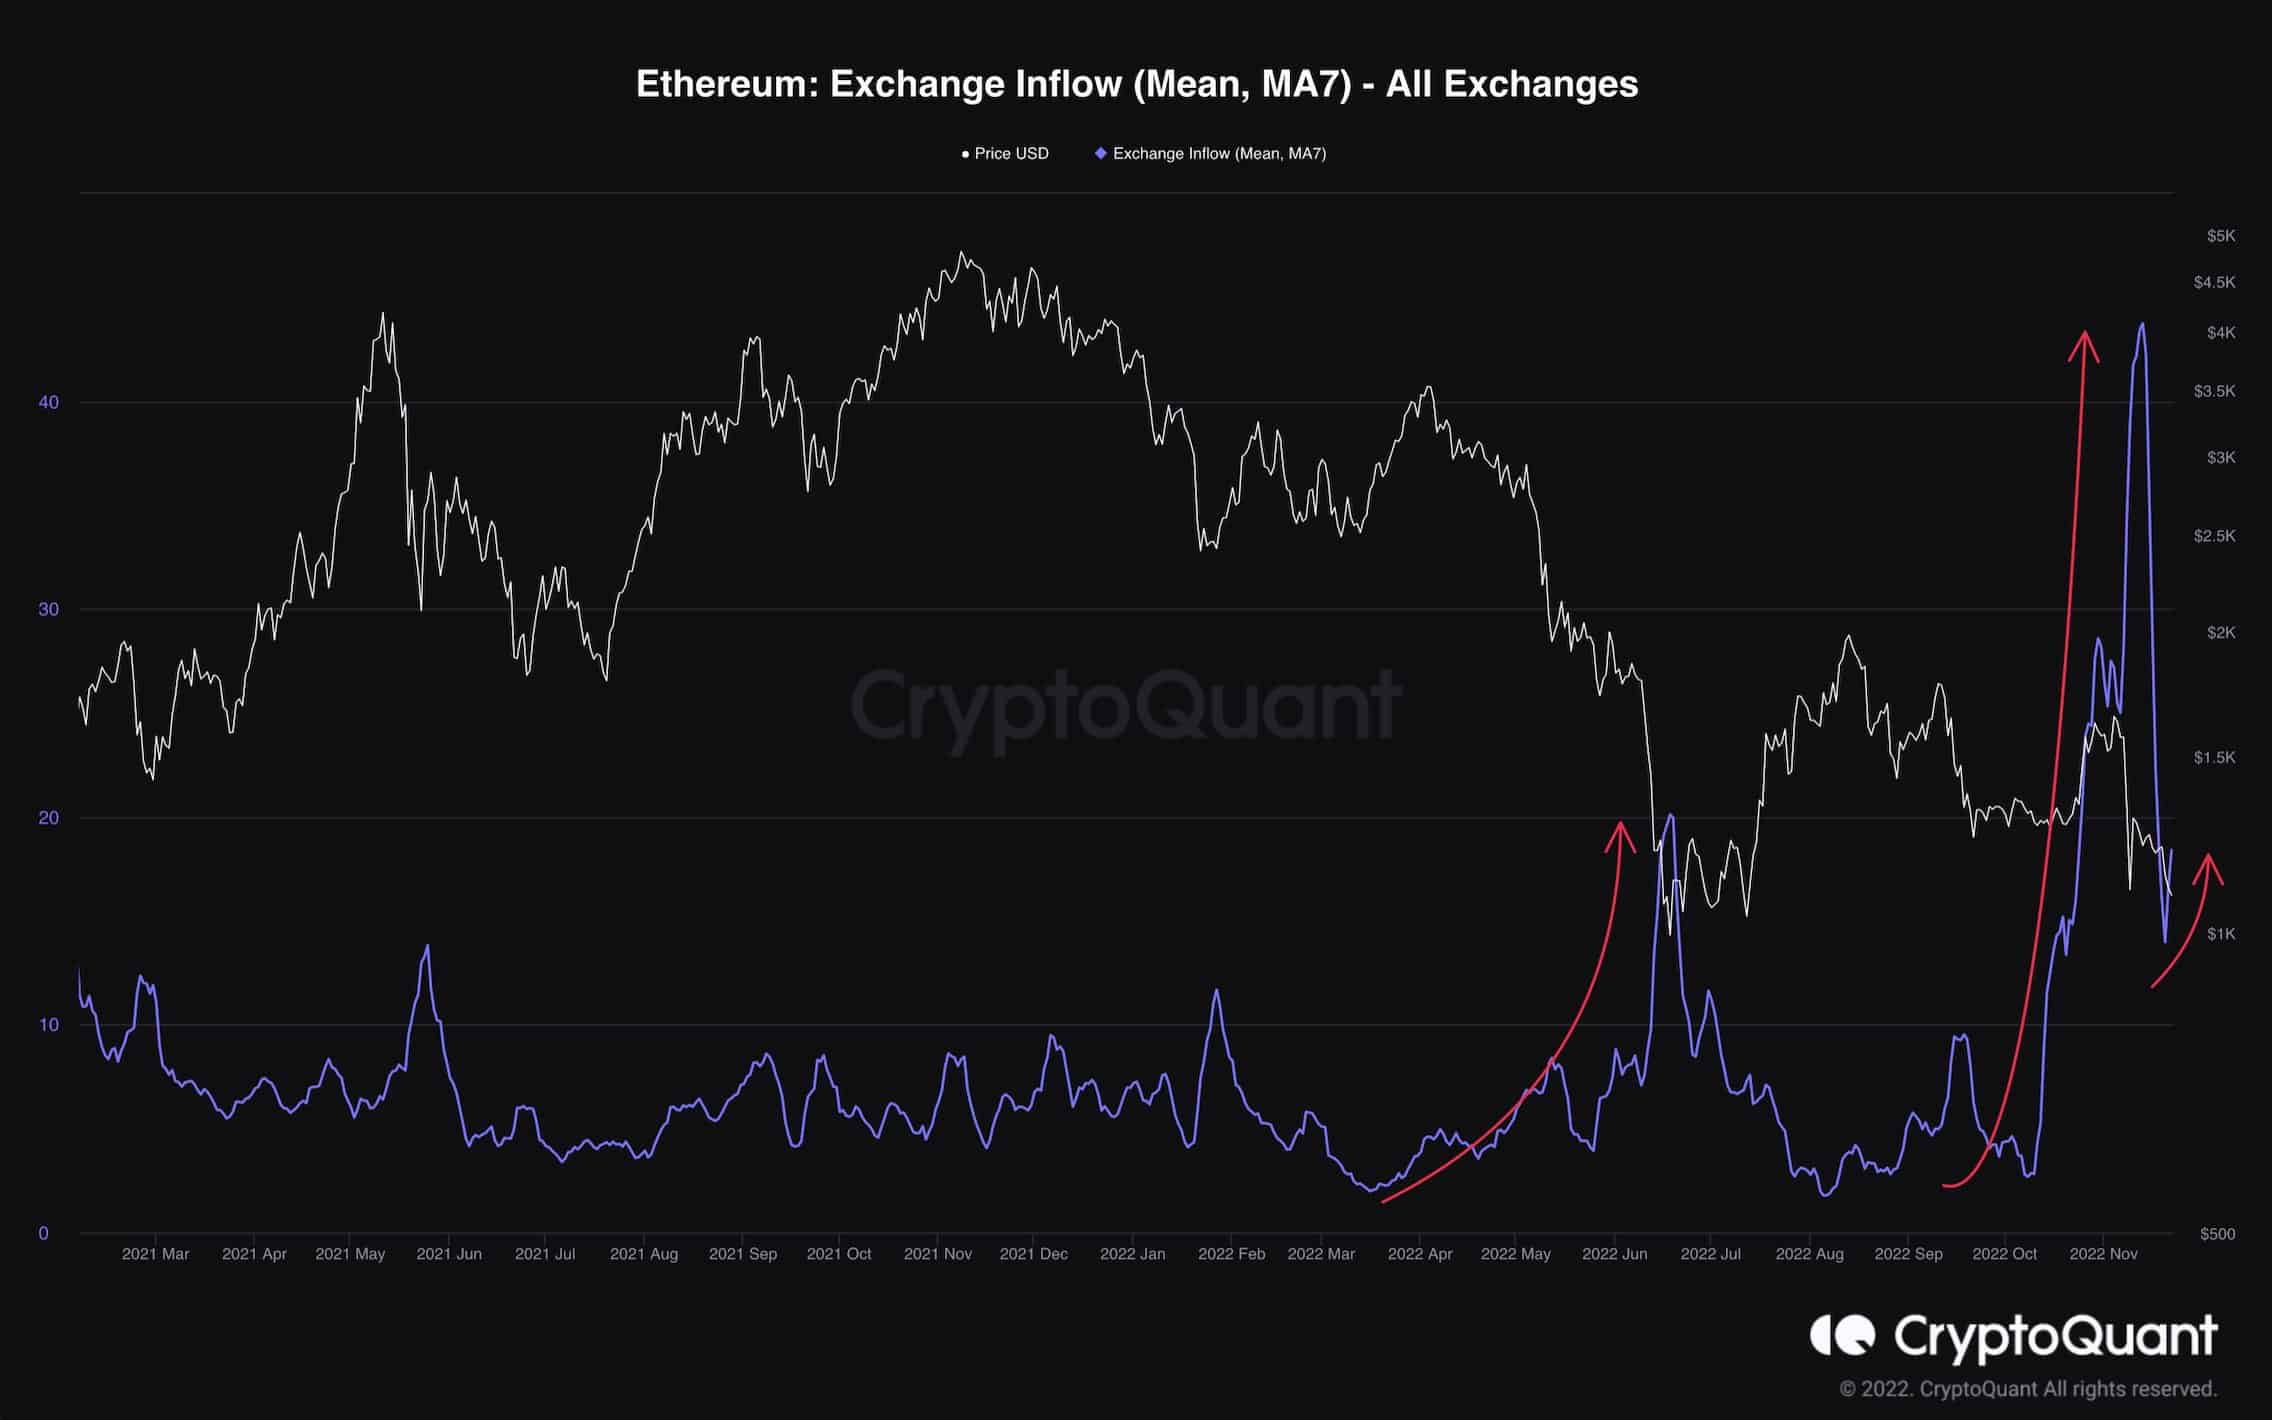
The following chart consists of the 7-day moving average of the Exchange Inflow Mean metric and the Ethereum price. The metric reveals the mean amount of ETH per transaction sent to the exchange.
Higher values indicate investors who deposited a lot at once are increasing, which could result in higher selling pressure and future price drop.
According to the graph, the metric spiked each time the price experienced a significant drop. This indicates possible distribution from big traders.
Most recently, the inflows mean has jumped, marking a new multi-month high, suggesting there is still fear and uncertainty in the market.
The next bull market won’t be initiated unless the current bearish sentiment and panic-selling behavior come to an end.