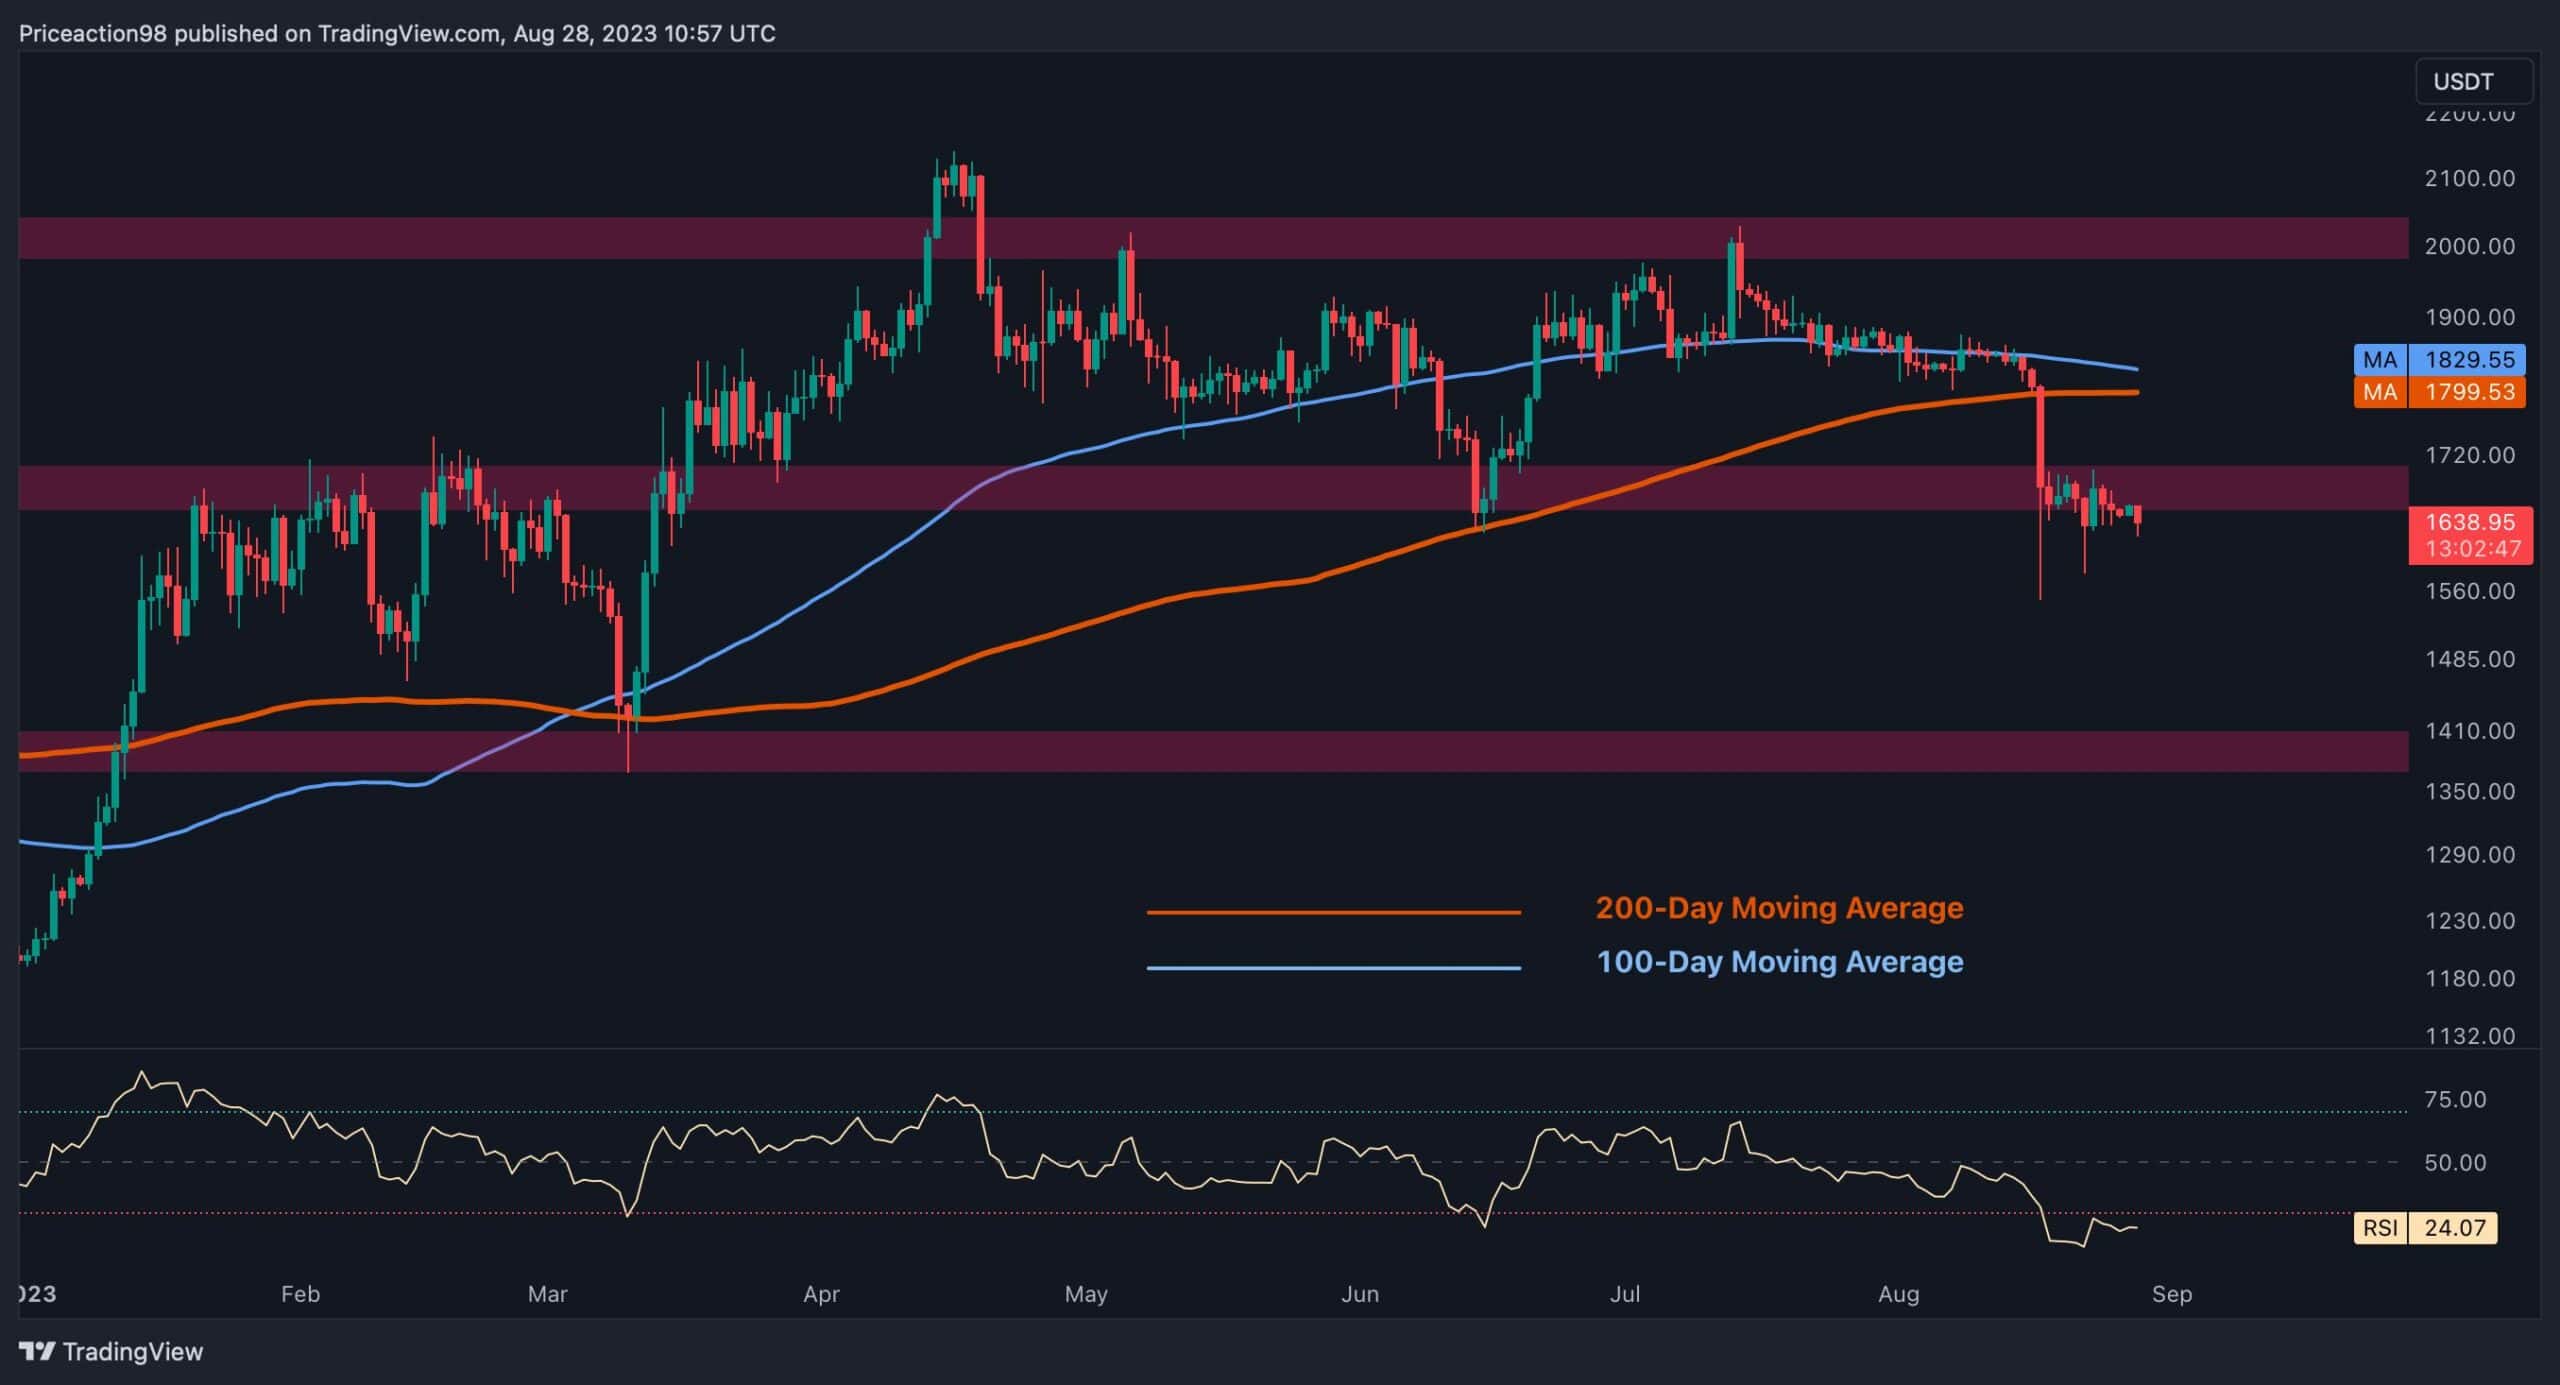
Following an unexpected and rapid drop from the $1.8K threshold, Ethereum’s price experienced a significant dip, falling below the critical 100-day and 200-day moving averages (MAs).
This development is considered a significant bearish sign for ETH. However, the price managed to find support within a crucial range, hinting at the possibility of an imminent consolidation phase.
By Shayan
A close examination of the daily chart reveals that the price’s breach beneath the 100-day and 200-day moving averages, around $1,835 and $1,800 correspondingly, caused a marked downtrend that eventually landed Ethereum’s value within the pivotal support zone at $1.6K.
It’s important to note that the 200-day moving average holds substantial significance as an indicator of prevailing market trends. Traditionally, a bearish sentiment engulfs the market when the price remains below this MA.
Currently, the $1.6K support level has proven its resilience in upholding the price, indicating the potential for a recovery and subsequent pullback. However, the recent downtrend has shifted the market’s structure into a more bearish stance, thus enhancing the possibility of a retest of the $1,400 zone in the upcoming weeks.
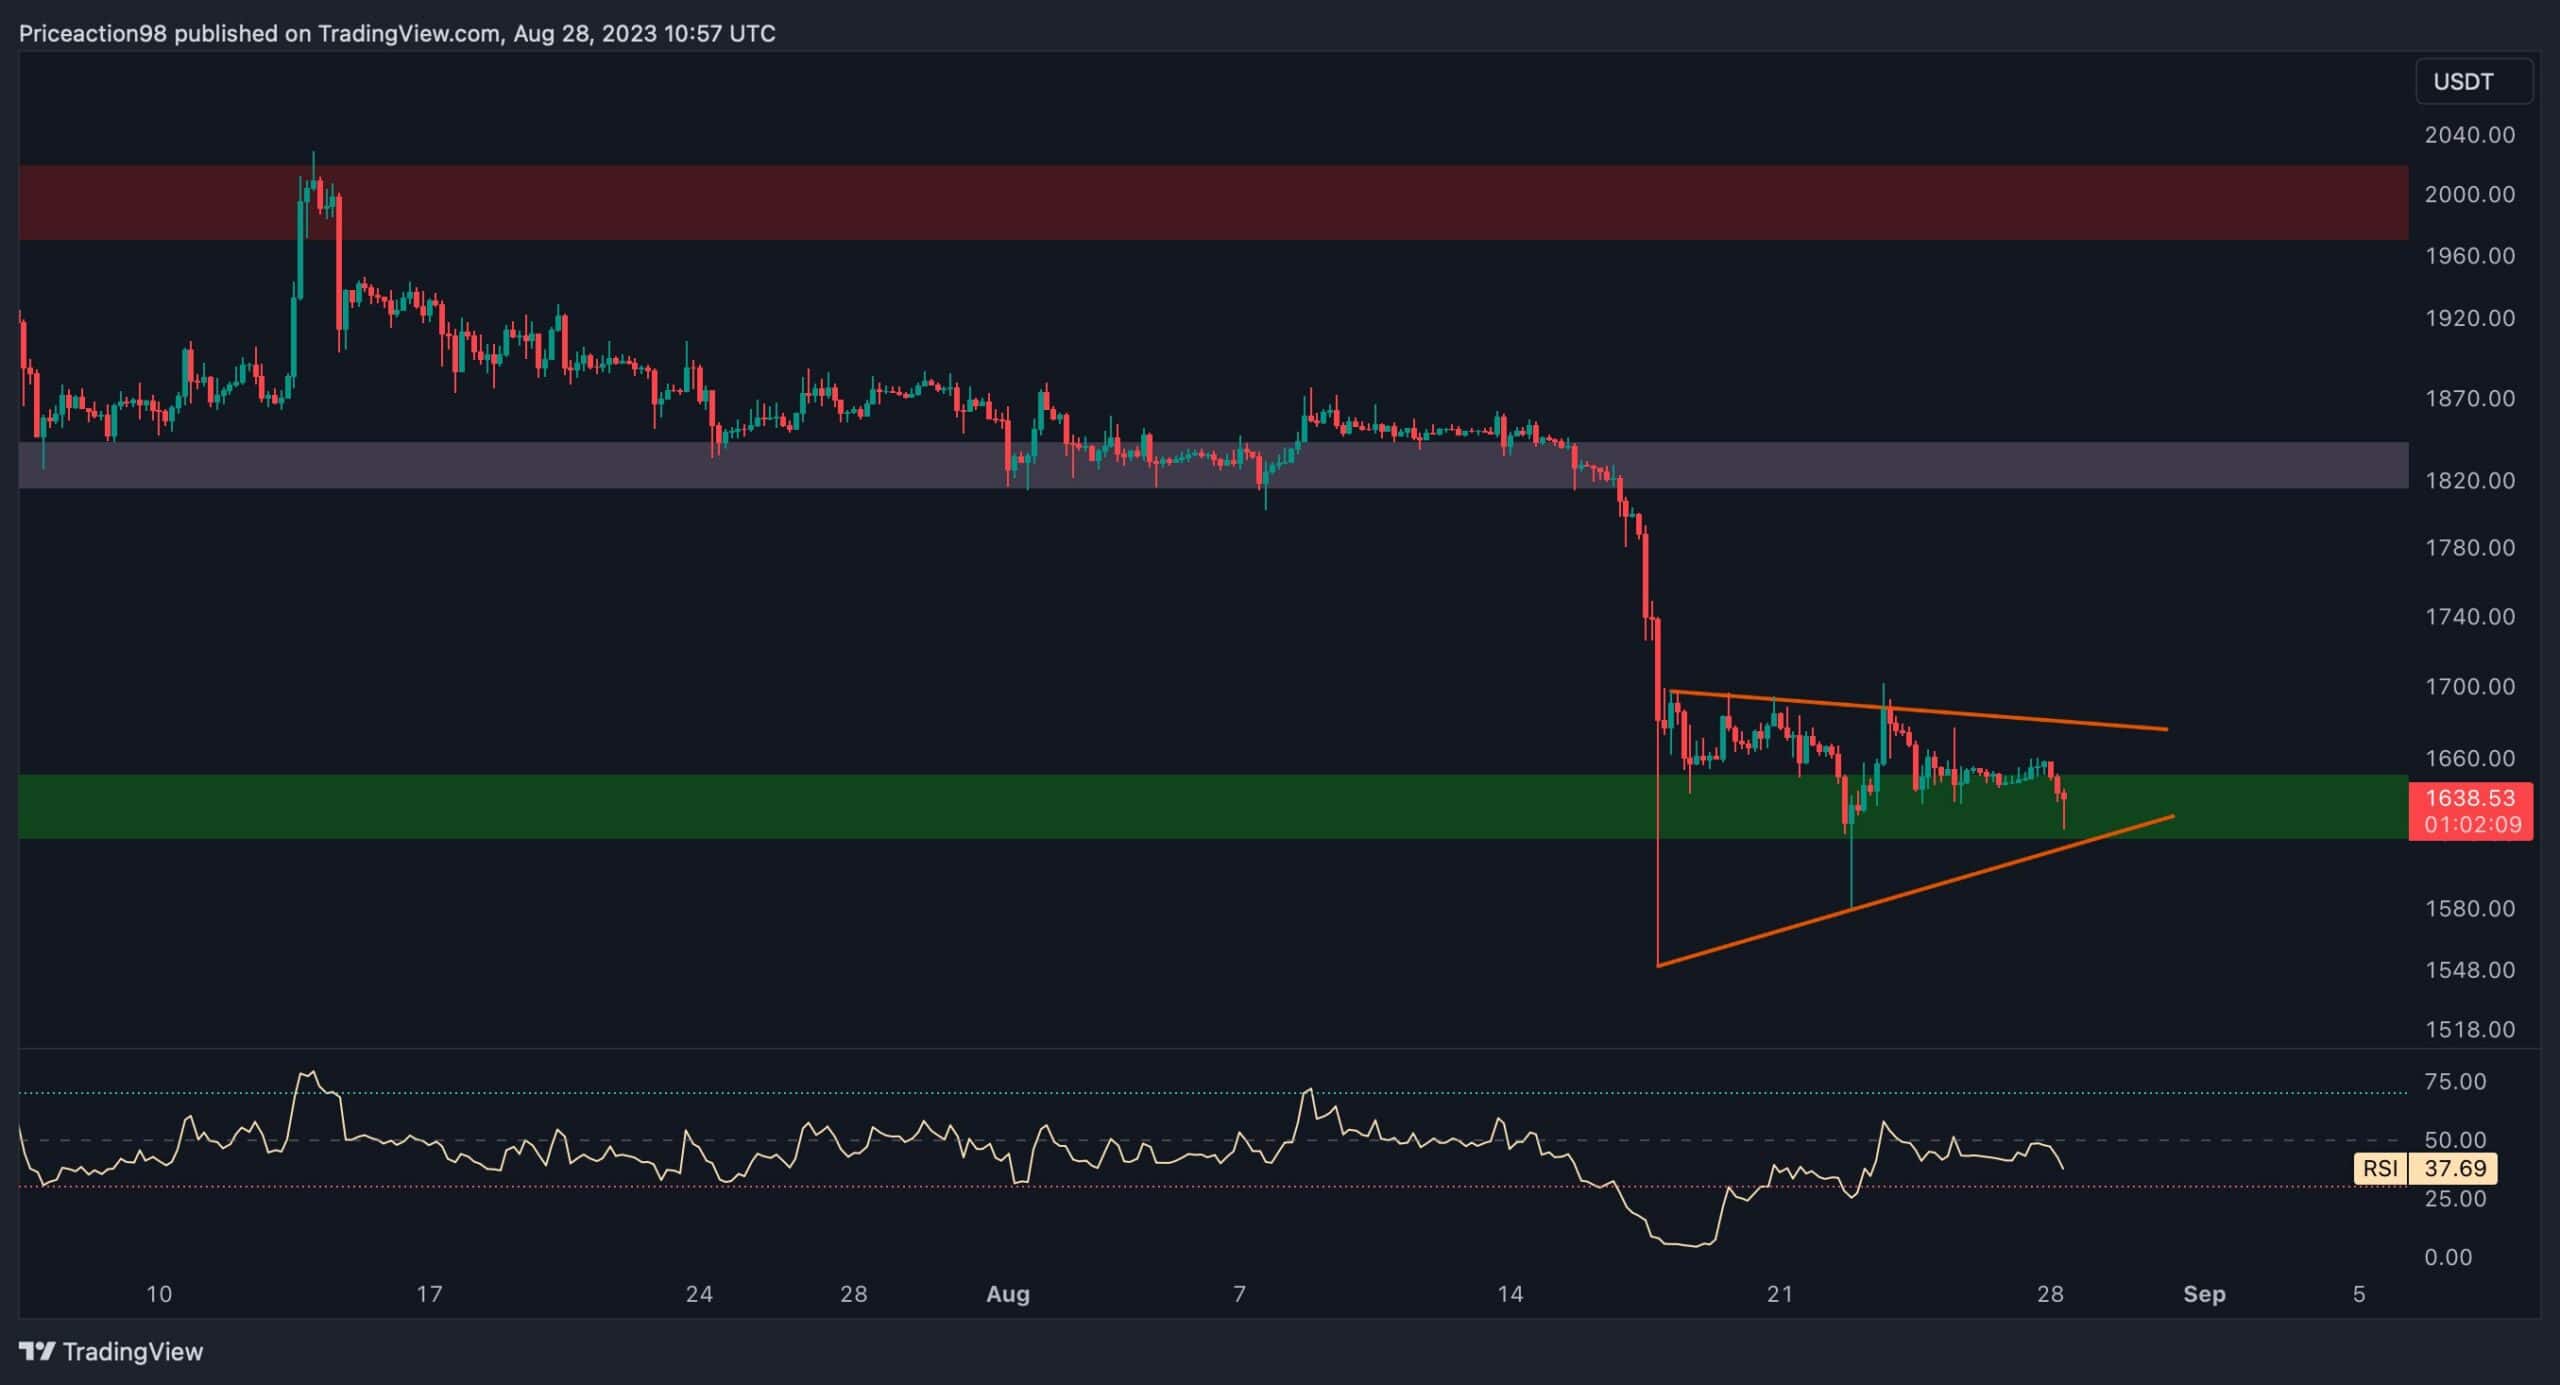
Turning attention to the 4-hour timeframe, it becomes evident that ETH lost the critical support point of $1.8K. This quick decline led the price to find support within the range of $1.5K, resulting in a temporary end of the prevailing downtrend.
Remarkably, this support level has so far demonstrated its efficacy in maintaining the price, resulting in a period of sideways consolidation. As a consequence of this consolidation phase, Ethereum’s price movement has taken on the form of a roughly symmetrical triangle pattern. This technical pattern can develop into bullish and bearish signals depending on the direction in which the pattern’s breakout occurs.
By Shayan
Ethereum’s price trajectory currently remains in a state of uncertainty, displaying no clear inclination towards an upward or downward movement. Consequently, as the price chart offers limited insights into forthcoming market trends, delving into the futures market sentiment might provide valuable insights into Ethereum’s current state.
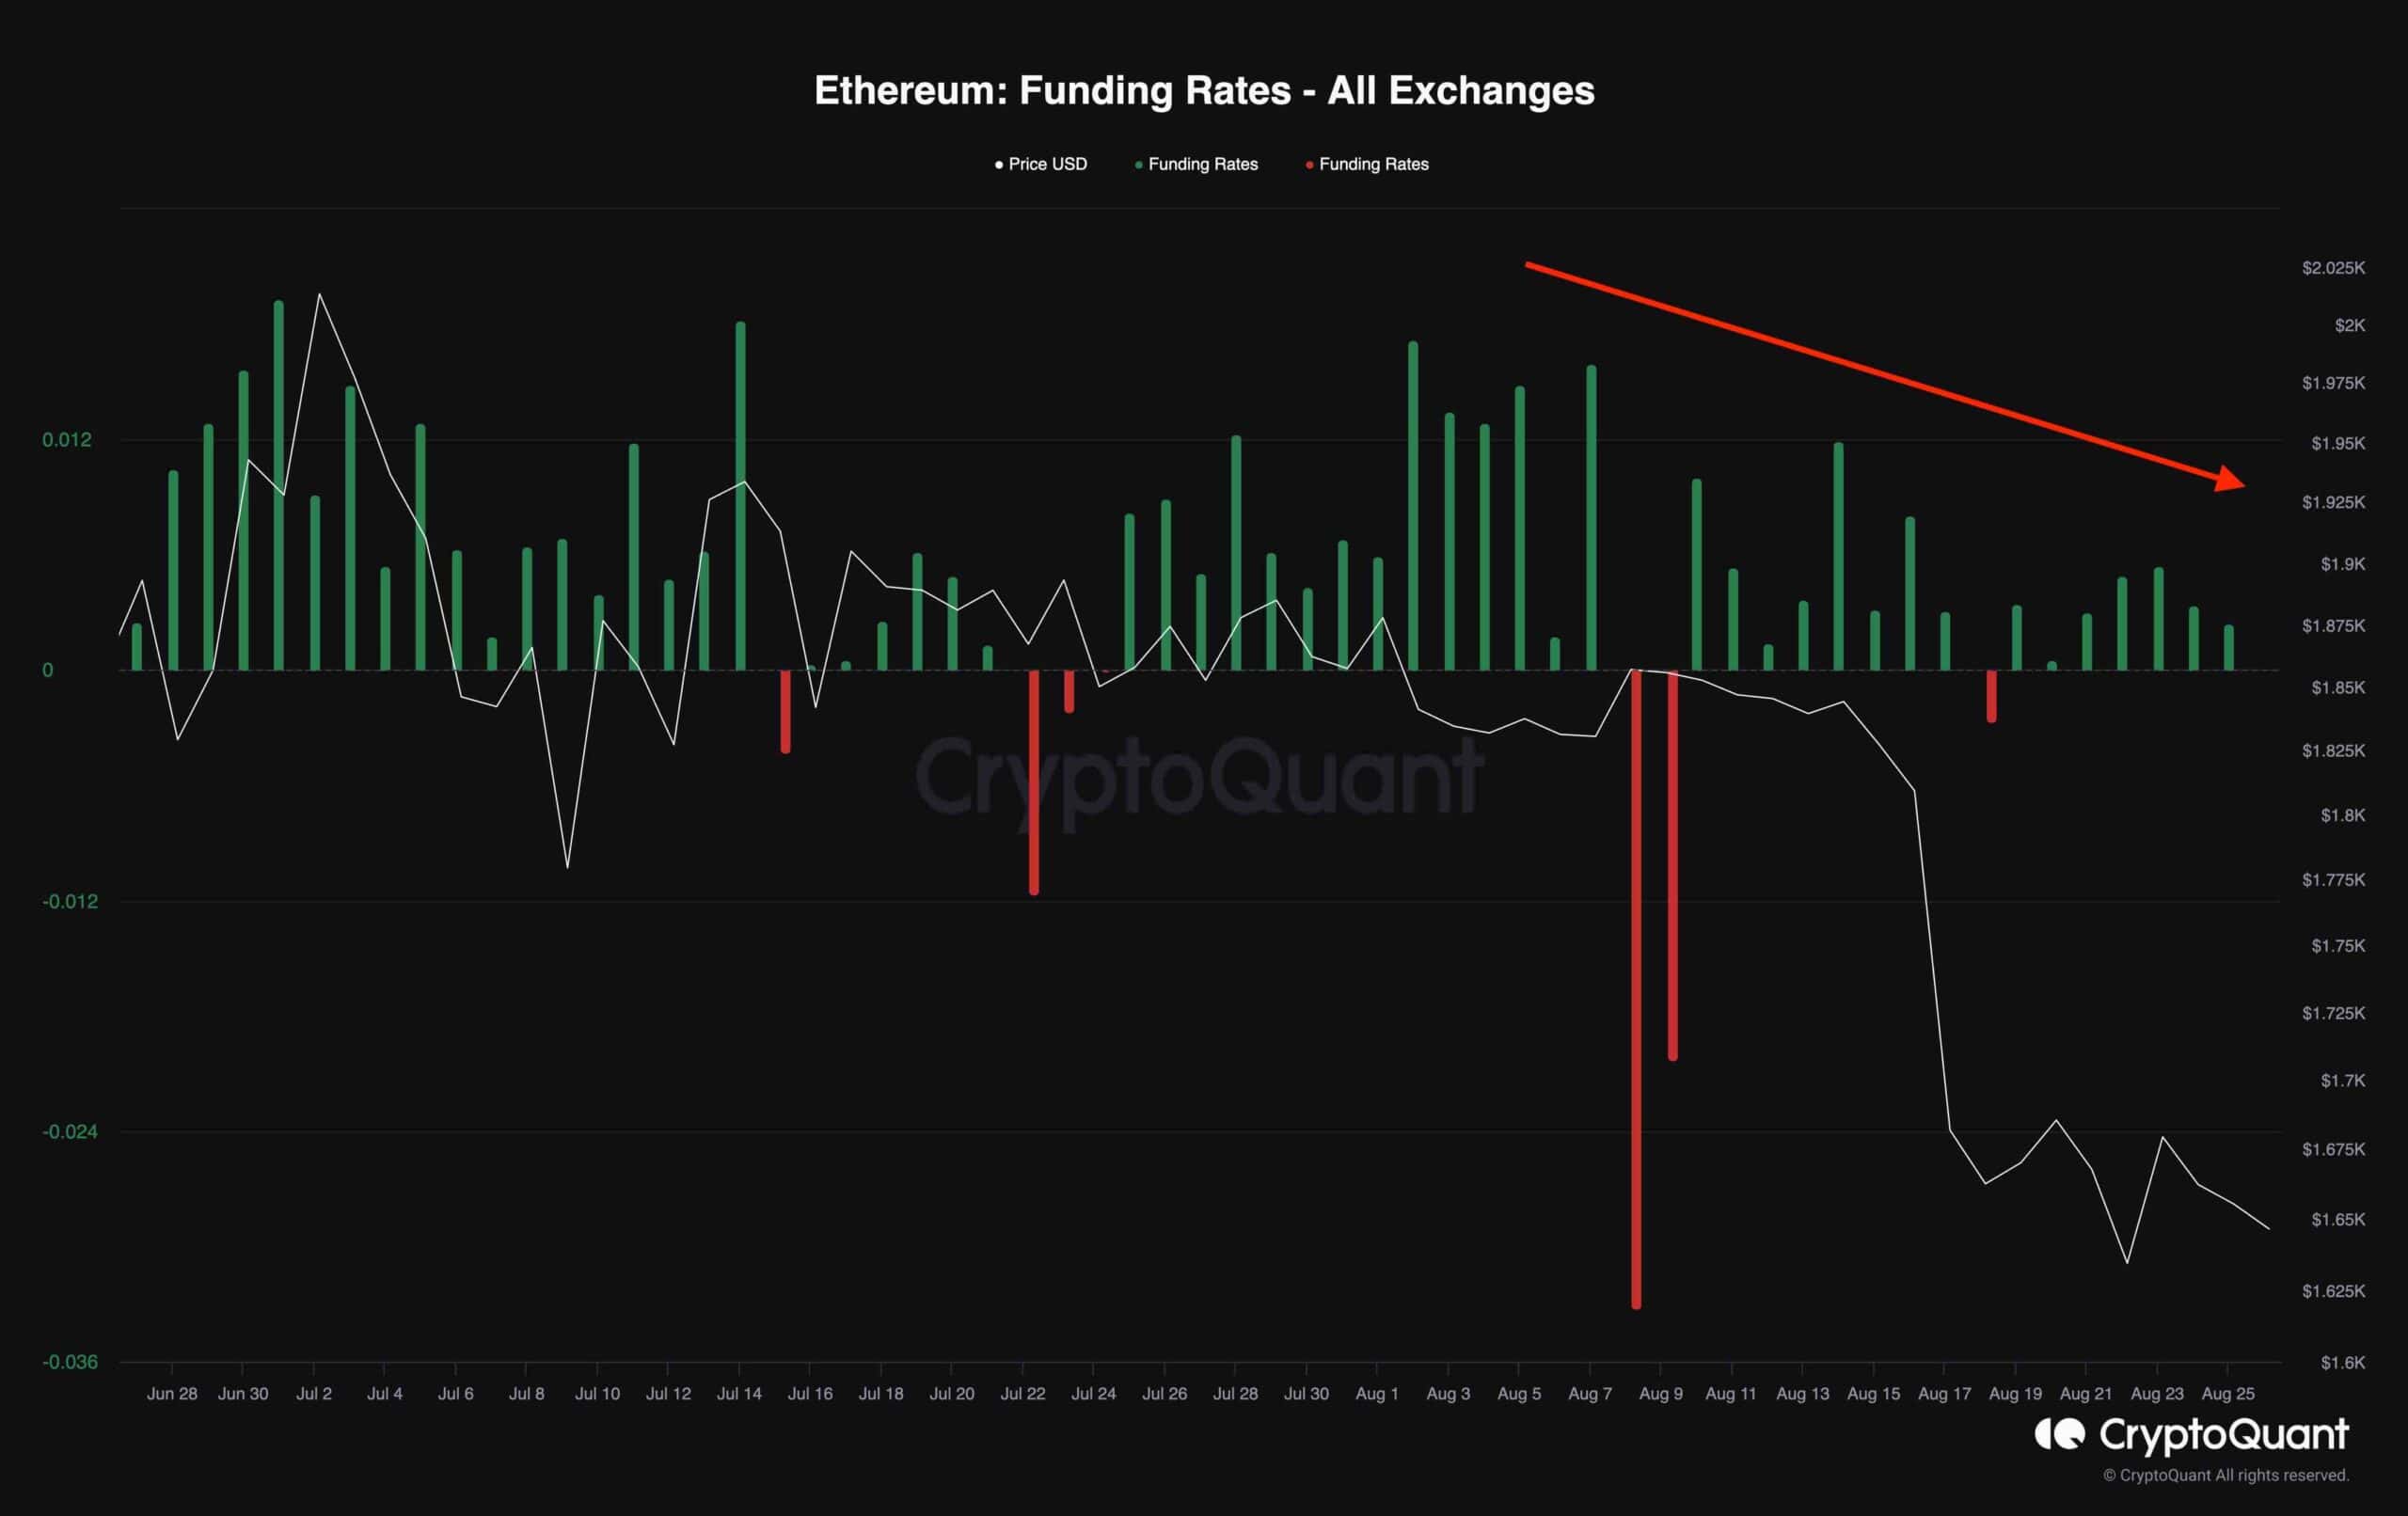
The following chart illustrates Ethereum’s funding rates, a pivotal point for identifying the dominance between long traders and short sellers. Positive values align with a bullish outlook, while negative values signify a bearish stance.
Notably, an apparent pattern emerges from the data. Following a sudden impulsive decline, succeeded by a consolidation phase with stagnant price action, the funding rates undertook a downward trend, forming lower peaks on the chart. This unfolding scenario hints at a lack of interest in going long in the futures market, potentially paving the way for a bearish trajectory.
Nonetheless, despite the prevailing bearish sentiment, there remains the possibility of a minor corrective phase preceding a more pronounced downward trend. Should the funding rates assume a negative stance, this could elevate the likelihood of a cascade of short liquidations, potentially leading to a substantial bullish rebound that propels the price upwards.