The bears returned to the market. The past week’s short-term uptrend is going to an end as buyers failed to maintain control over the market. Although the indicators are in the oversold zone, there is no sign of a reversal.
By Grizzly
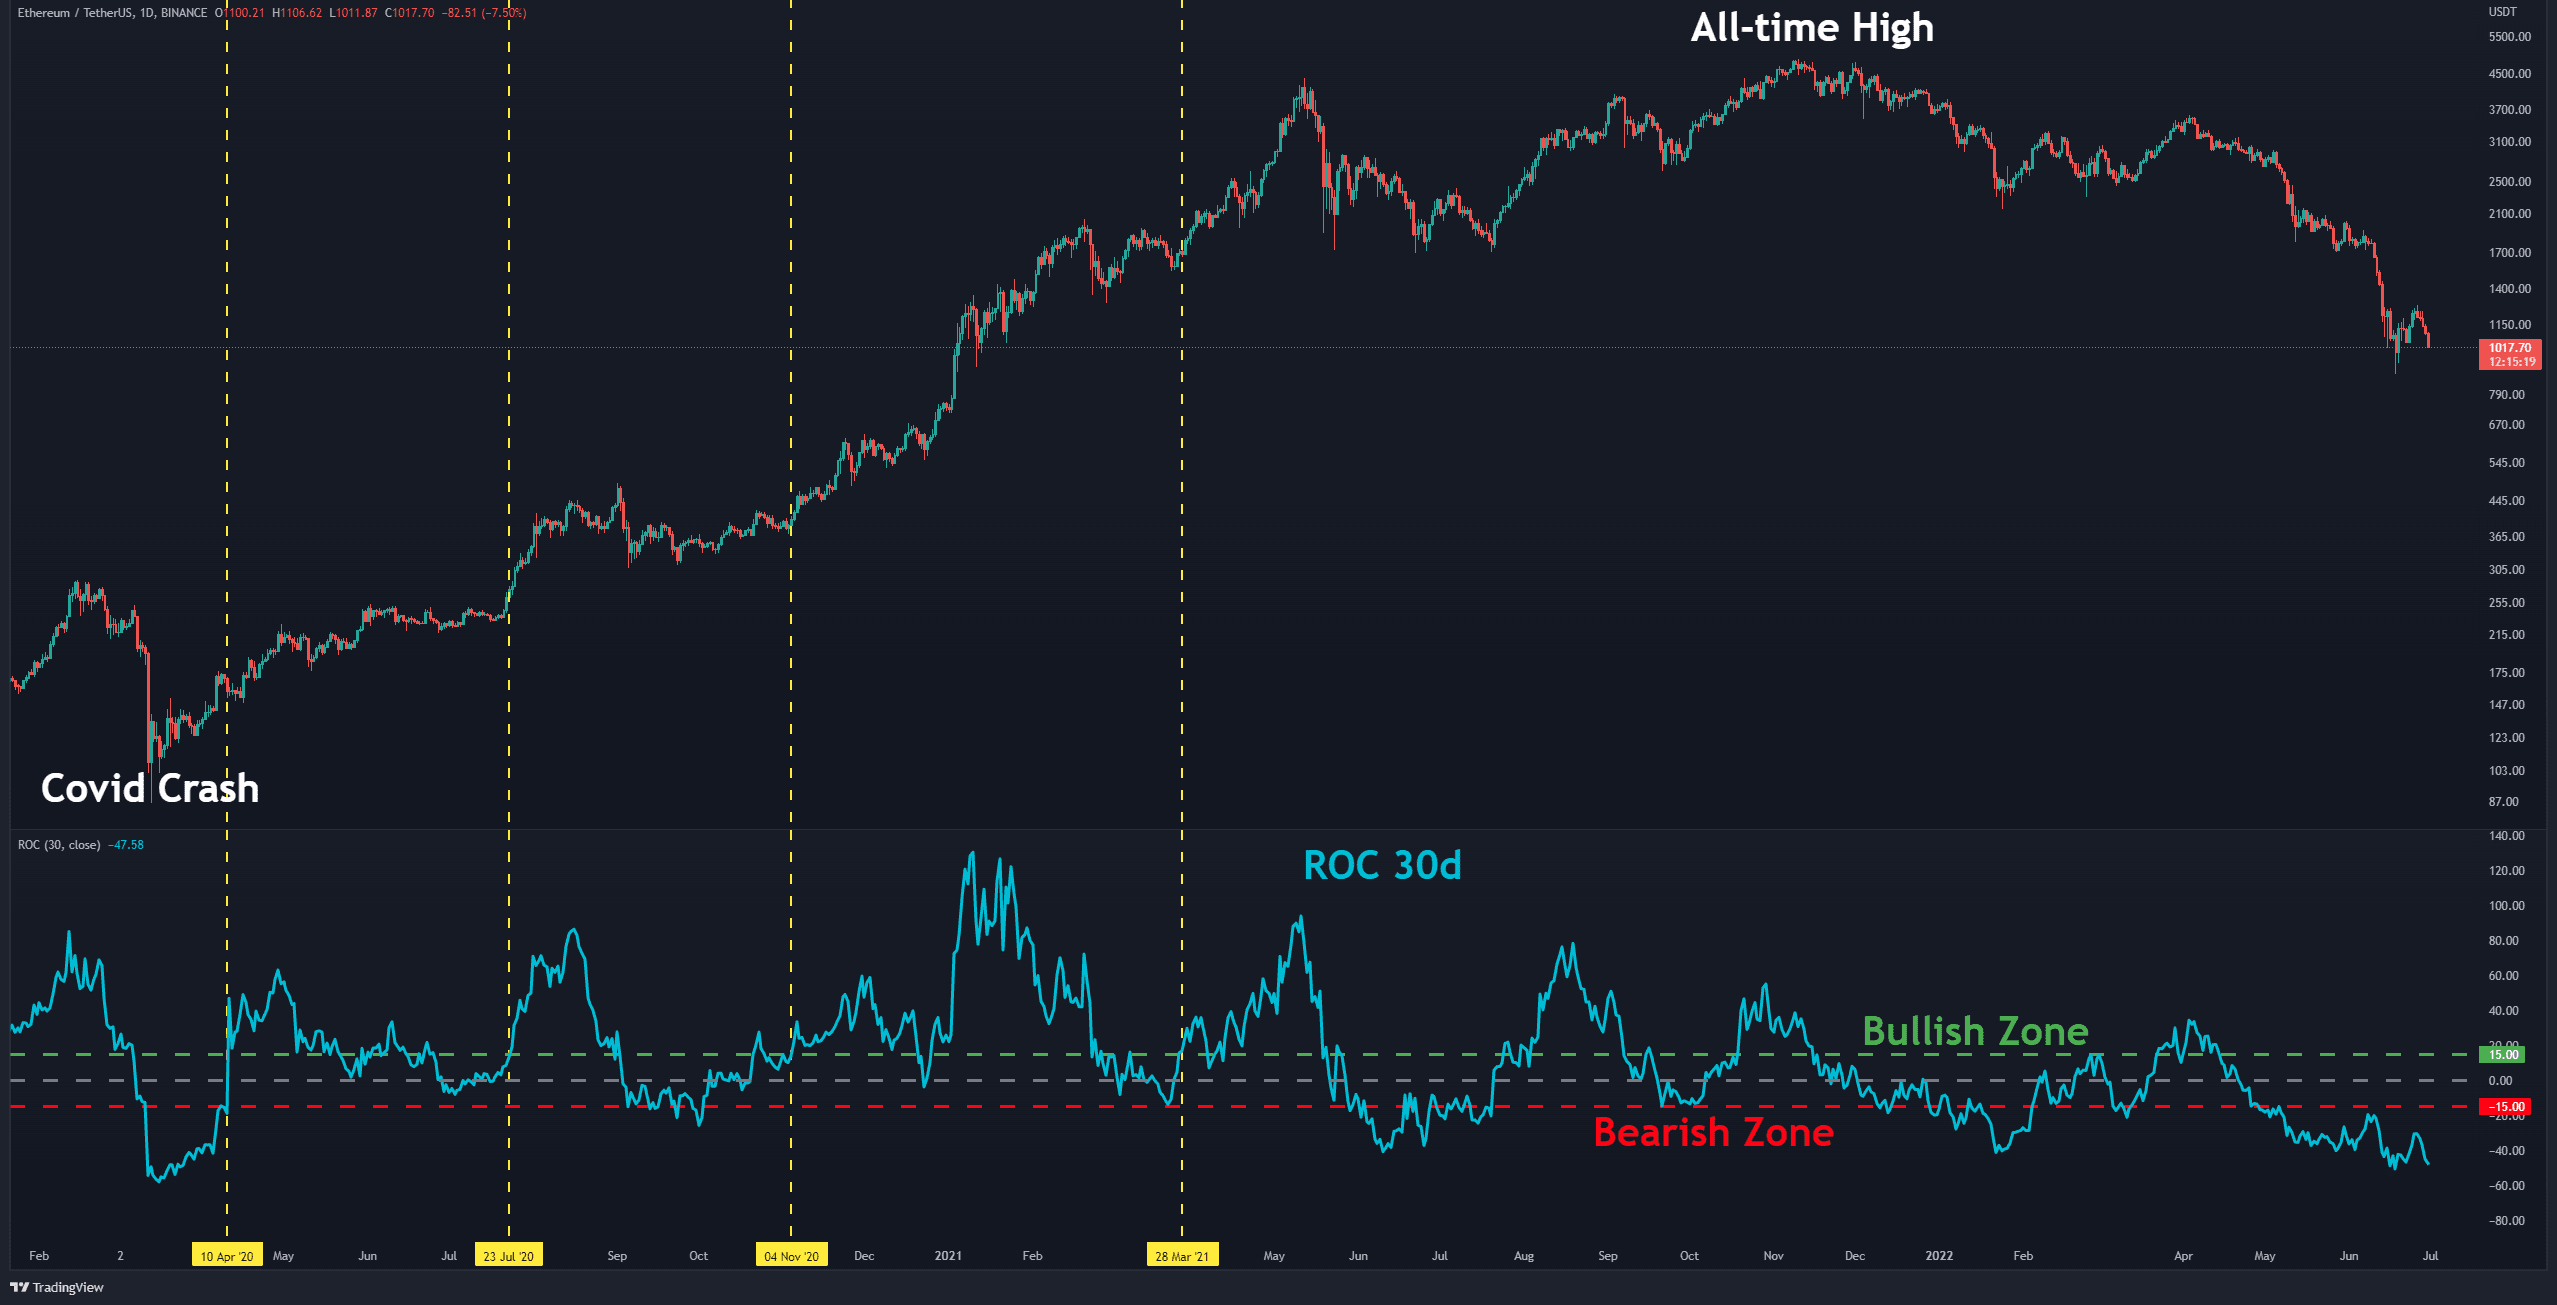
Looking at the ROC 30D indicator in conjunction with the baseline (zero), there are two horizontal lines visible on the daily chart:
Looking at previous uptrends, it is clear that a bullish trend starts when the indicator enters into the bullish zone (or above the yellow dot lines). The downtrend has also intensified and lengthened as the indicator gained momentum in the bearish zone.
At the moment, there are no signs that signal the downtrend to be over and the indicator has reached its lowest level after the Covid crash.
To determine a reversal or at least attempts of reversal, the indicator should gradually move up and break the red and white lines.
Key Support Levels: $900 & $700
Key Resistance Levels: $1300 & $1500
Moving Averages:
MA20: $1173
MA50: $1611
MA100: $2311
MA200: $2703
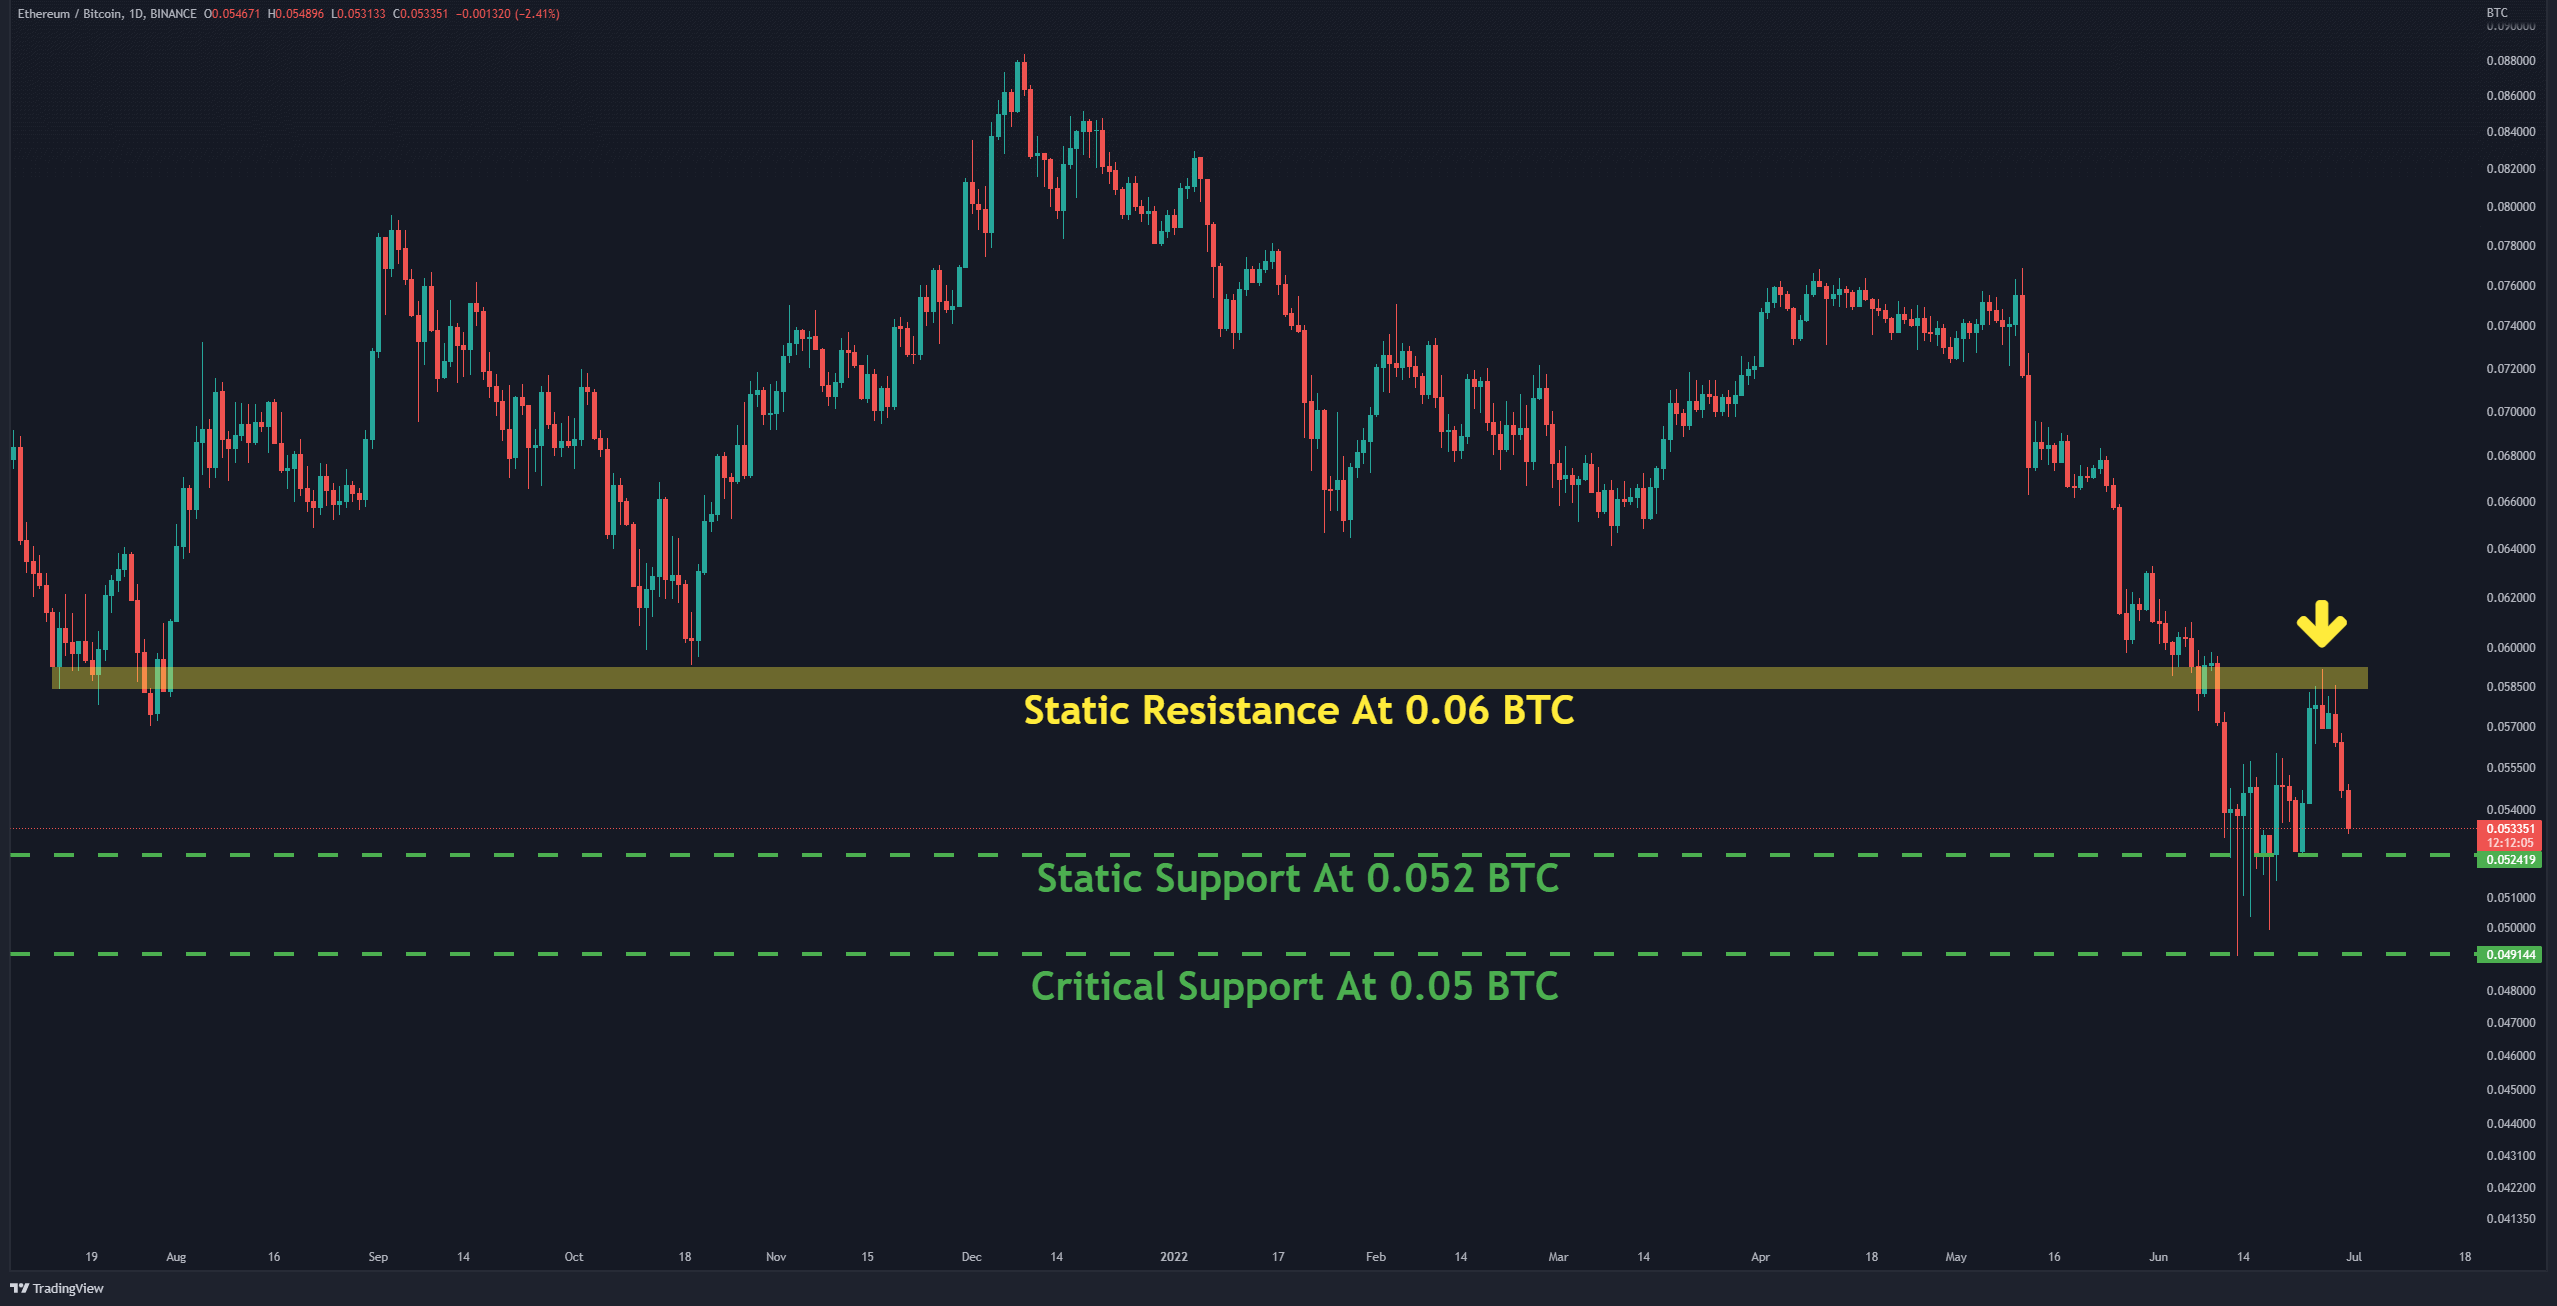
There are no positive signs against BTC either. The bears defended the horizontal resistance at 0.06 BTC well (in yellow) and pushed the price down. Although ETH performed better against BTC relative to USD last week, buyers still could not establish control.
Key Support Levels: 0.050 BTC & 0.0.045 BTC
Key Resistance Levels: 0.06 BTC & 0.065 BTC
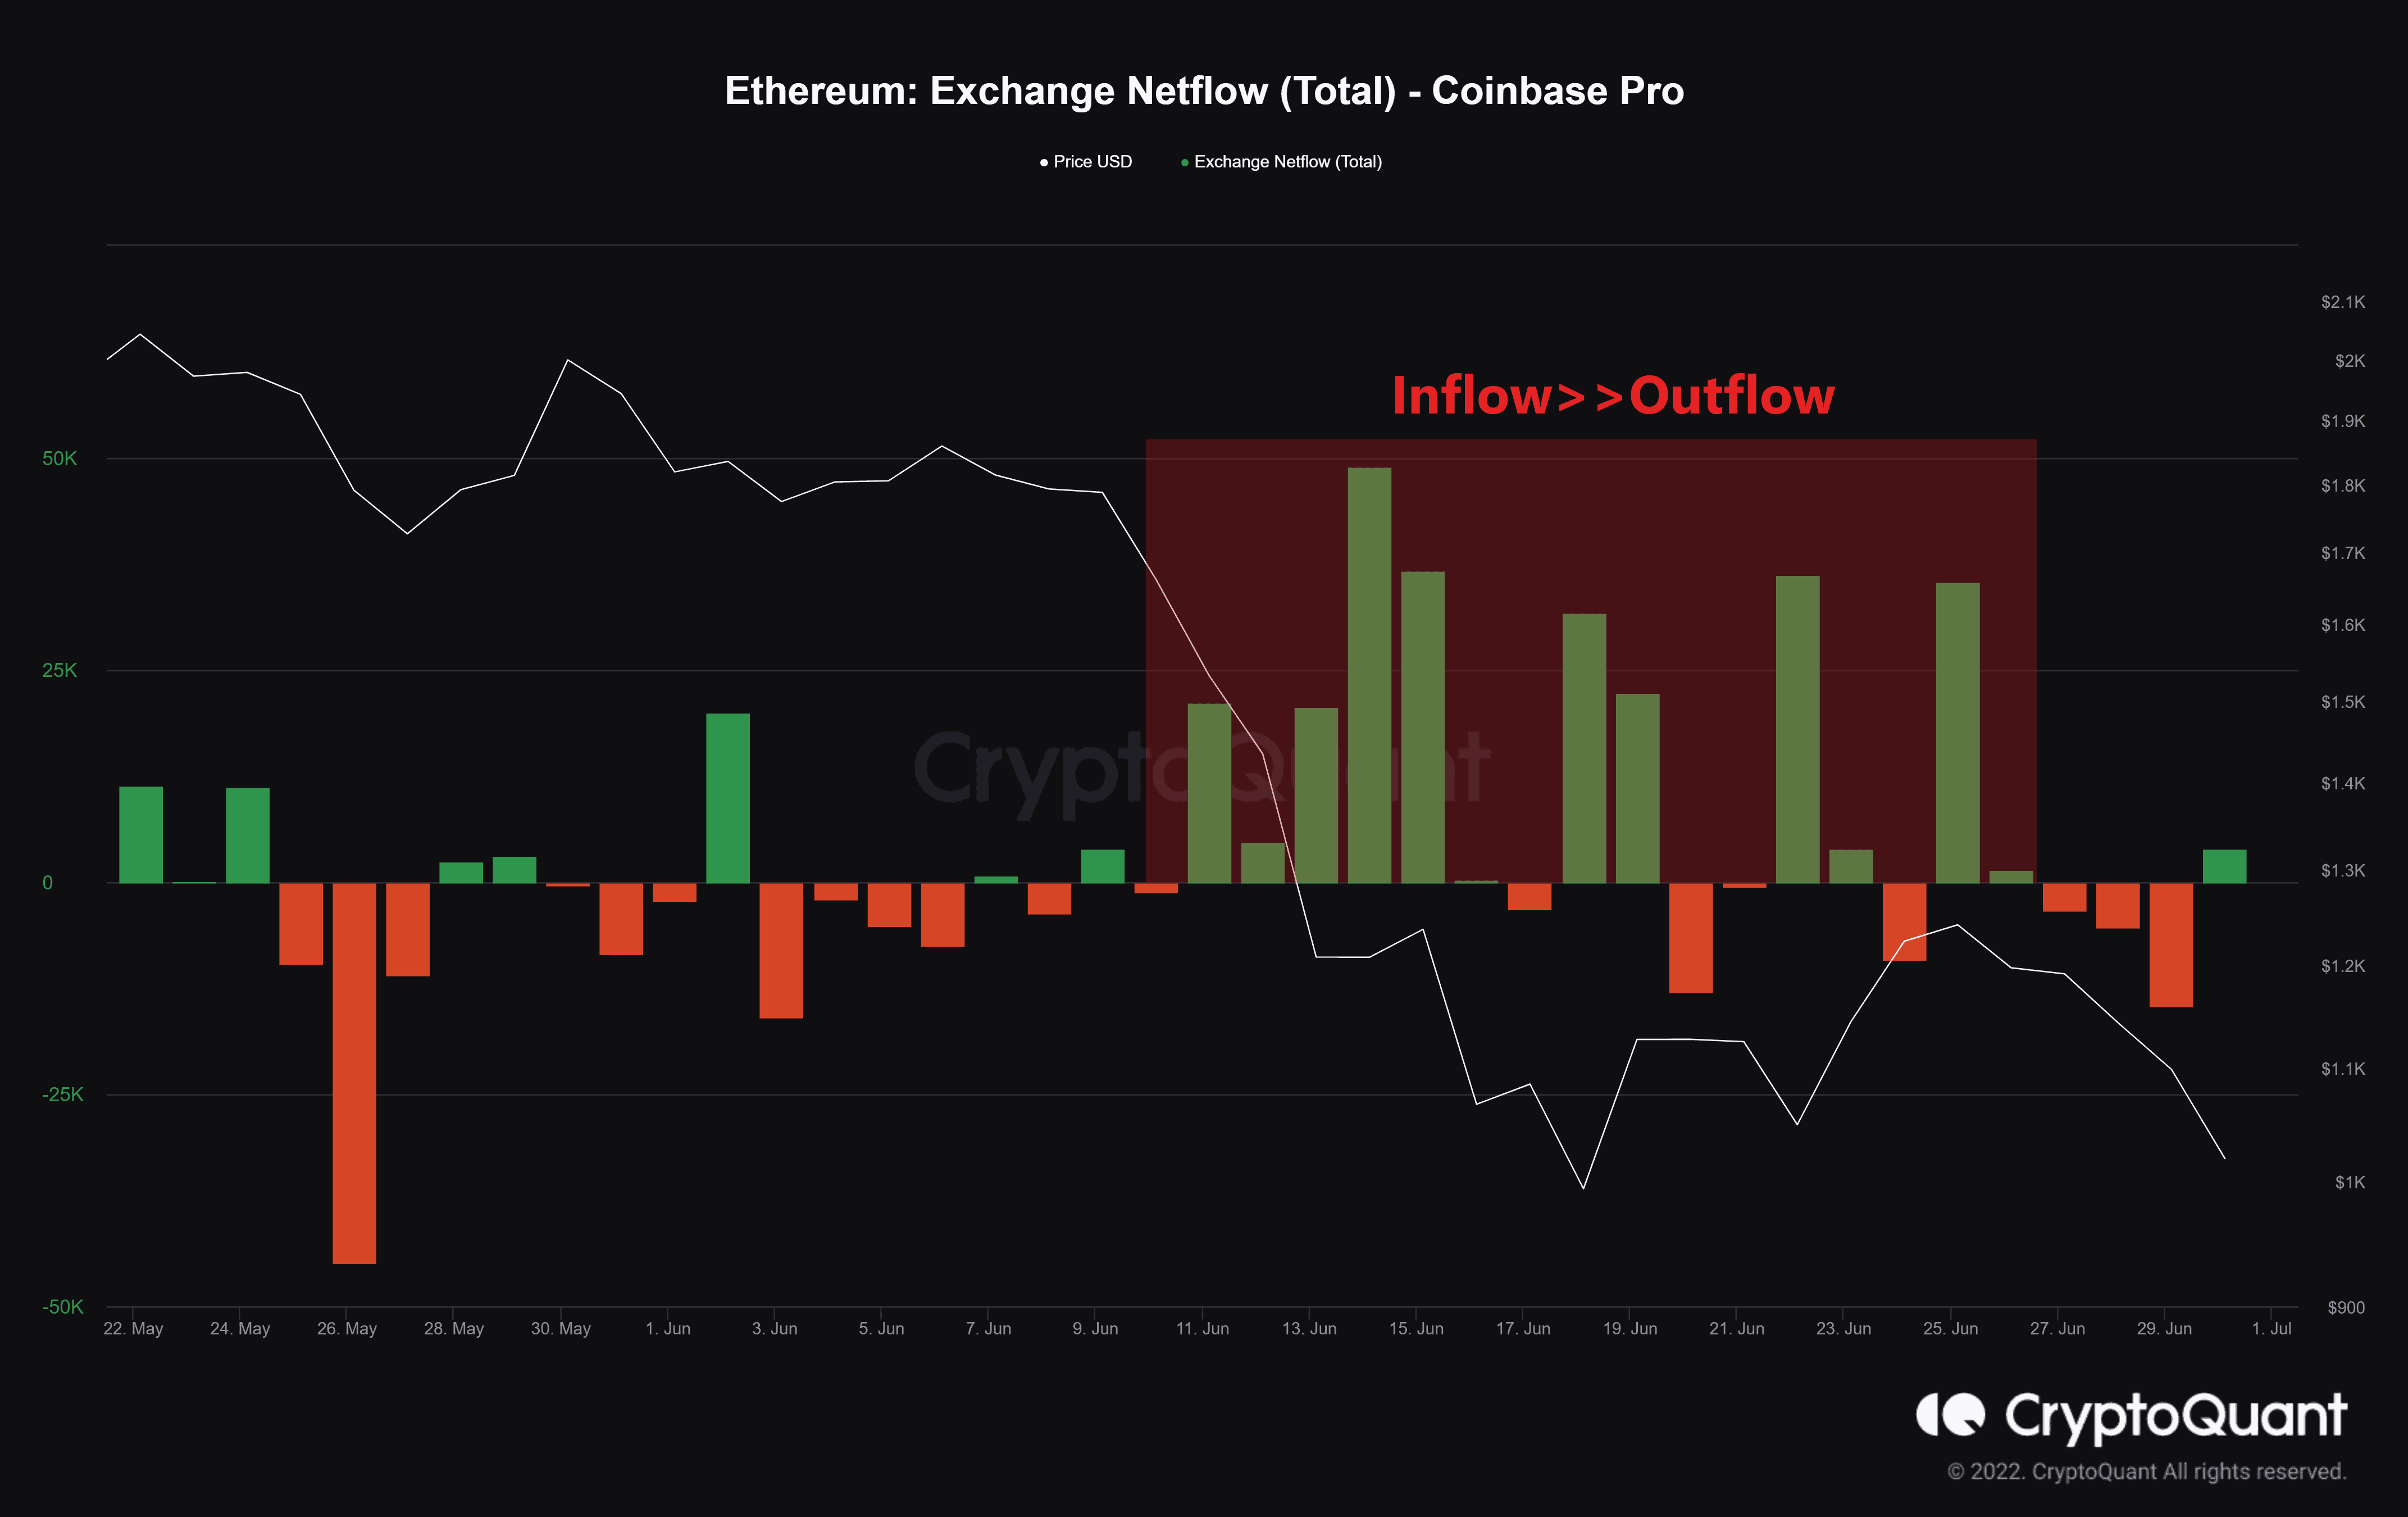
Definition: The difference between coins flowing into and out of the exchange. (Inflow – Outflow = Netflow) A positive value indicates the reserve is increasing. For a spot exchange, a high value also suggests the potential for increased selling pressure.
Given that Coinbase is indicative of the behavior of North American investors, the flows to and from this exchange are very important. Recently, the inflow to the exchange has trumped the outflow, which is why selling pressure increased. There is still no specific sign of investors’ willingness to buy ETH and withdraw it from the exchange.