Ethereum is up by a whopping 16% in the past seven days alone as the bulls have pushed the price above $1200 and seek higher levels. The question is if this rally is sustainable or if we’re bound to go into another pullback.
By Grizzly
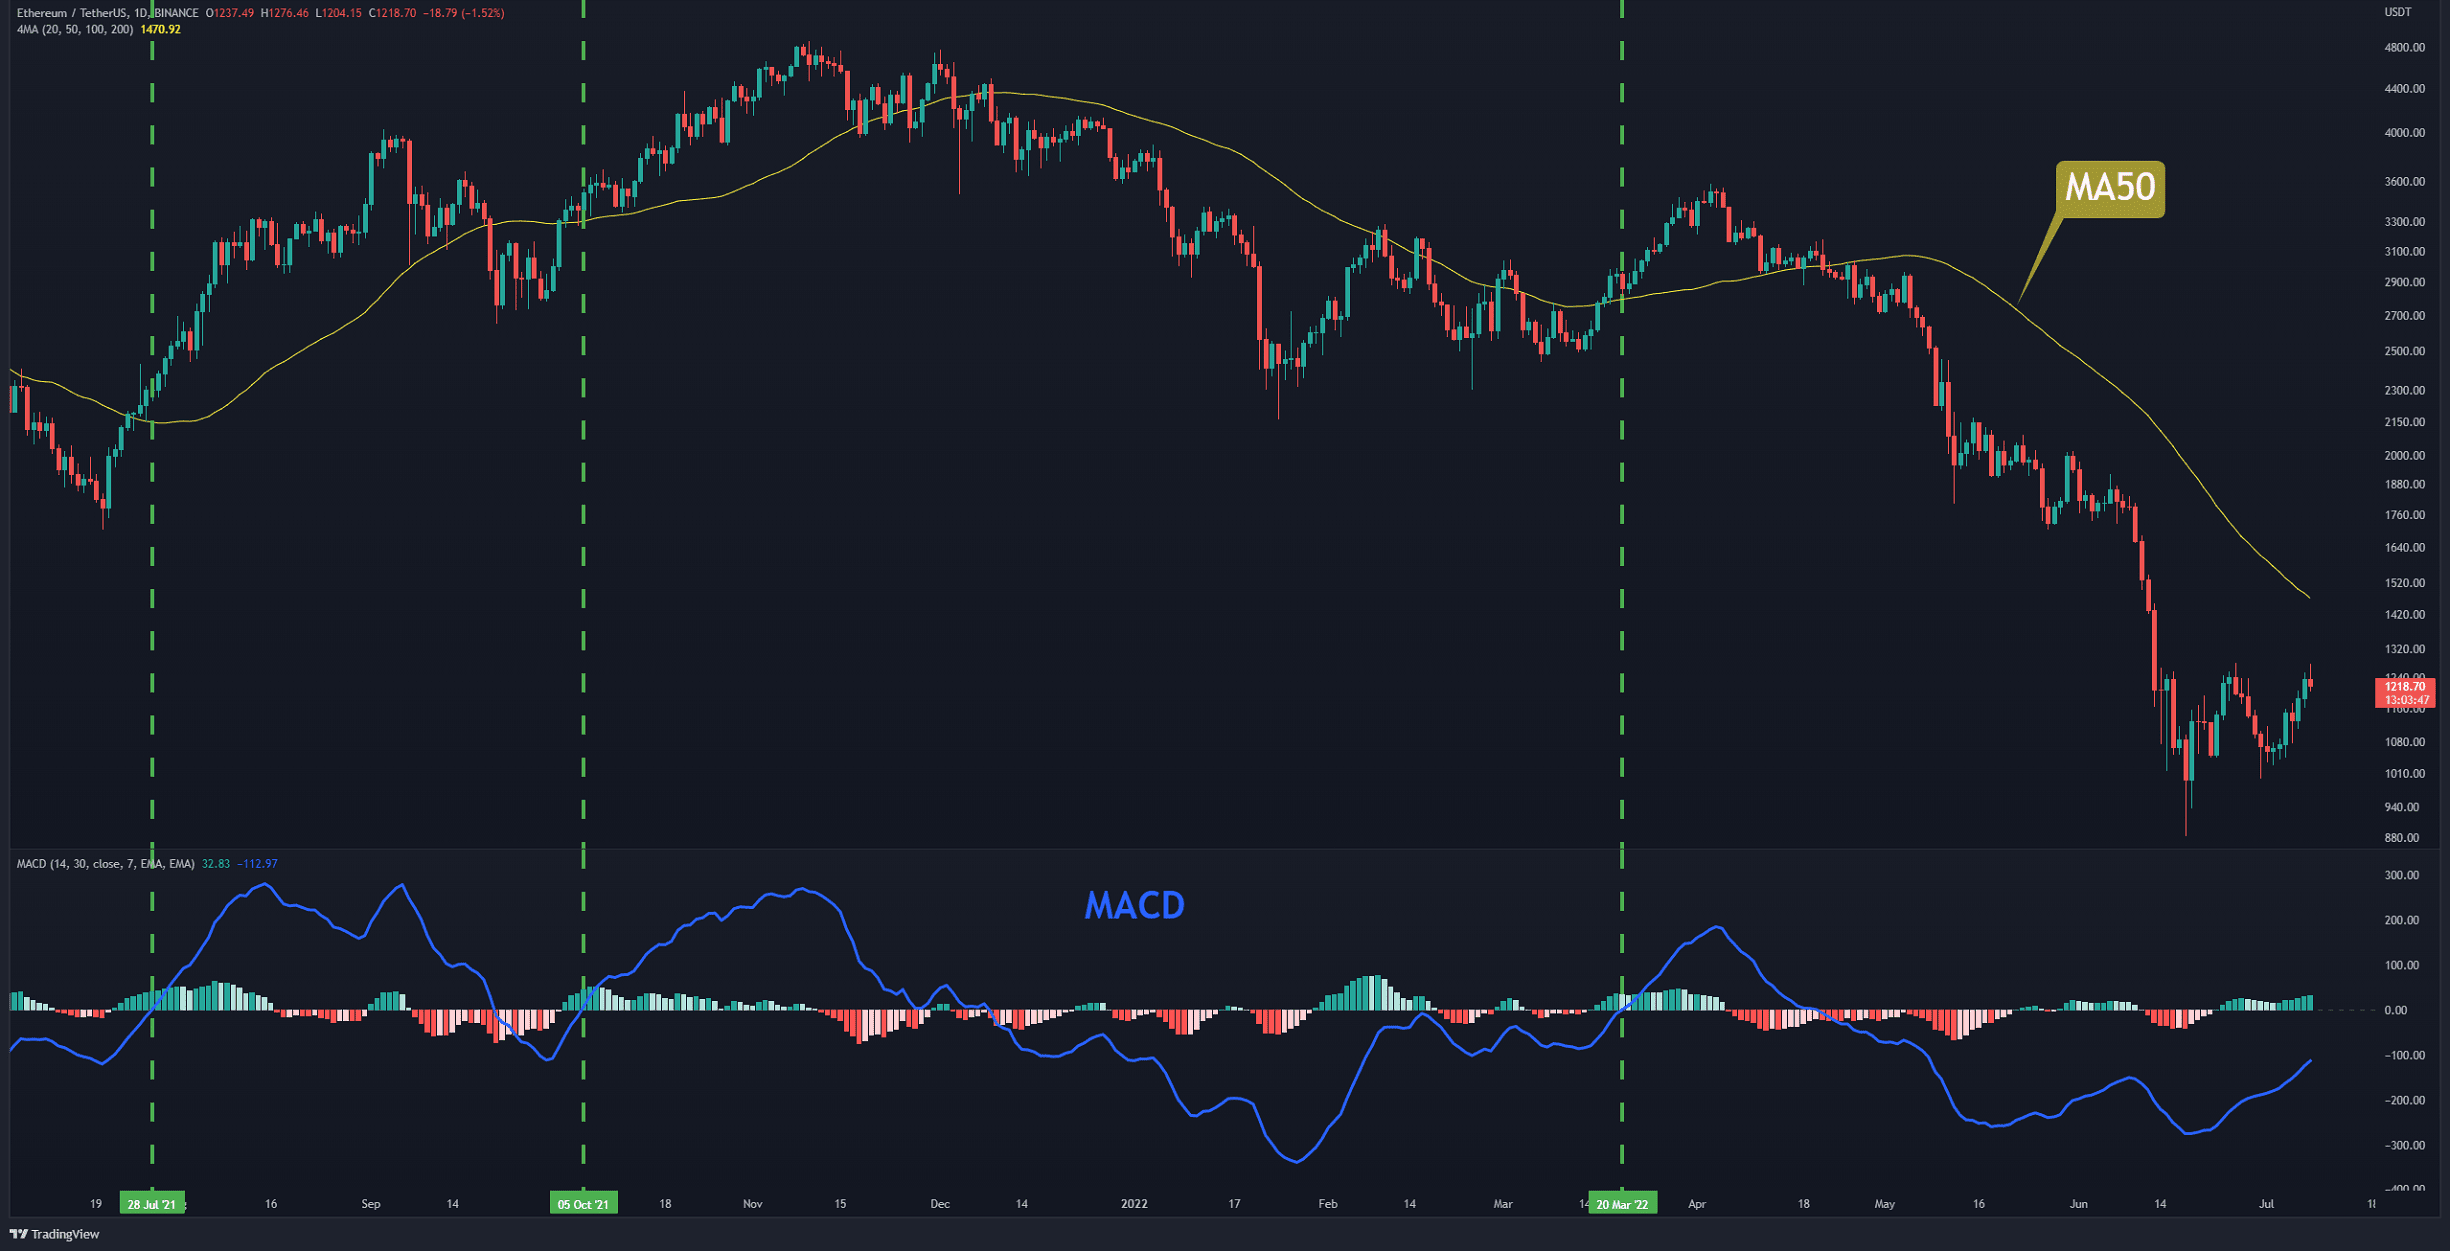
The following chart contains the daily 50 DMA (in yellow) and MACD (14, 30), marked in blue. During the last three attempts to initiate a rally, every time the MACD line broke the baseline, the histogram bars turned green, and the price crossed the MA50. According to recent historical data, these two signals, when triggered, have designated a breakout opportunity.
Currently, these have not been yet triggered. However, the MACD is moving towards the baseline while the price is approaching. Therefore, there is a relatively higher probability of a short-term rally if the mentioned structure is achieved in the coming days.
Key Support Levels: $1000 & $900
Key Resistance Levels: $1300 & $1500
Moving Averages:
MA20: $1144
MA50: $1471
MA100: $2148
MA200: $2592
Against BTC, keeping the same considerations in mind, the price is currently struggling with the 50 DMA. The MACD is close to the baseline. Against BTC, ETH seems to be better off. This means that if the necessary confirmations are accomplished, Ethereum could probably outperform Bitcoin.