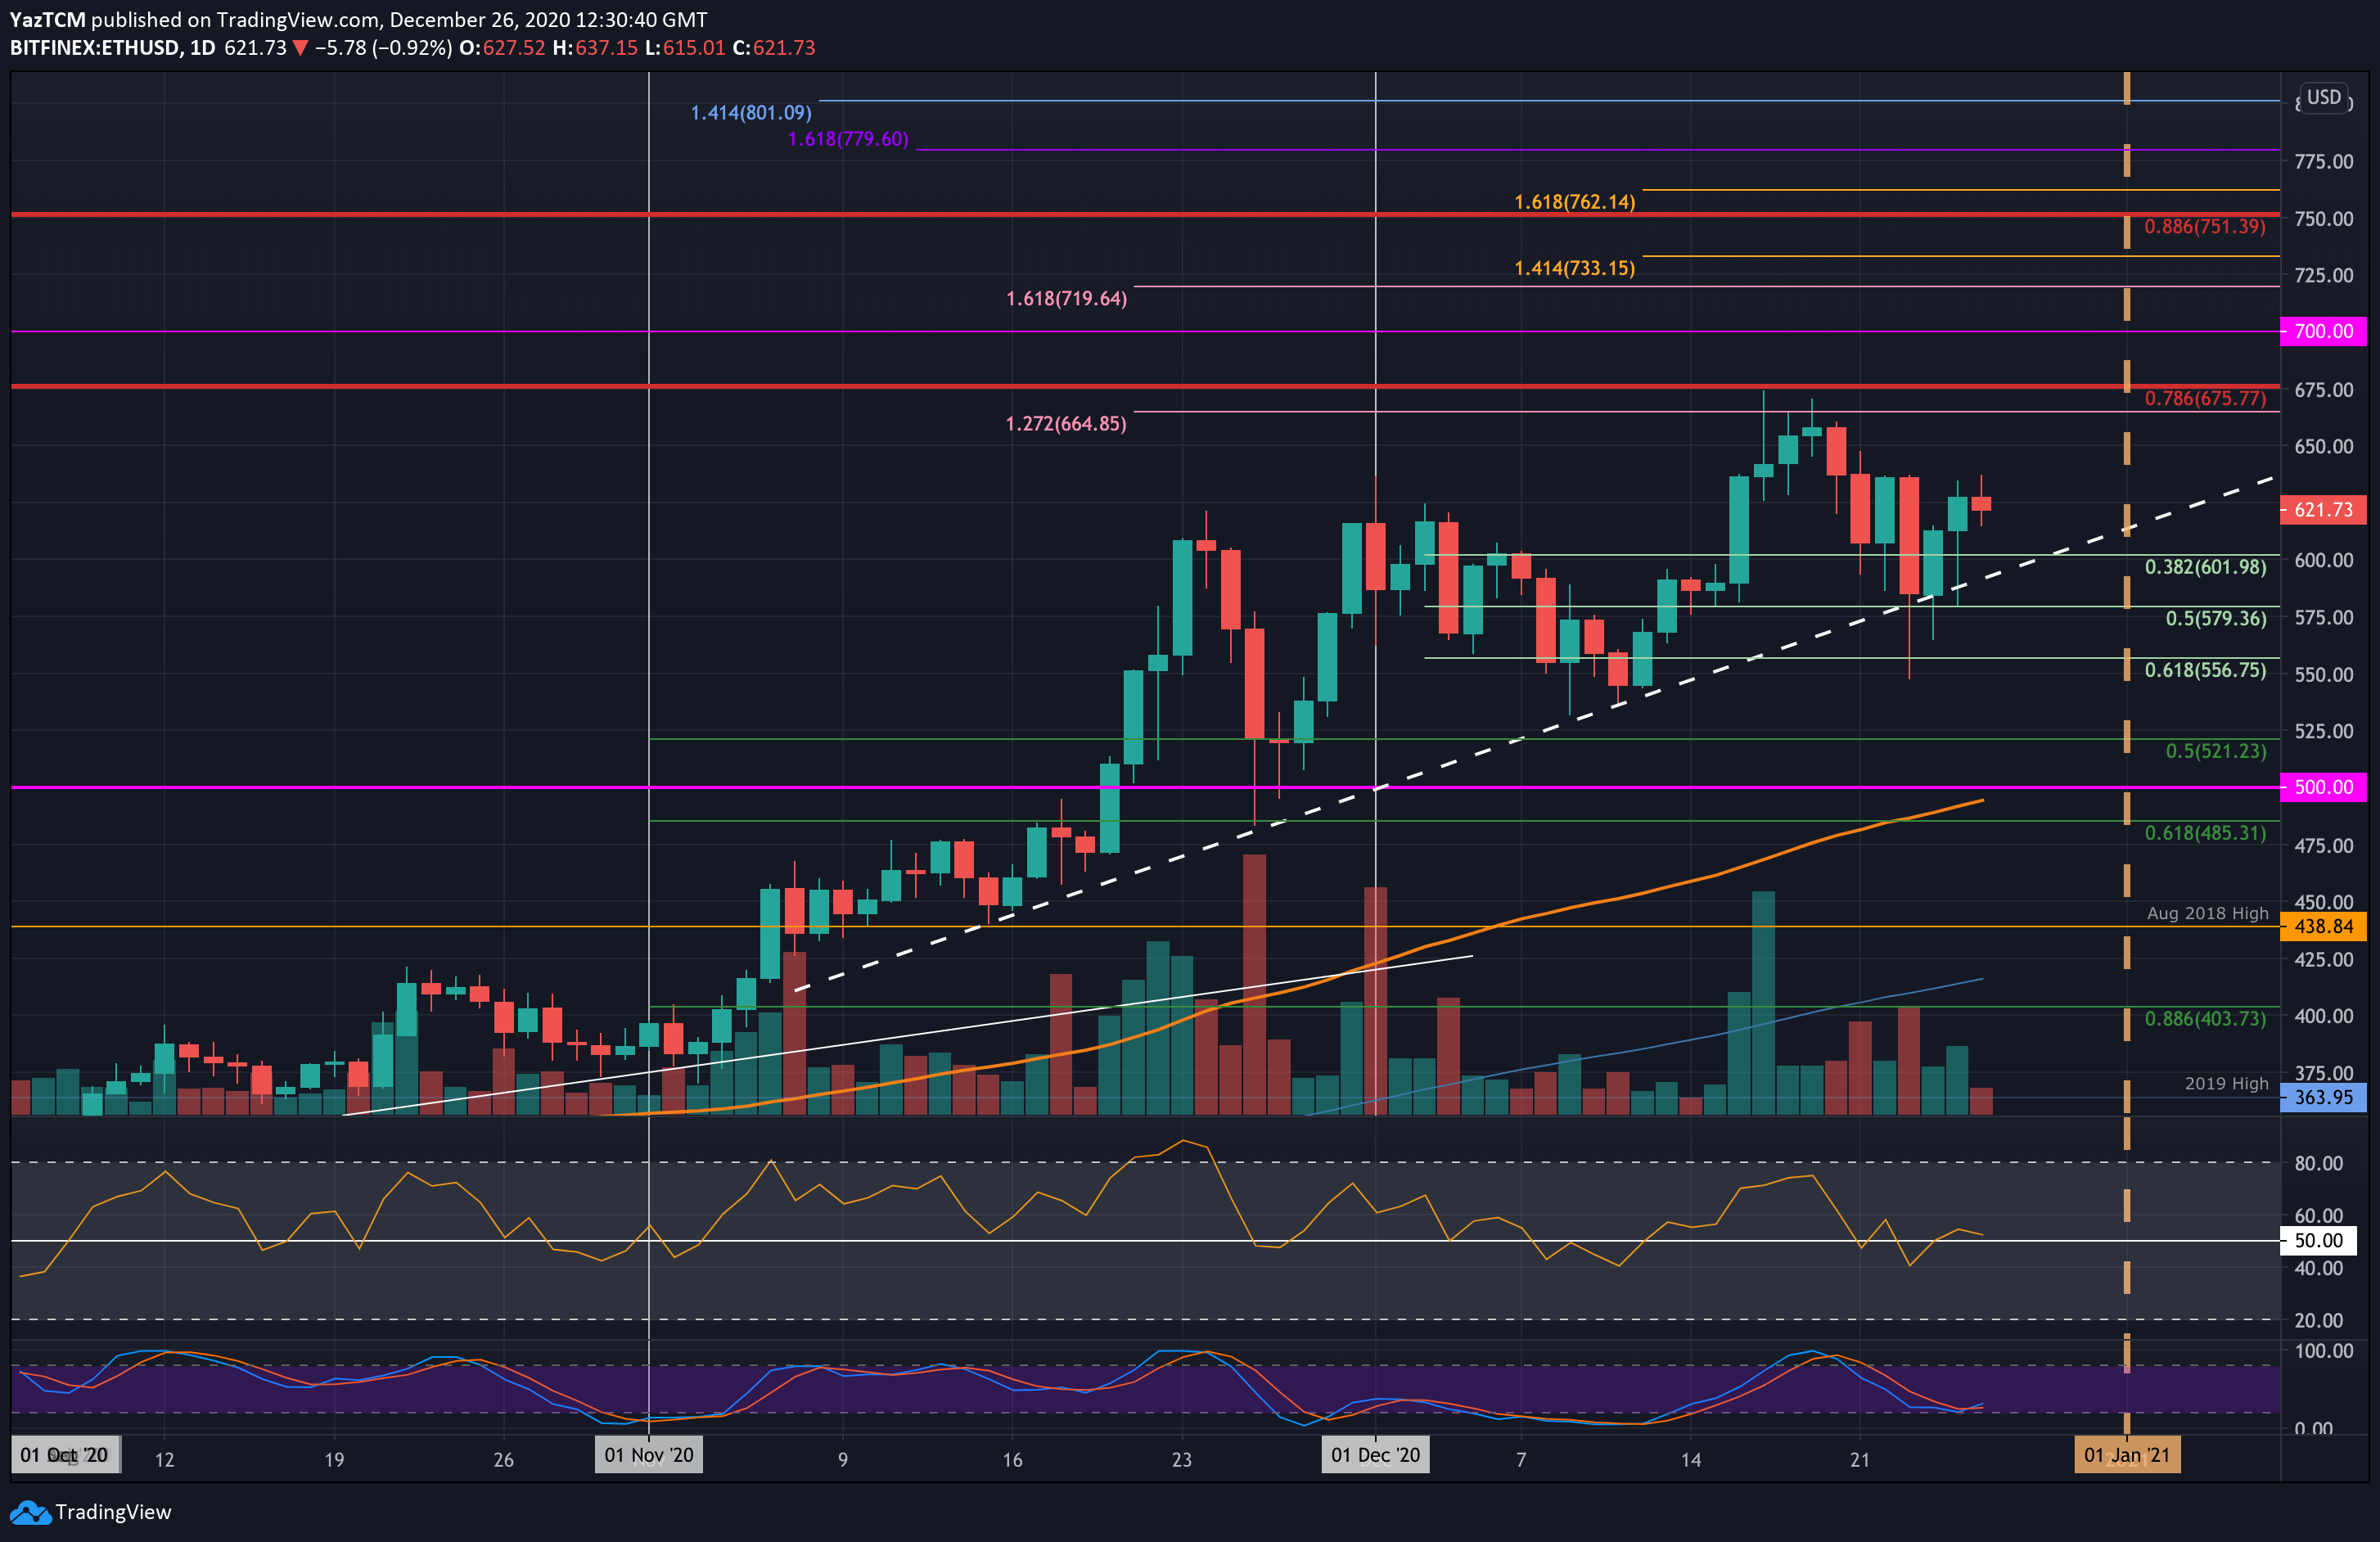
ETH/USD Daily Chart. Source: TradingView
Key Support Levels: $600, $580, $556.
Key Resistance Levels: $637, $650, $665.
Ethereum found support at the .5 Fib Retracement around $580 on Wednesday, which allowed it to rebound and remain above a 2-month-old rising trend line. From there, ETH pushed higher to reach $630 yesterday.
Today, ETH dropped marginally as it trades around $621. It will need to break above $637 for the bull run to restart.
Looking ahead, if the bulls push beyond $637, the first level of resistance lies at $650. This is followed by $665 (1.272 Fib Extension), $675 (bearish .786 Fib Retracement), and $700.
Alternatively, the first level of support lies at $600 (.382 Fib). This is followed by the 2-month-old rising trend line, $580 (.5 Fib Retracement), and $556 (.618 Fib Retracement).
The RSI is marginally above the mid-line as the buyers attempt to gain possession of the market momentum. The Stochastic RSI is primed for a bullish crossover signal that will push ETH back toward the December highs.
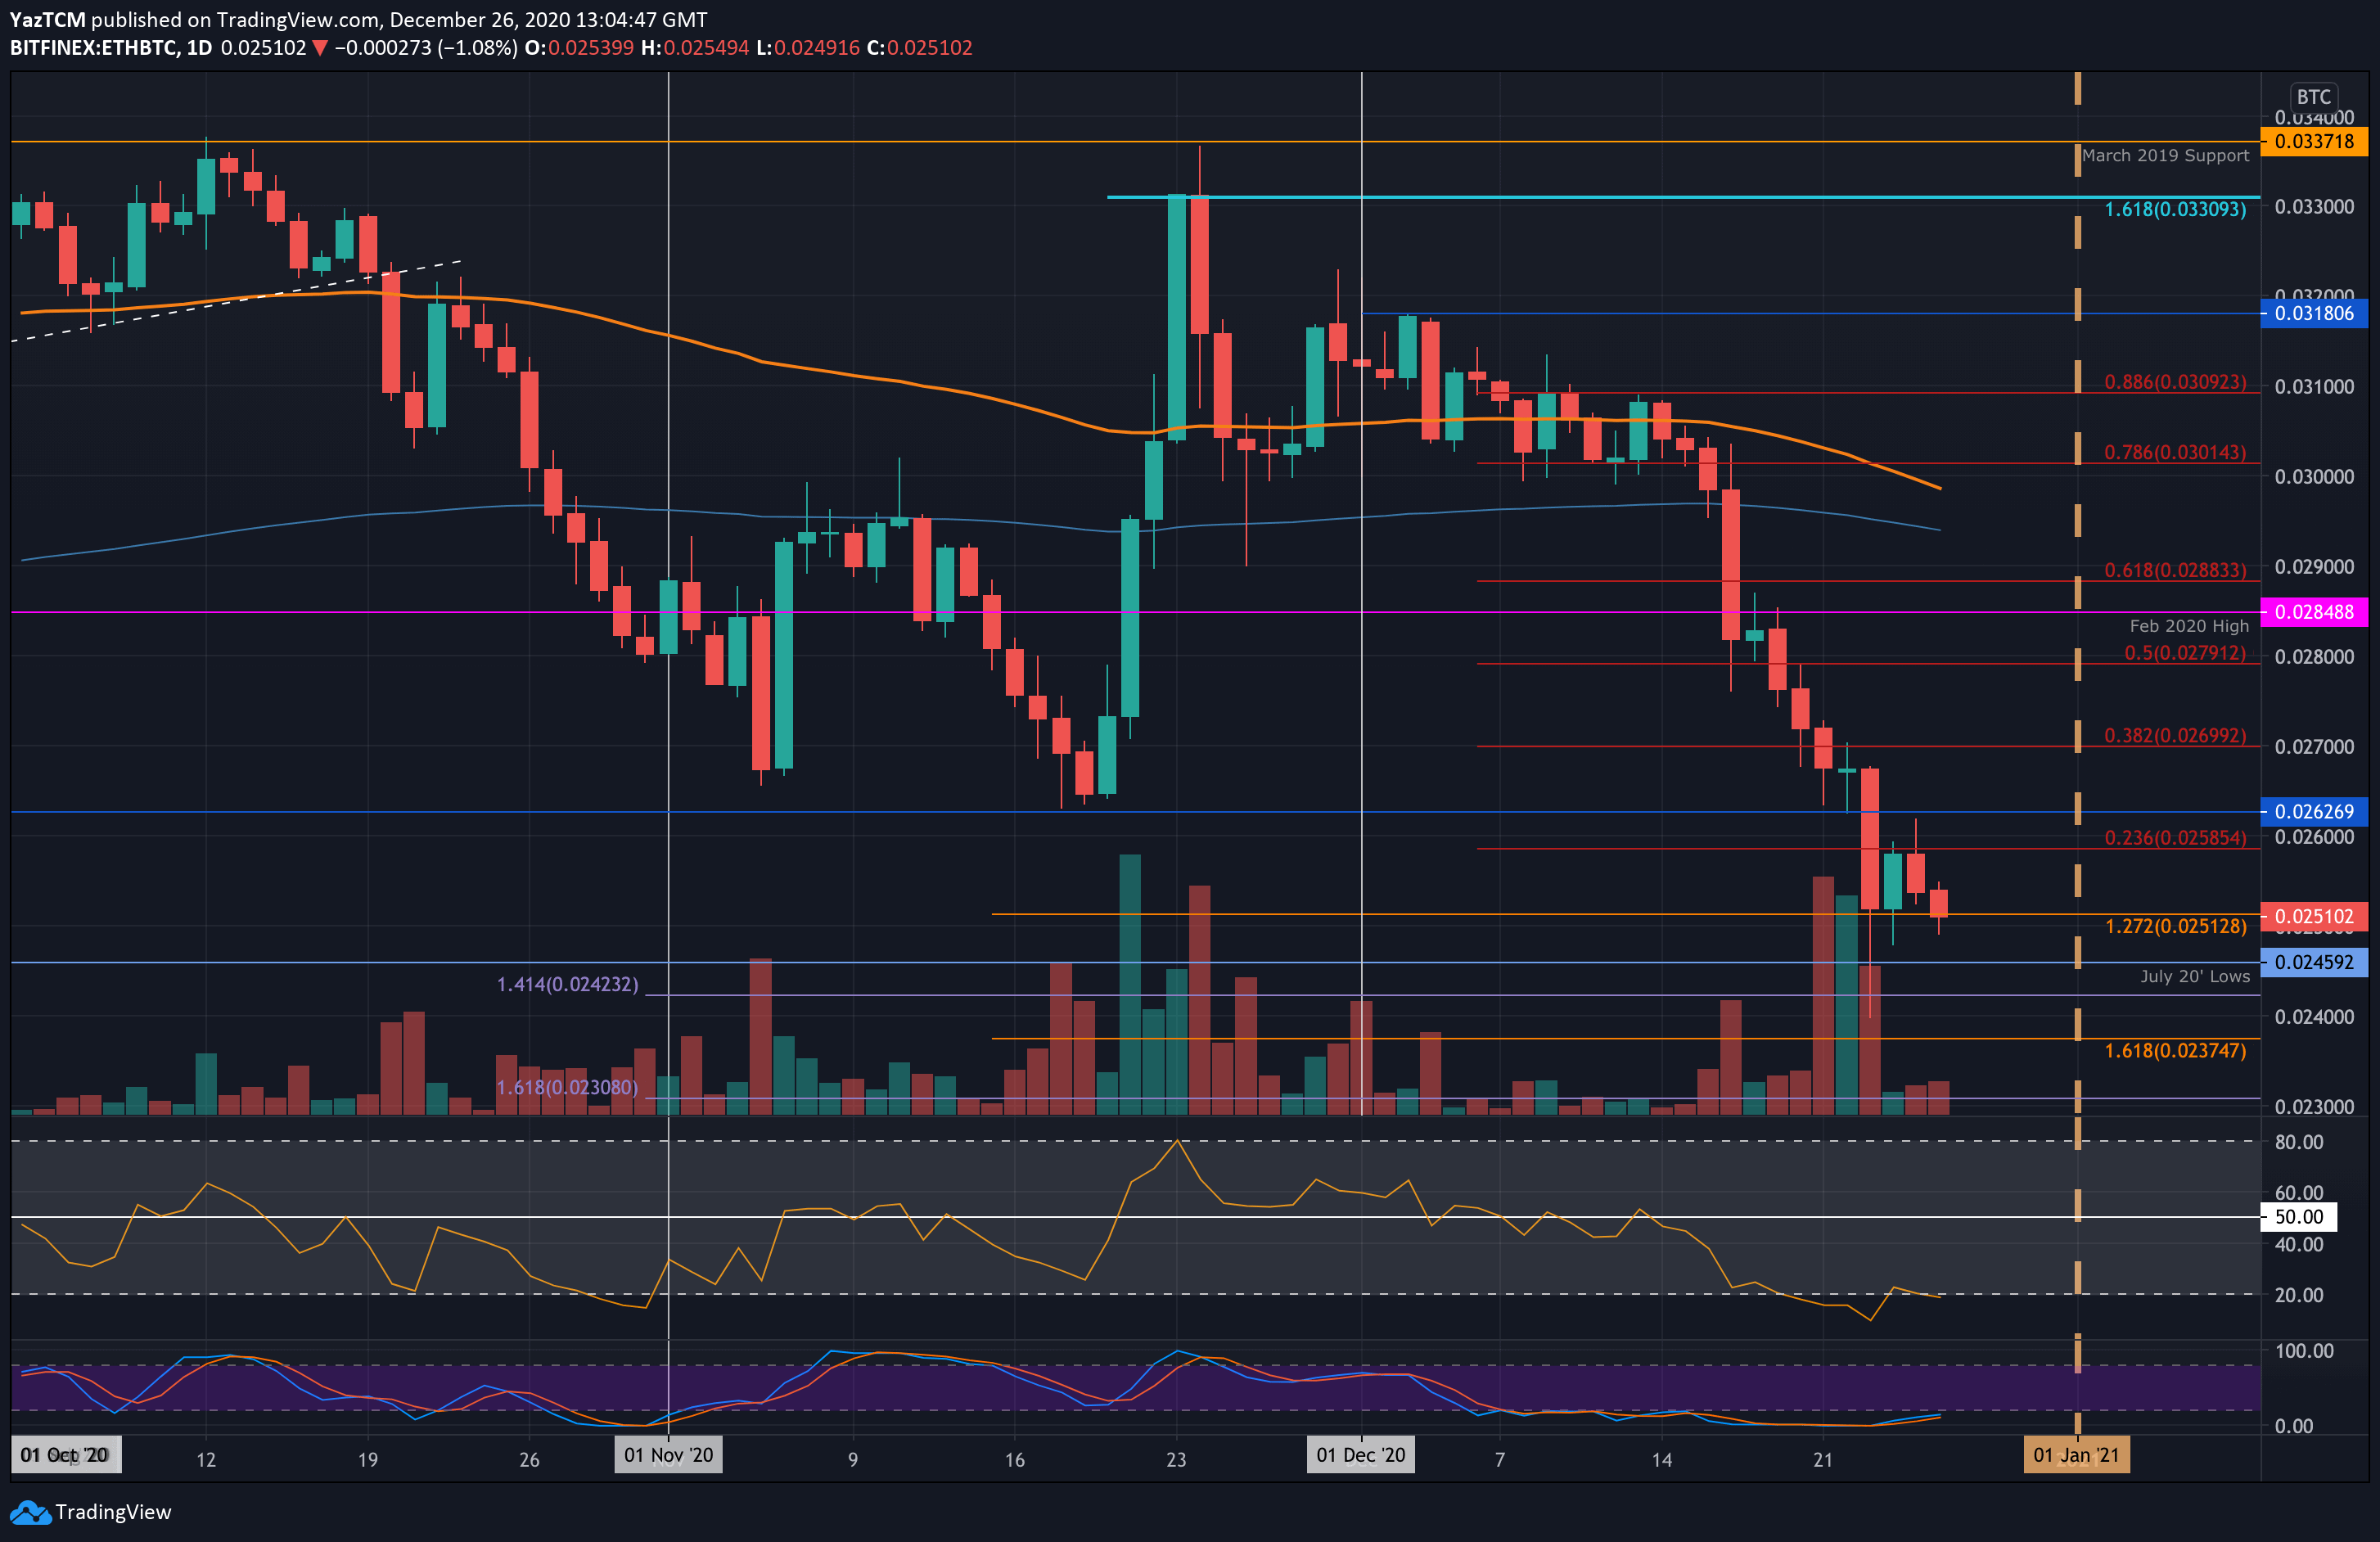
Key Support Levels: 0.025 BTC, 0.0245 BTC, 0.0242 BTC.
Key Resistance Levels: 0.0248 BTC, 0.026 BTC, 0.0262 BTC.
Against Bitcoin, Ethereum bounced from the 0.0251 BTC support on Wednesday to reach the 0.0258 BTC resistance (bearish .236 Fib Retracement) yesterday. It could not break above this resistance, which caused ETH to head lower today and return to 0.0251 BTC.
A closing candle beneath 0.025 BTC is likely to send ETH lower against BTC toward fresh seven month lows.
Looking ahead, beneath 0.025 BTC, support is first located at 0.0245 BTC (July 2020 lows). Beneath this, support lies at 0.0242 BTC, 0.024 BTC, and 0.0237 BTC (downside 1.618 Fib Extension).
On the other side, the first level of strong resistance lies at 0.0258 BTC (bearish .236 Fib). Beyond 0.026 BTC, resistance lies at 0.0262 BTC, 0.027 BTC (bearish .382 Fib), and 0.0279 BTC.
Both the RSI and Stochastic are extremely oversold here, indicating that the bears control the market momentum.