EOS has seen a 6% price decrease over the past 24 hours bringing its price down to $3.85. The cryptocurrency increased by a total of 34% in September (from low to high). However, EOS has now reached resistance which had caused it to roll-over and drop.
EOS remains the seventh-largest cryptocurrency with a market cap of $3.61 billion.
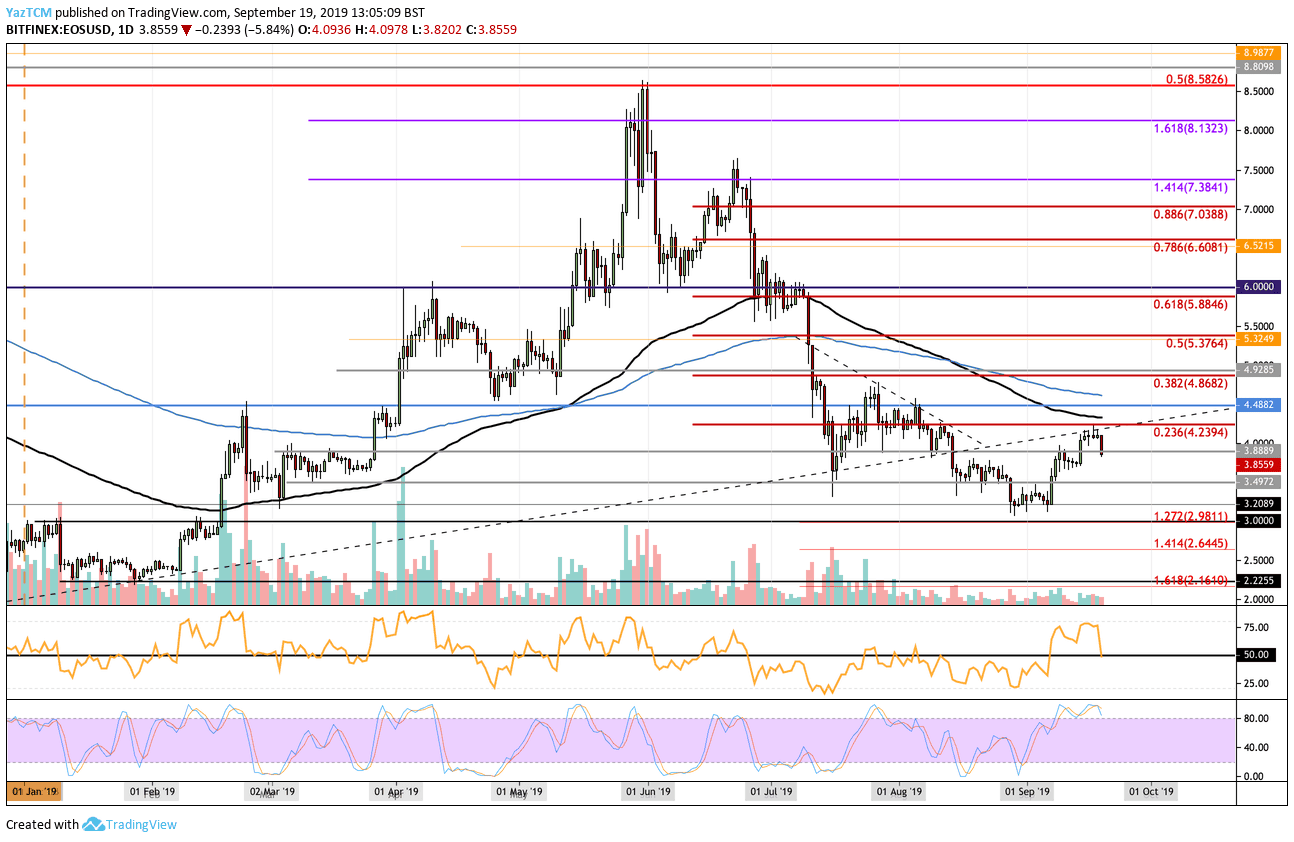
Looking at the EOS/USD 1-Day Chart:
- Since our previous EOS analysis, EOS continued to climb higher from the resistance at $3.88. It continued to rise until reaching resistance provided by the previous rising trend line that spans through the entire 2019. This area of resistance is further bolstered by a bearish .236 Fib Retracement.
- From above: The nearest levels of resistance lie at $4 and $4.23. Above this, resistance is closely located at $4.35 (100-days EMA), $4.50, $4.65 (200-days EMA, and $5.00. If the bulls break $5.00, resistance is found at $5.37 (bearish .382 Fib Retracement), $5.50, $5.88, and $6.00.
- From below: The nearest levels of support lie at $3.80 and $3.50. Beneath this, support lies at $3.20, $3.00, $2.98, and $2.64.
- The trading volume has increased slightly but still remains relatively low.
- The RSI has plummeted toward the 50 level which shows there is now indecision within the market as the bulls lose control of the market momentum. Furthermore, the Stochastic RSI has produced a bearish crossover signal that could send the market south.
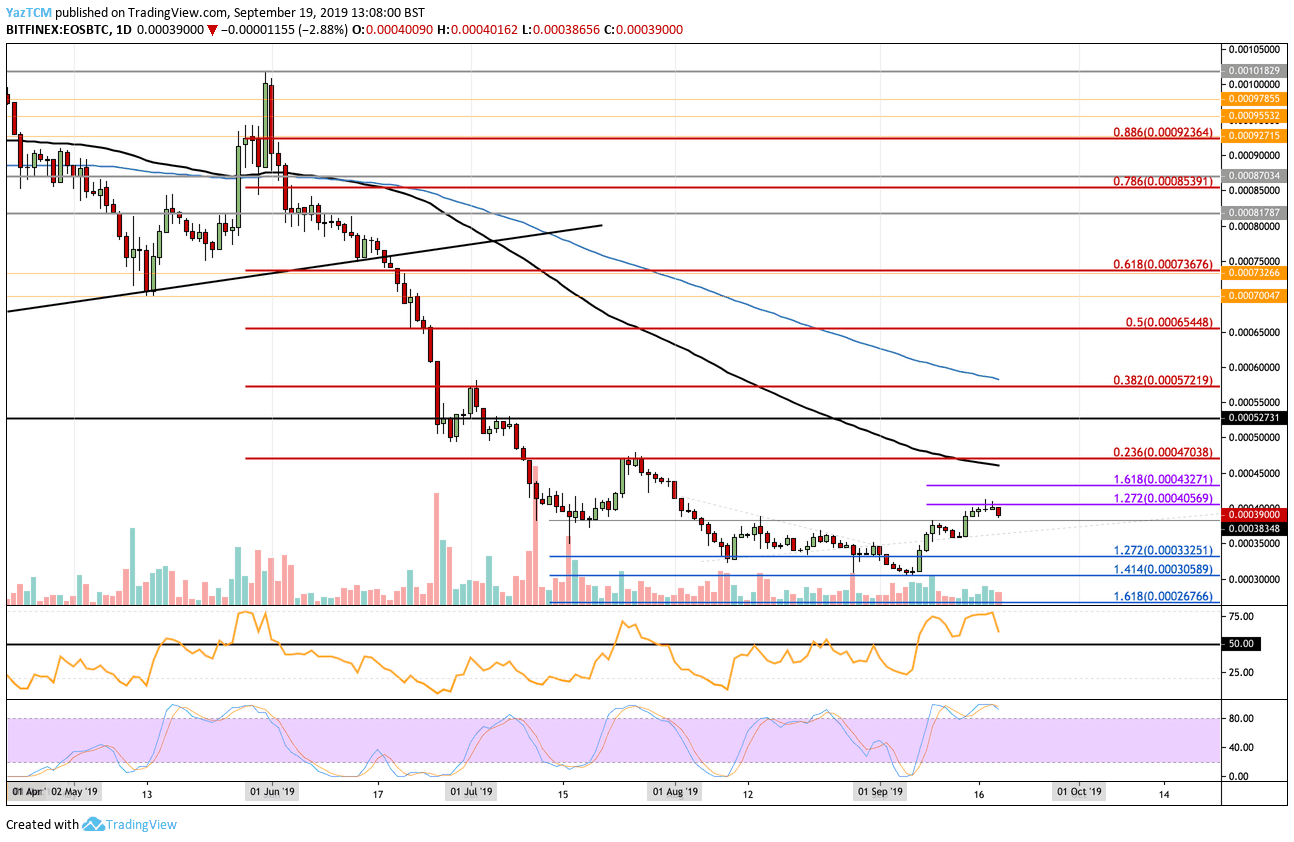
Looking at the EOS/BTC 1-Day Chart:
- Against Bitcoin, EOS climbed above the resistance at 0.0038 BTC and continued to rise towards the resistance at 0.0040569 BTC provided by the short term 1.272 Fibonacci Extension level (marked in purple). After reaching this level of resistance, EOS fell slightly which caused EOS/USD to fall also.
- From above: The nearest level of resistance lies at 0.00405 BTC. Above this, higher resistance lies at 0.004327 BTC (1.618 Fib Extension) and 0.0045 BTC. Further resistance is then found at 0.0047 BTC which also contains the 100-days EMA.
- From below: The nearest level of support lies at 0.003848 BTC. Beneath this, support can be found at 0.0035 BTC, 0.0003325 BTC, 0.00030 BTC, and 0.0002676 BTC.
- The trading volume remains relatively low.
- The RSI is still in the bullish favor but is falling which shows that the bulls are losing their strength. Likewise, the Stochastic RSI is in overbought conditions as we wait for a bearish crossover signal.
SPECIAL OFFER (Sponsored)
LIMITED OFFER 2024 for CryptoPotato readers at Bybit: Use this link to register and open a $500 BTC-USDT position on Bybit Exchange for free!
Disclaimer: Information found on CryptoPotato is those of writers quoted. It does not represent the opinions of CryptoPotato on whether to buy, sell, or hold any investments. You are advised to conduct your own research before making any investment decisions. Use provided information at your own risk. See Disclaimer for more information.
Cryptocurrency charts by TradingView.