In many areas of life, size often impacts the outcome of an event: a large bus, for example, will inflict more significant damage on a brick wall than a go-kart. Similarly, volume impacts cryptocurrency trading.
Trading volume usually can be seen as the bottom vertical bars on price charts. Comparing the height of those bars to each other can show the volume’s activity, relative to other points in the asset’s price timeline. Since these charts are often specific to just one exchange, however, one might also visit exchanges data aggregators such as CoinMarketCap to see the overall asset trading volume numbers, as exchanges can noticeably vary in volume, depending on the exchange.
At the time of this writing, for example, Bitcoin posted a bit more than $10 billion in volume over the past 24 hour period, according to CoinMarketCap. CoinBene tallied close to 4% of that volume, at roughly $477 million.
High trading volume can mean significant money flow and interest in a given asset. When Bitcoin trading volume picks up, for example, it can indicate that more people are trading the asset, or people are putting money into trading the asset. It can sometimes be used to gauge interest and attention. Volume can apply to all assets, but for simplicity, Bitcoin is used for example in this article.
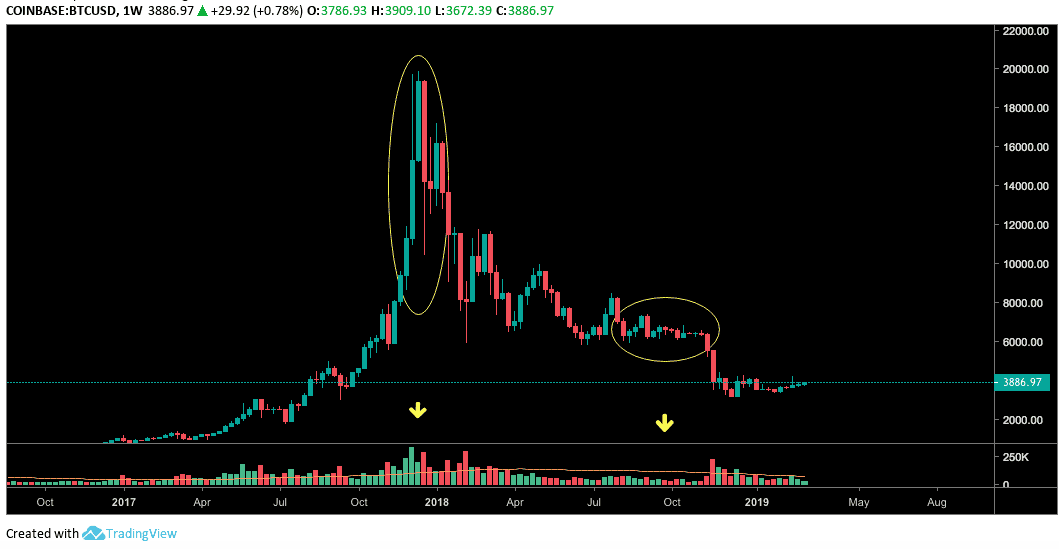
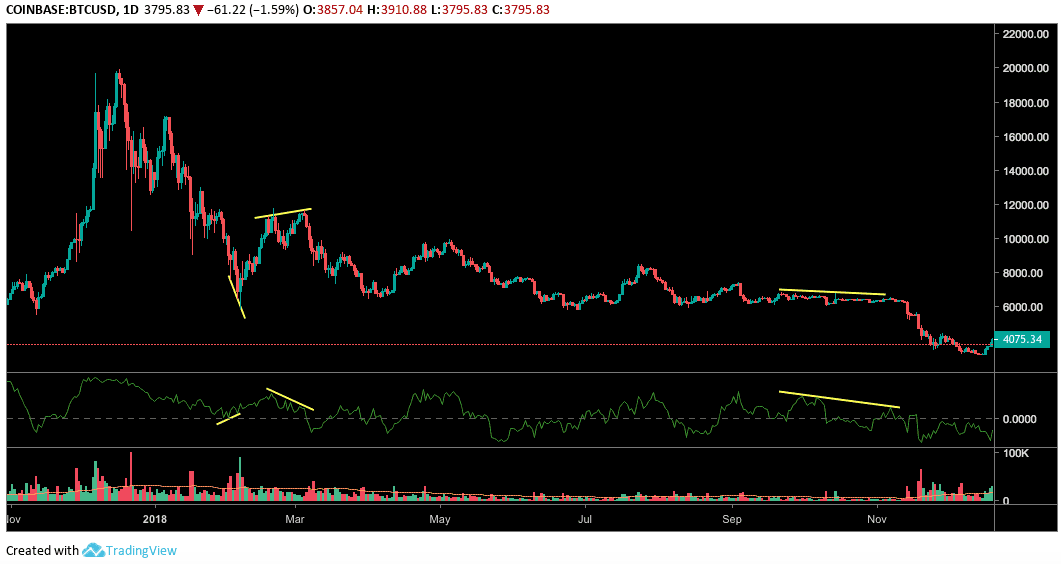
Bitcoin posted significant volume near the end of 2017 when the mainstream public saw seemingly constant talk about Bitcoin, and the asset posted astronomic price gains. Similarly, Bitcoin’s price crash in 2018 also saw significant volume, but this time sellers’ volume (red candles).
In contrast, compared to the bull run and the following crash, Bitcoin seemingly saw considerably less volume during its lull in volatility in fall of 2018, according to the presented TradingView’s Coinbase weekly candle chart.
Additionally, the volume can give more significance to price movements and show they are more meaningful regarding future moves and overall trend.
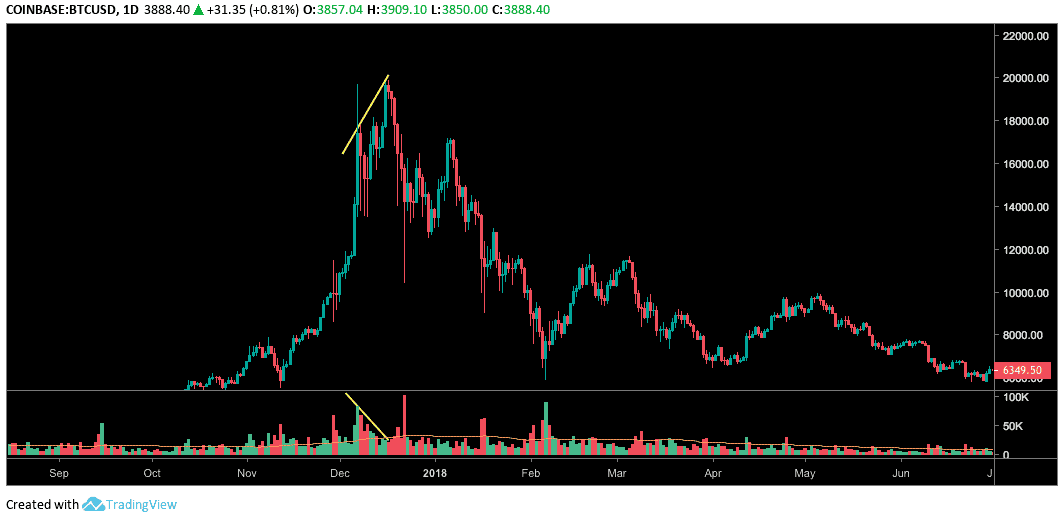
In addition to general information, volume can sometimes seem to hint toward a change in trend. Divergence is commonly mentioned in the case of the Relative Strength Index (RSI). Divergence, however, can also sometimes apply to trading volume. As shown on Bitcoin’s daily candle chart, Bitcoin’s price posted an increasing price, while the volume appears to show a decreasing trend (decreasing amount of buyers). Price then fell afterward.
When the volume is low, it can sometimes leave the market vulnerable to significant price swings. Logically, this can be due to thin order books. If the daily Bitcoin trading volume is low, it might mean the order books are thin, lacking enough available orders at the current price to satisfy a big seller or buyer. If one huge order comes through and buys or sells the entire asset within close price proximity (buys or sells the walls) then it can cause slippage, and price can react dramatically in response.
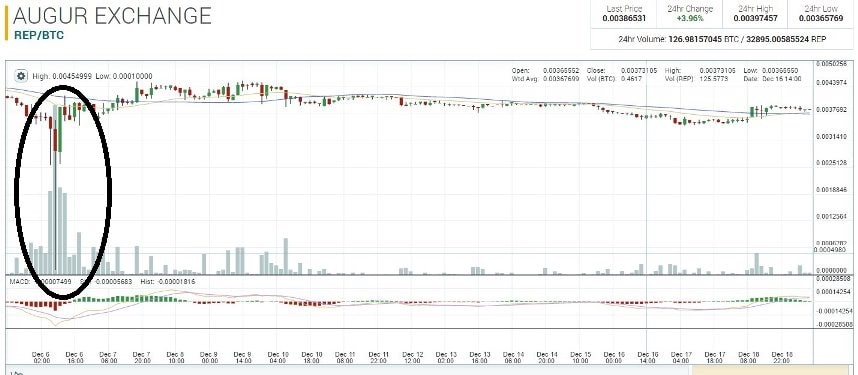
Volume can become especially pertinent when speaking about altcoin trading. If a coin or token is not getting much daily volume, it can become challenging to unload or scale out of a more substantial position, because not enough buyers may be available.
The price might show an altcoin at $0.10 per coin. But if that coin does not have much volume, there might only be a small number or sell orders stagnant at that price. Subsequent orders might be notably lower, causing slippage and a price drop if a big seller (“a whale”) tries to liquidate a large position at once. That seller’s asset liquidation might also end in money loss for the seller, selling to orders noticeably lower than the initial $0.10 orders, because no orders closer in price may be available.
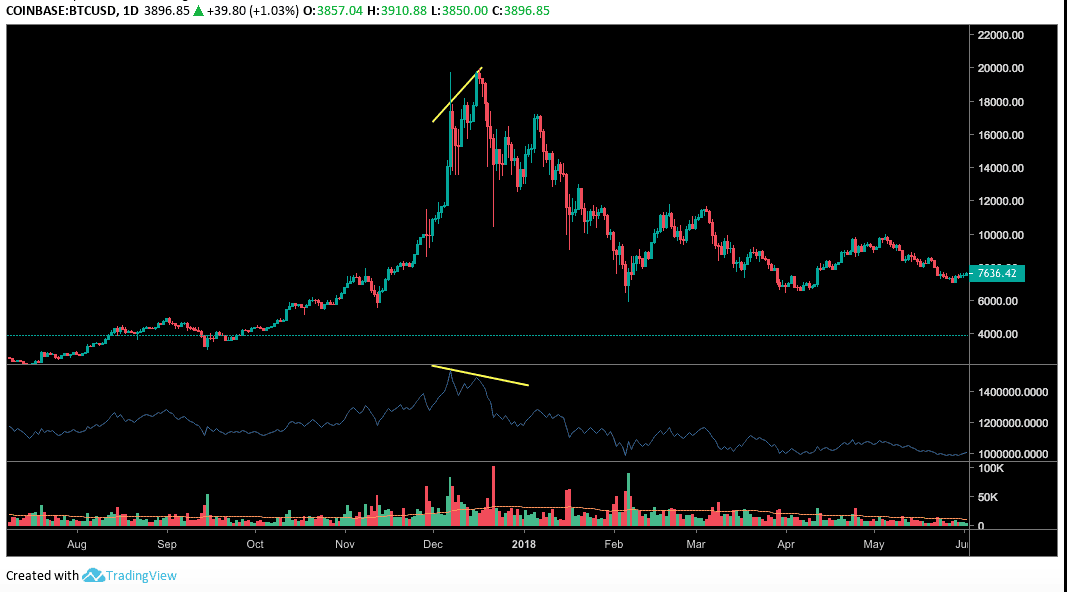
A couple of volume-based indicators can come into play regarding the crypto space. One such indicator is the On Balance Volume (OBV) indicator. OBV helps present the stream of volume concerning price trend or movement. Divergences sometimes can be seen with OBV about the price.
The Chaikin Money Flow (CMF) indicator is another interesting associated indicator which gauges the volume of money movement regarding specific time segments. Divergences on the CMF indicator also can be seen in comparison to price.
It is also important to note that no system or indicator is foolproof. Fake-outs and false signals or break-outs do occur. It can be helpful to take multiple different times frames into account, as well as finding congruence with more than one indicator or signal. A multitude of patterns and indicators exist in crypto. The death cross, triangles and wedges are just a few of such examples. Traders should develop and learn what works for their personal trading system.