The Stochastic Relative Strength Index, or Stoch RSI for short, is a well-known momentum technical indicator in the crypto trading world and in general trading. The Stoch RSI utilizes aspects from both the Stochastic indicator and the RSI indicator. Essentially, the Stoch RSI is the Stochastic indicator, with action based on RSI levels in place of price levels.
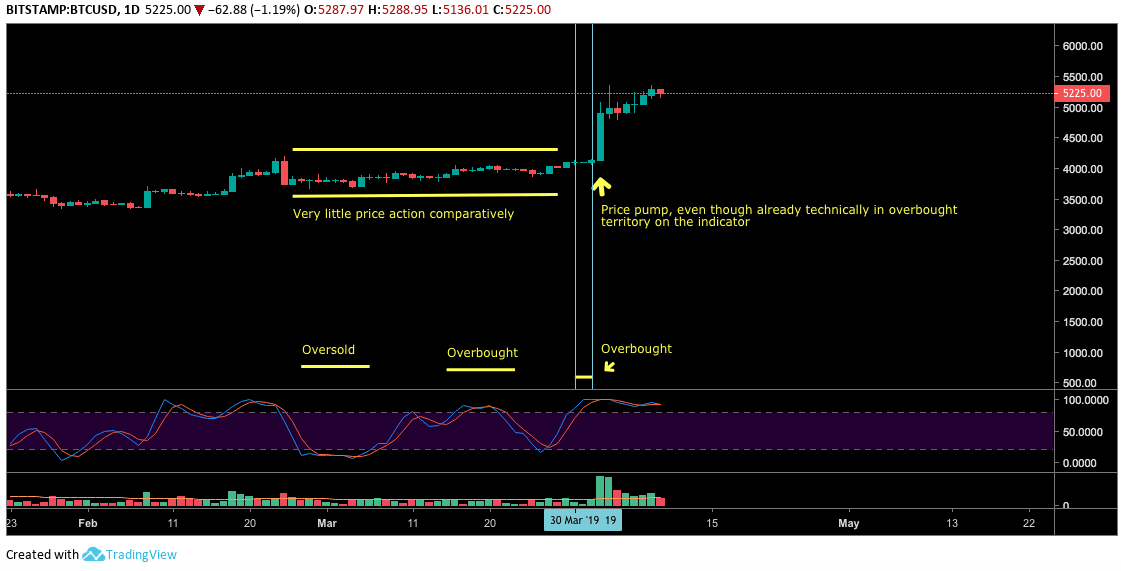
The Stoch RSI, at face value, is composed of a numerical range of 0 to 100. The indicator comes standard with dotted lines at both 20 and 80. Typically, any action over the 80 range is labeled as “overbought territory,” and anything below 20 is thought to be “oversold.”
The Stoch RSI also has two interacting lines, labeled K and D. On the Stoch RSI, these values both come standard at a value of 3, with RSI and Stochastic lengths both at 14. In comparison, the regular stochastic indicator has lines called %K and %D, with values of 14 at 3 respectively, and a smooth value input of 3.
Using the Stoch RSI indicator in terms of simple overbought and oversold conditions can be difficult, providing many fakeouts and false signals. The indicator also can stay in those high and low ranges for extended periods of time.
Sometimes, however, it can be useful to note periods of overbought or oversold levels, when used in conjunction with other analysis and indicators. Utilizing multiple indicators, observations and methods can help come to a more well-rounded conclusion. It is essential not to take any one indication as fact that a particular outcome will definitely occur and to weigh multiple options and viewpoints.
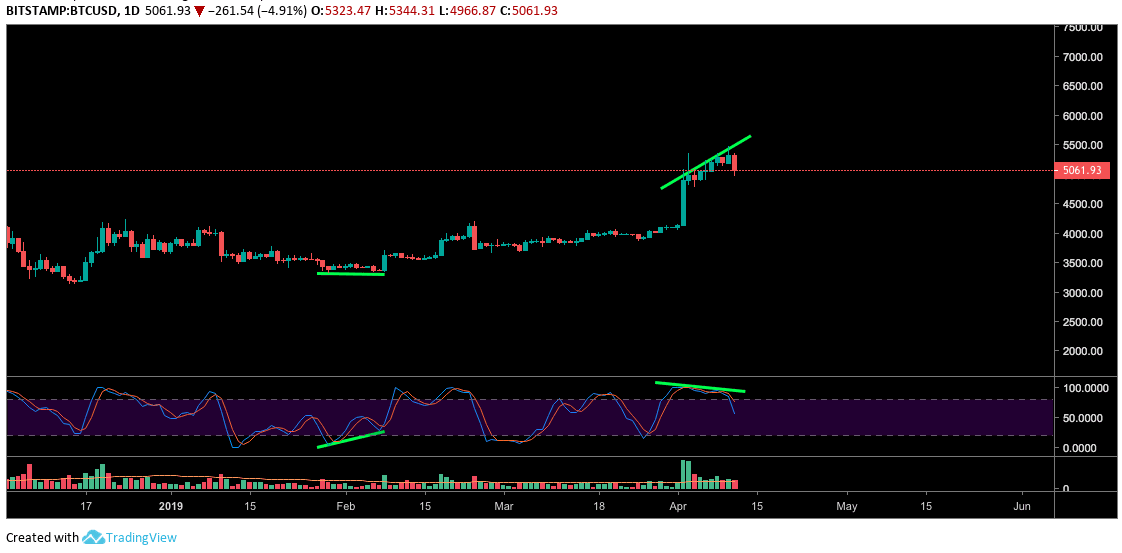
As with several indicators, traders sometimes can use the Stoch RSI to spot divergences between the indicator and price, gauging underlying momentum. Such divergences sometimes can lead to a change in price direction.
Traders may, at times, also find it useful to recognize how the two Stoch RSI indicator lines interact as they cross over each other at varying points concerning price.
*This article, and its charts, contains opinions and interpretations from the author and should not be taken as any advice.