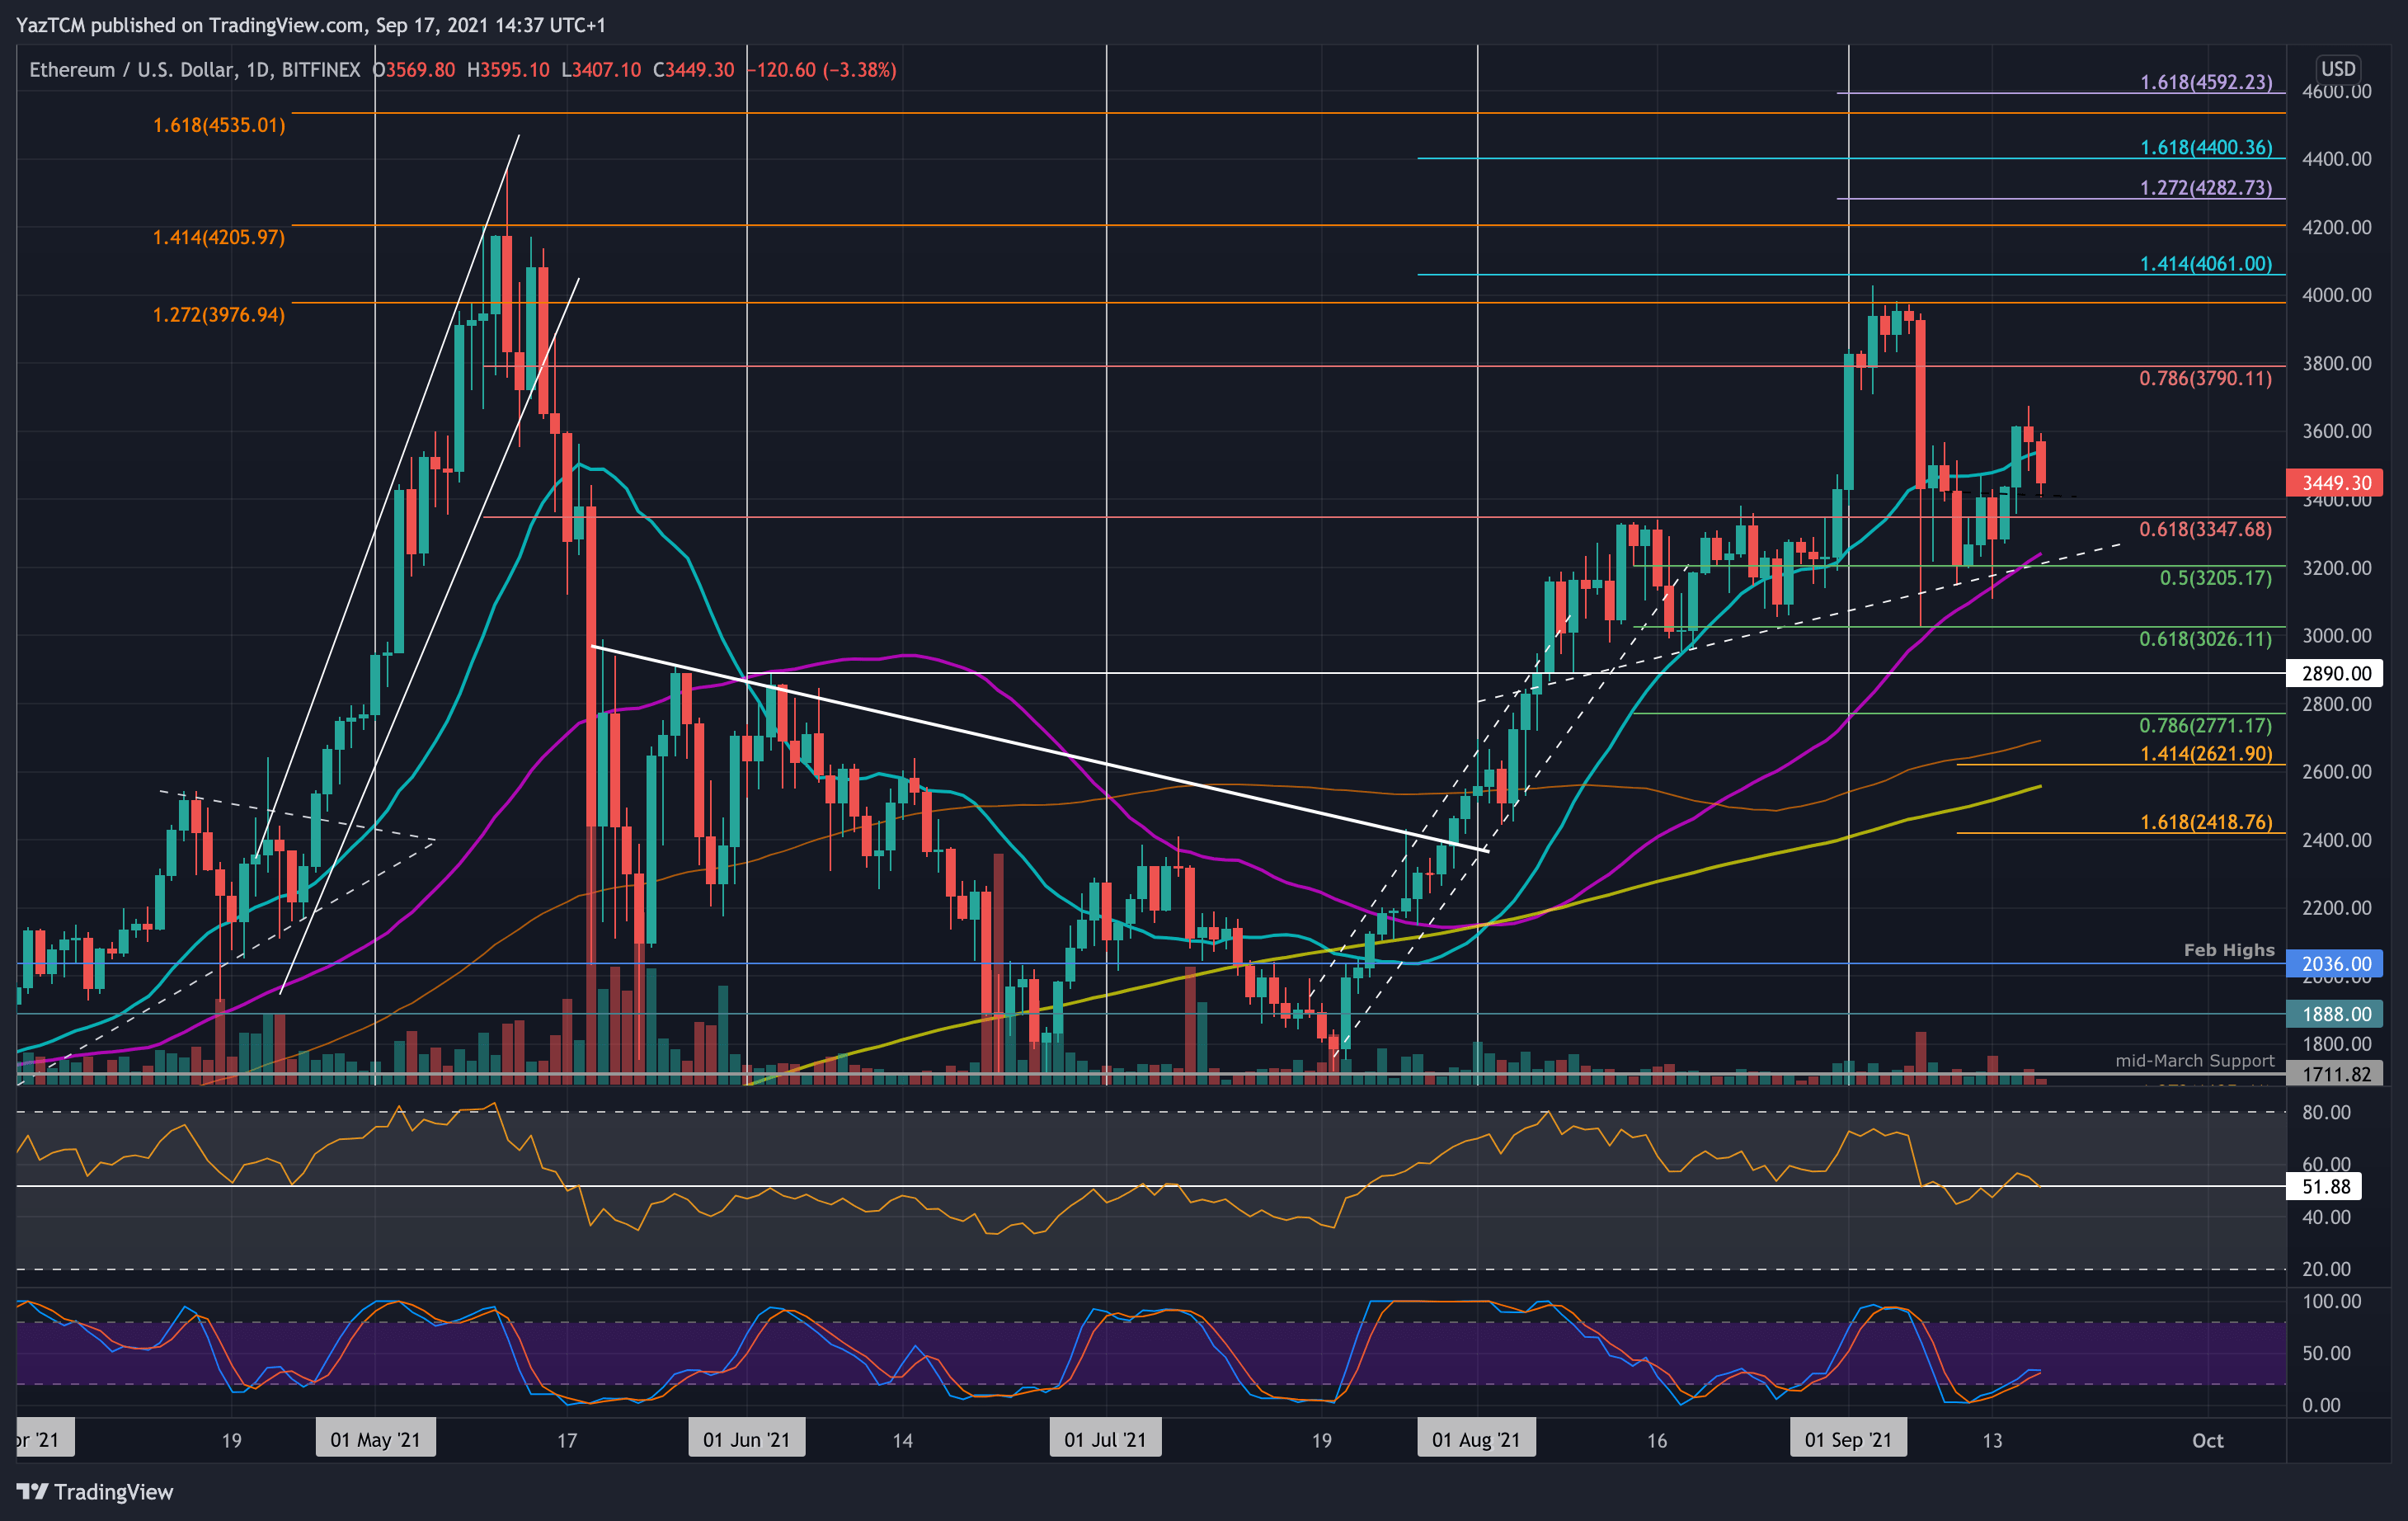
Ethereum is up by a small 1.2% over the past week of trading as the cryptocurrency currently sits at around $3450. The coin reached support at $3205 (.5 Fib) last Friday and started to rebound higher from there. The support at $3200 was further bolstered by a rising trend line that extends back to August.
On Wednesday, ETH managed to break the 20-day MA level again as it surged to $3600. Unfortunately, it could not close a daily candle above $3600 and ended up falling back beneath the 20-day MA level today.
Looking ahead, the first solid support lies at $3400. This is followed by $3350 (August resistance), $3200 (50-day MA & .5 Fib), $3000 (.618 Fib), and $2890 (August support).
On the other side, the first resistance lies at $3525 (20-day MA). This is followed by $3600, $3790 (bearish .786 Fib), and $3975 (September resistance & 1.272 Fib Extension). Beyond $4000, added resistance lies at $4060 and $4200.
ETH is also in a similar situation against BTC as it dropped beneath the 20-day MA level again today. The coin found support at 0.0711 BTC (.382 Fib & 20-day MA) last Friday and started to rebound from there. On Wednesday, ETH managed to break the 20-day MA and push higher to 0.076 BTC yesterday.
Unfortunately, it could not overcome the resistance at 0.076 BTC yesterday and has since dropped beneath the 20-day MA at 0.074 BTC to the current 0.0728 BTC level. It is currently being supported by a September ascending trend line.
Looking ahead, the first support lies at the trend line. This is followed by 0.072 BTC, 0.0711 BTC (.382 Fib), 0.07 BTC (50-day MA) and 0.0691 BTC.
On the other side, the first resistance lies at 0.074 BTC (20-day MA). This is followed by 0.076 BTC, 0.0765 BTC (beraish .786 Fib), and 0.0787 BTC.
XRP is down a small 1.8% this week as it currently trades at around $1.06. The cryptocurrency has established a range between $1.14 and $1.05 over the past ten days and must break this range to dictate the next direction for the market.
The support of the range is provided by a .5 Fib and a 50-day MA.
Looking ahead, if the sellers break the lower boundary of the range at $1.05, the first support lies at $1.00. This is followed by $0.95 (.618 Fib), $0.92 (200-day MA), $0.86 (100-day MA), and $0.8282 (2020 highs).
On the other side, the first resistance lies at $1.15 (20-day MA & upper boundary of the range). This is followed by $1.25 (Feb 2018 highs), $1.30, $1.36 (1.618 Fib Extension), and $1.40.
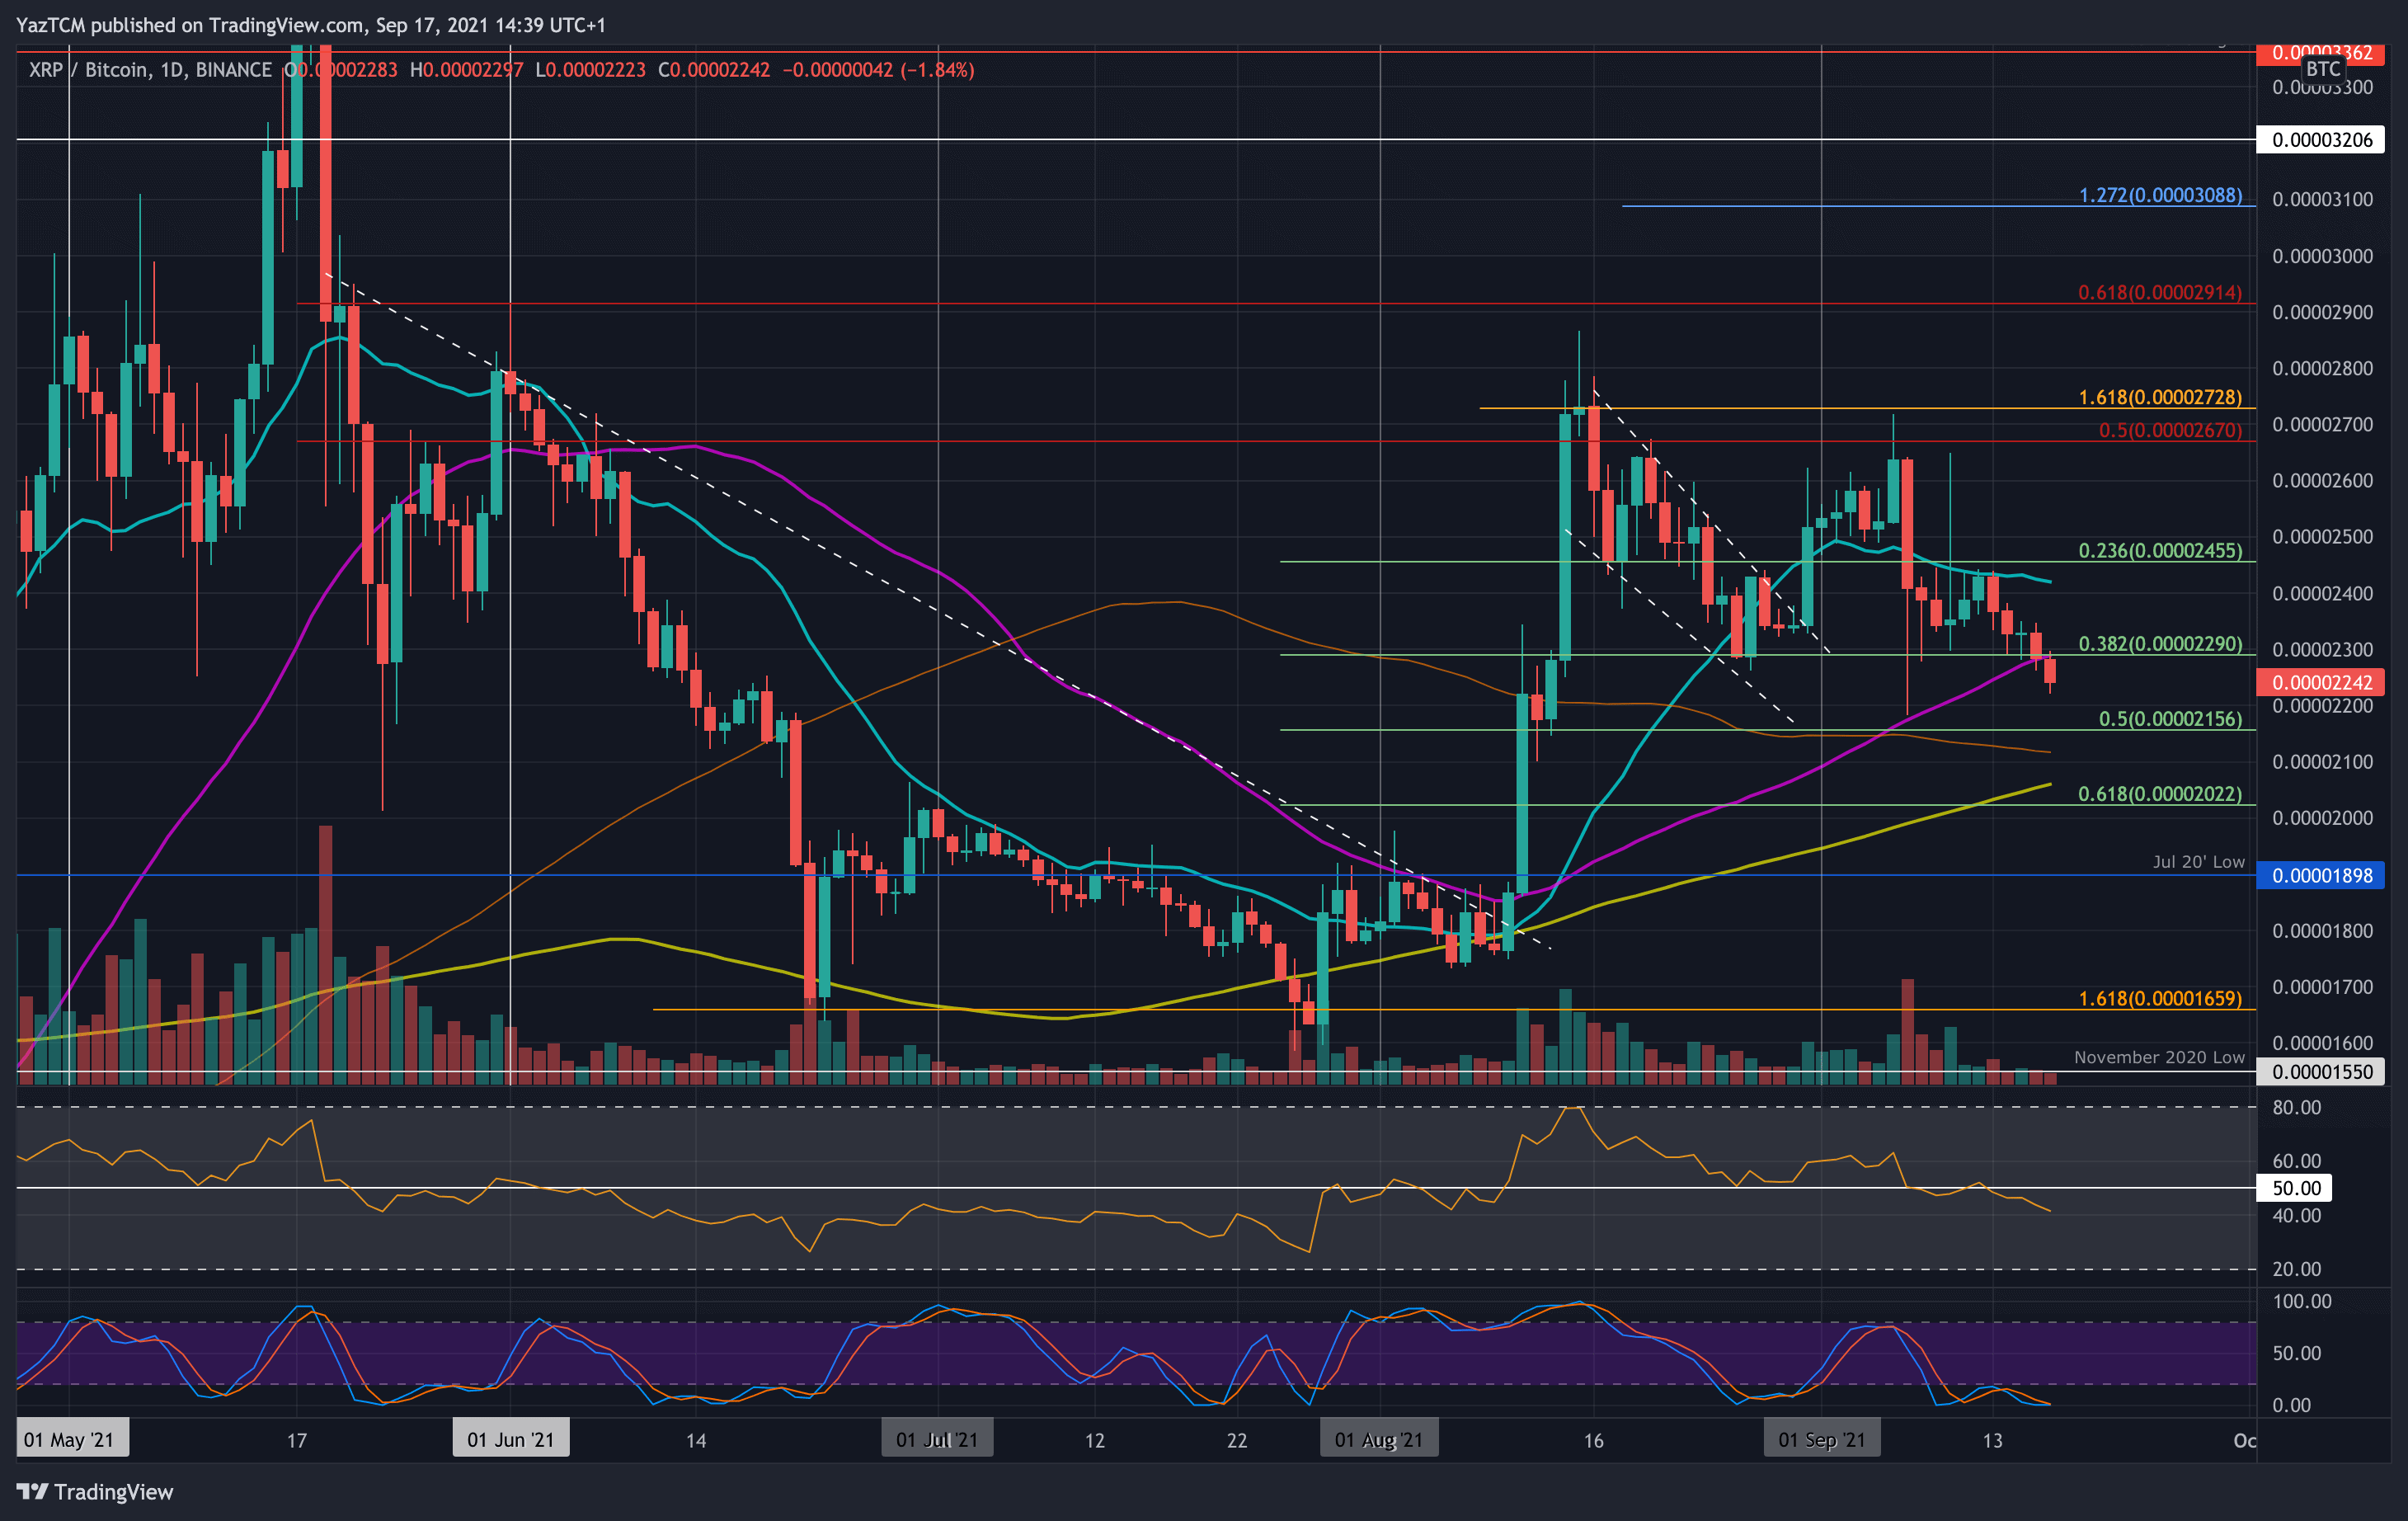
It is also struggling against BTC as it falls beneath the 50-day MA level today. The coin did try and push higher at the start of the week as it surged above 2400 SAT to hit 2450 SAT. There, it found resistance at the 20-day MA and reversed from the level.
XRP would fall throughout the week until support was found at 2290 SAT (.382 Fib & 50-day MA) yesterday. The bears pushed beneath this support today to hit 2240 SAT.
Looking ahead, the first support lies at 2200 SAT. This is followed by 2155 SAT (.5 Fib), 2100 SAT (100-day MA), 2050 SAT (200-day MA), and 2000 SAT (.618 Fib).
On the other side, the first resistance lies at 2300 SAT (50-day MA). This is followed by 2400 SAT (20-day MA), 2500 SAT, 2670 SAT (bearish .5 Fib), and 2230 SAT (1.618 Fib Extension).
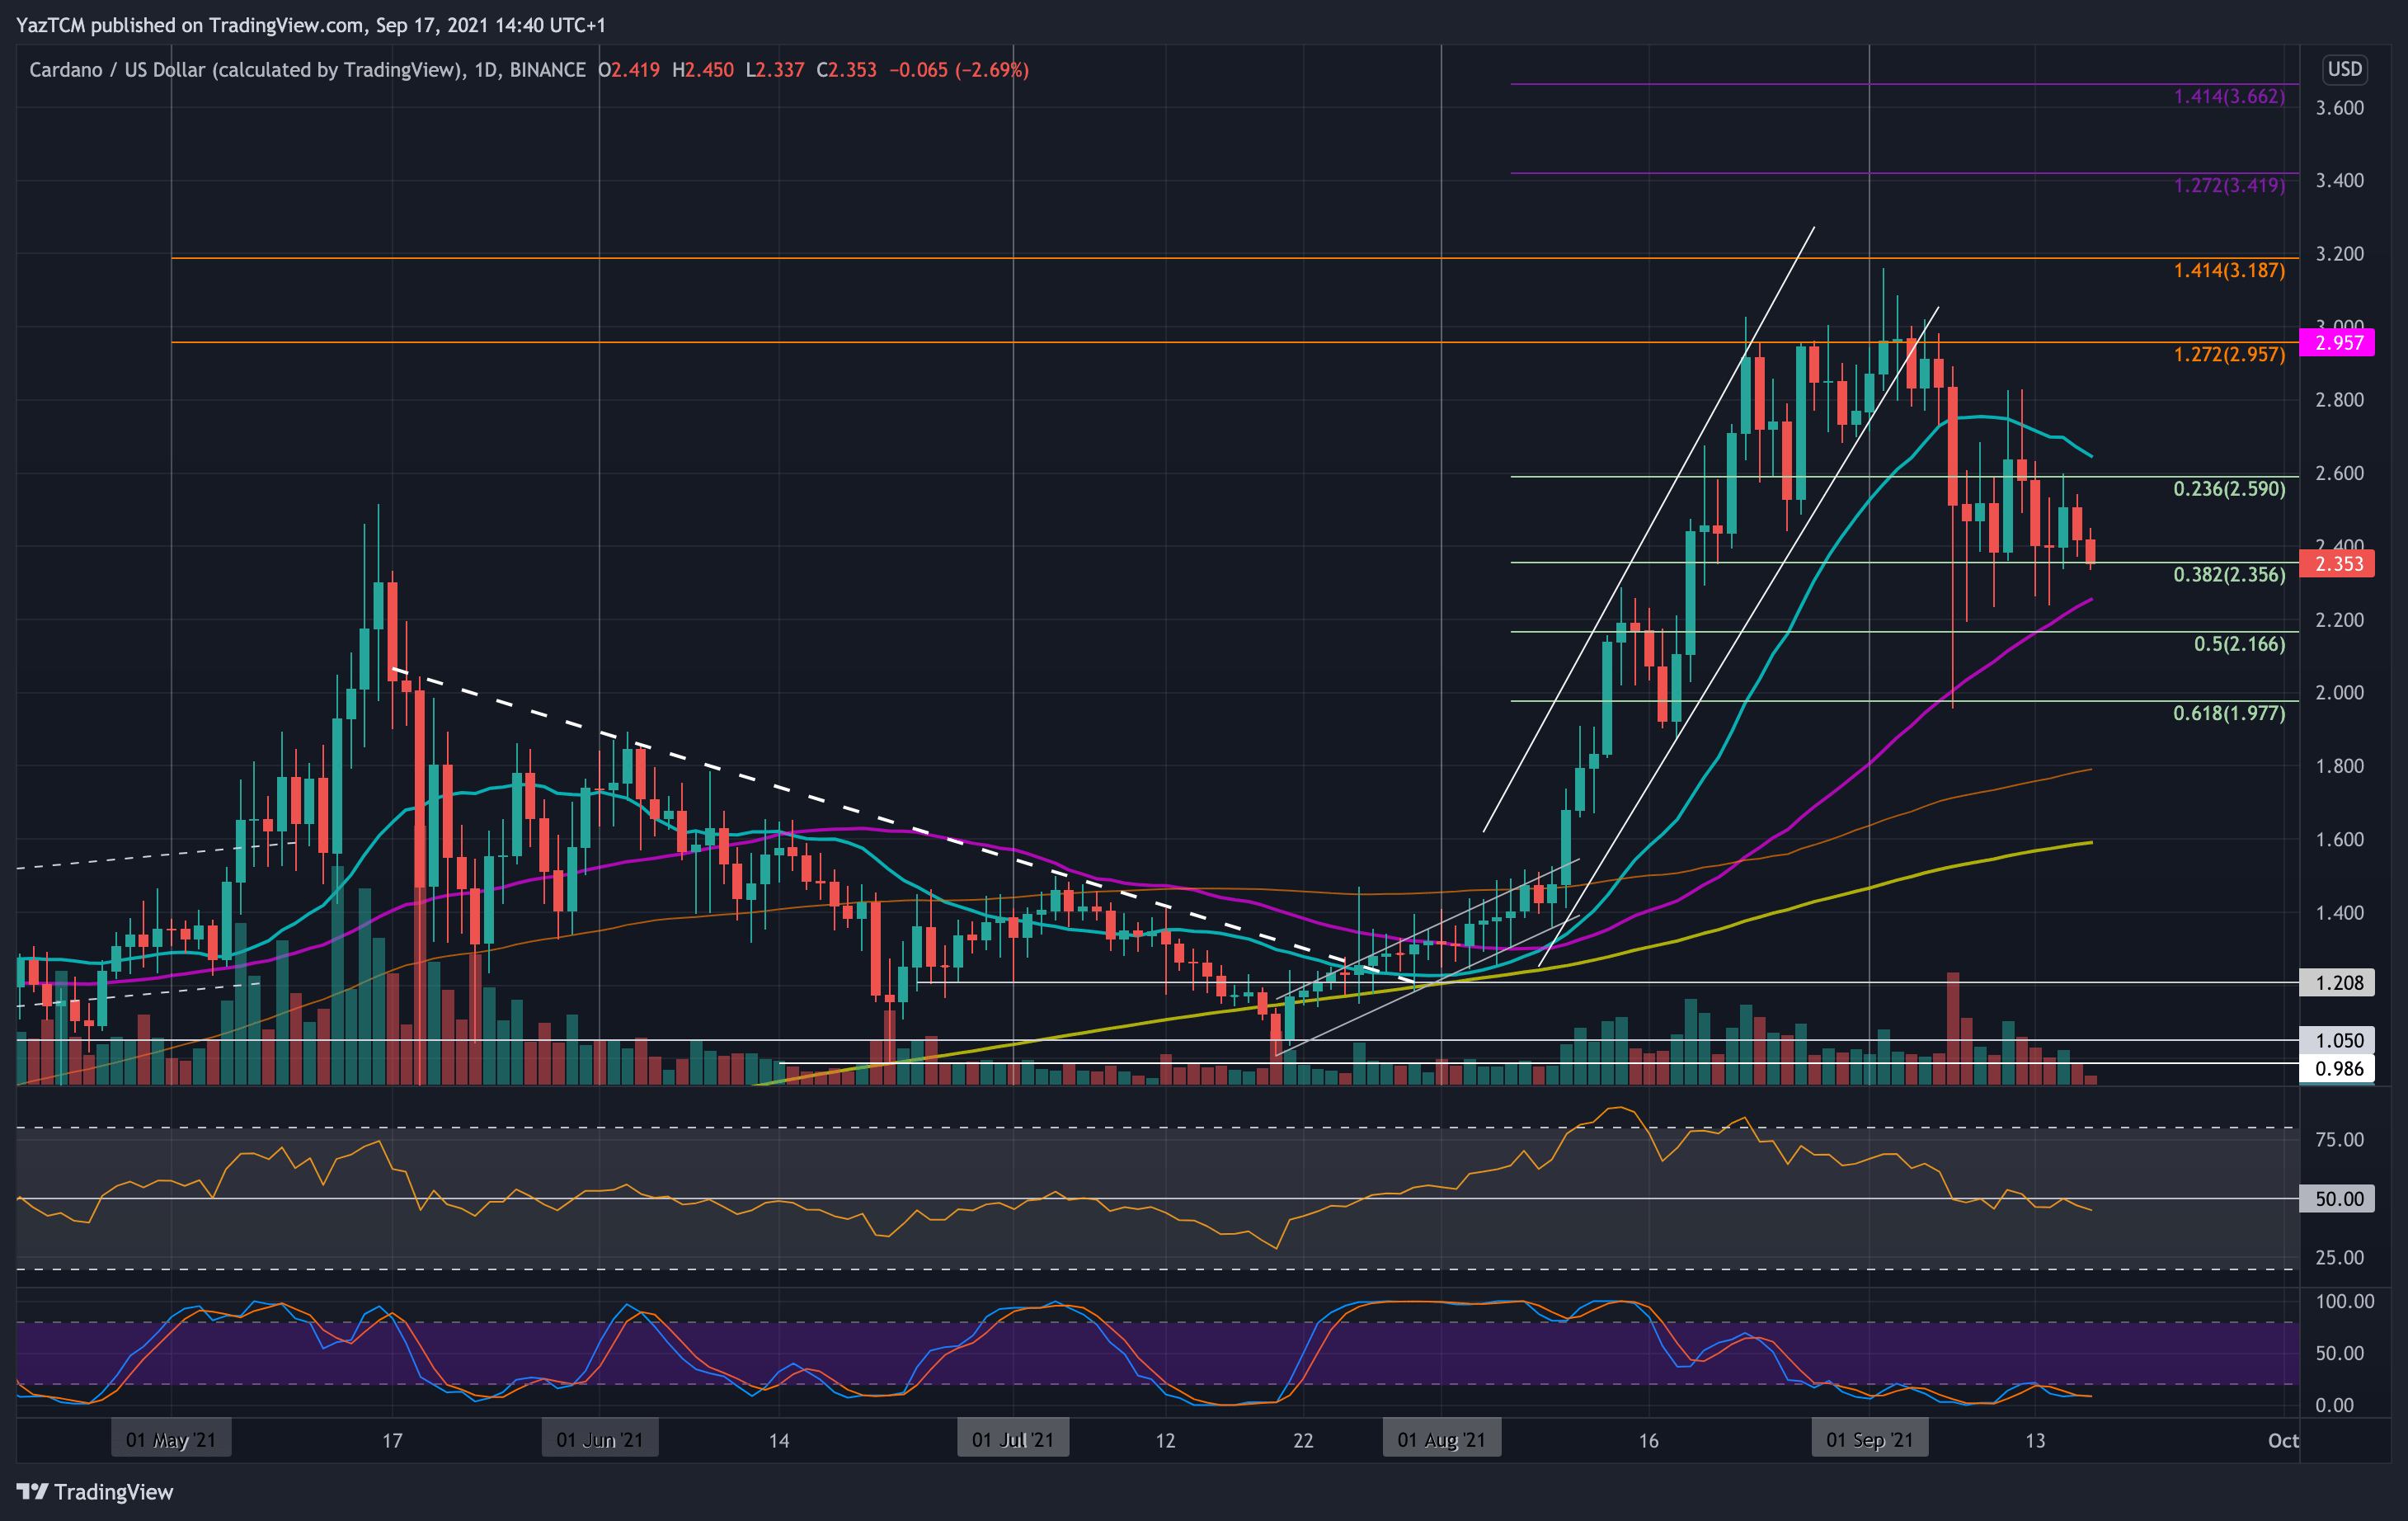
ADA is down by 5.5% over the course of the week as it currently trades at the $2.35 support (.382 Fib Retracement). The coin was trading at this support last week and did attempt to surge higher but could not overcome resistance at $2.8- during the week.
It is now pretty much locked in a range between $2.60 and $2.35 and must break this range to dictate the next direction for the market.
If the sellers break $2.35, the first support is expected at $2.25 (50-day MA). This is followed by $2.16 (.5 Fib), $2.00 (.618 Fib), and $1.80 (100-day MA).
On the other side, the first resistance lies at $2.50. This is followed by $2.64 (20-day MA), $2.80, $2.96 (1.272 Fib Extension), and $3.00.
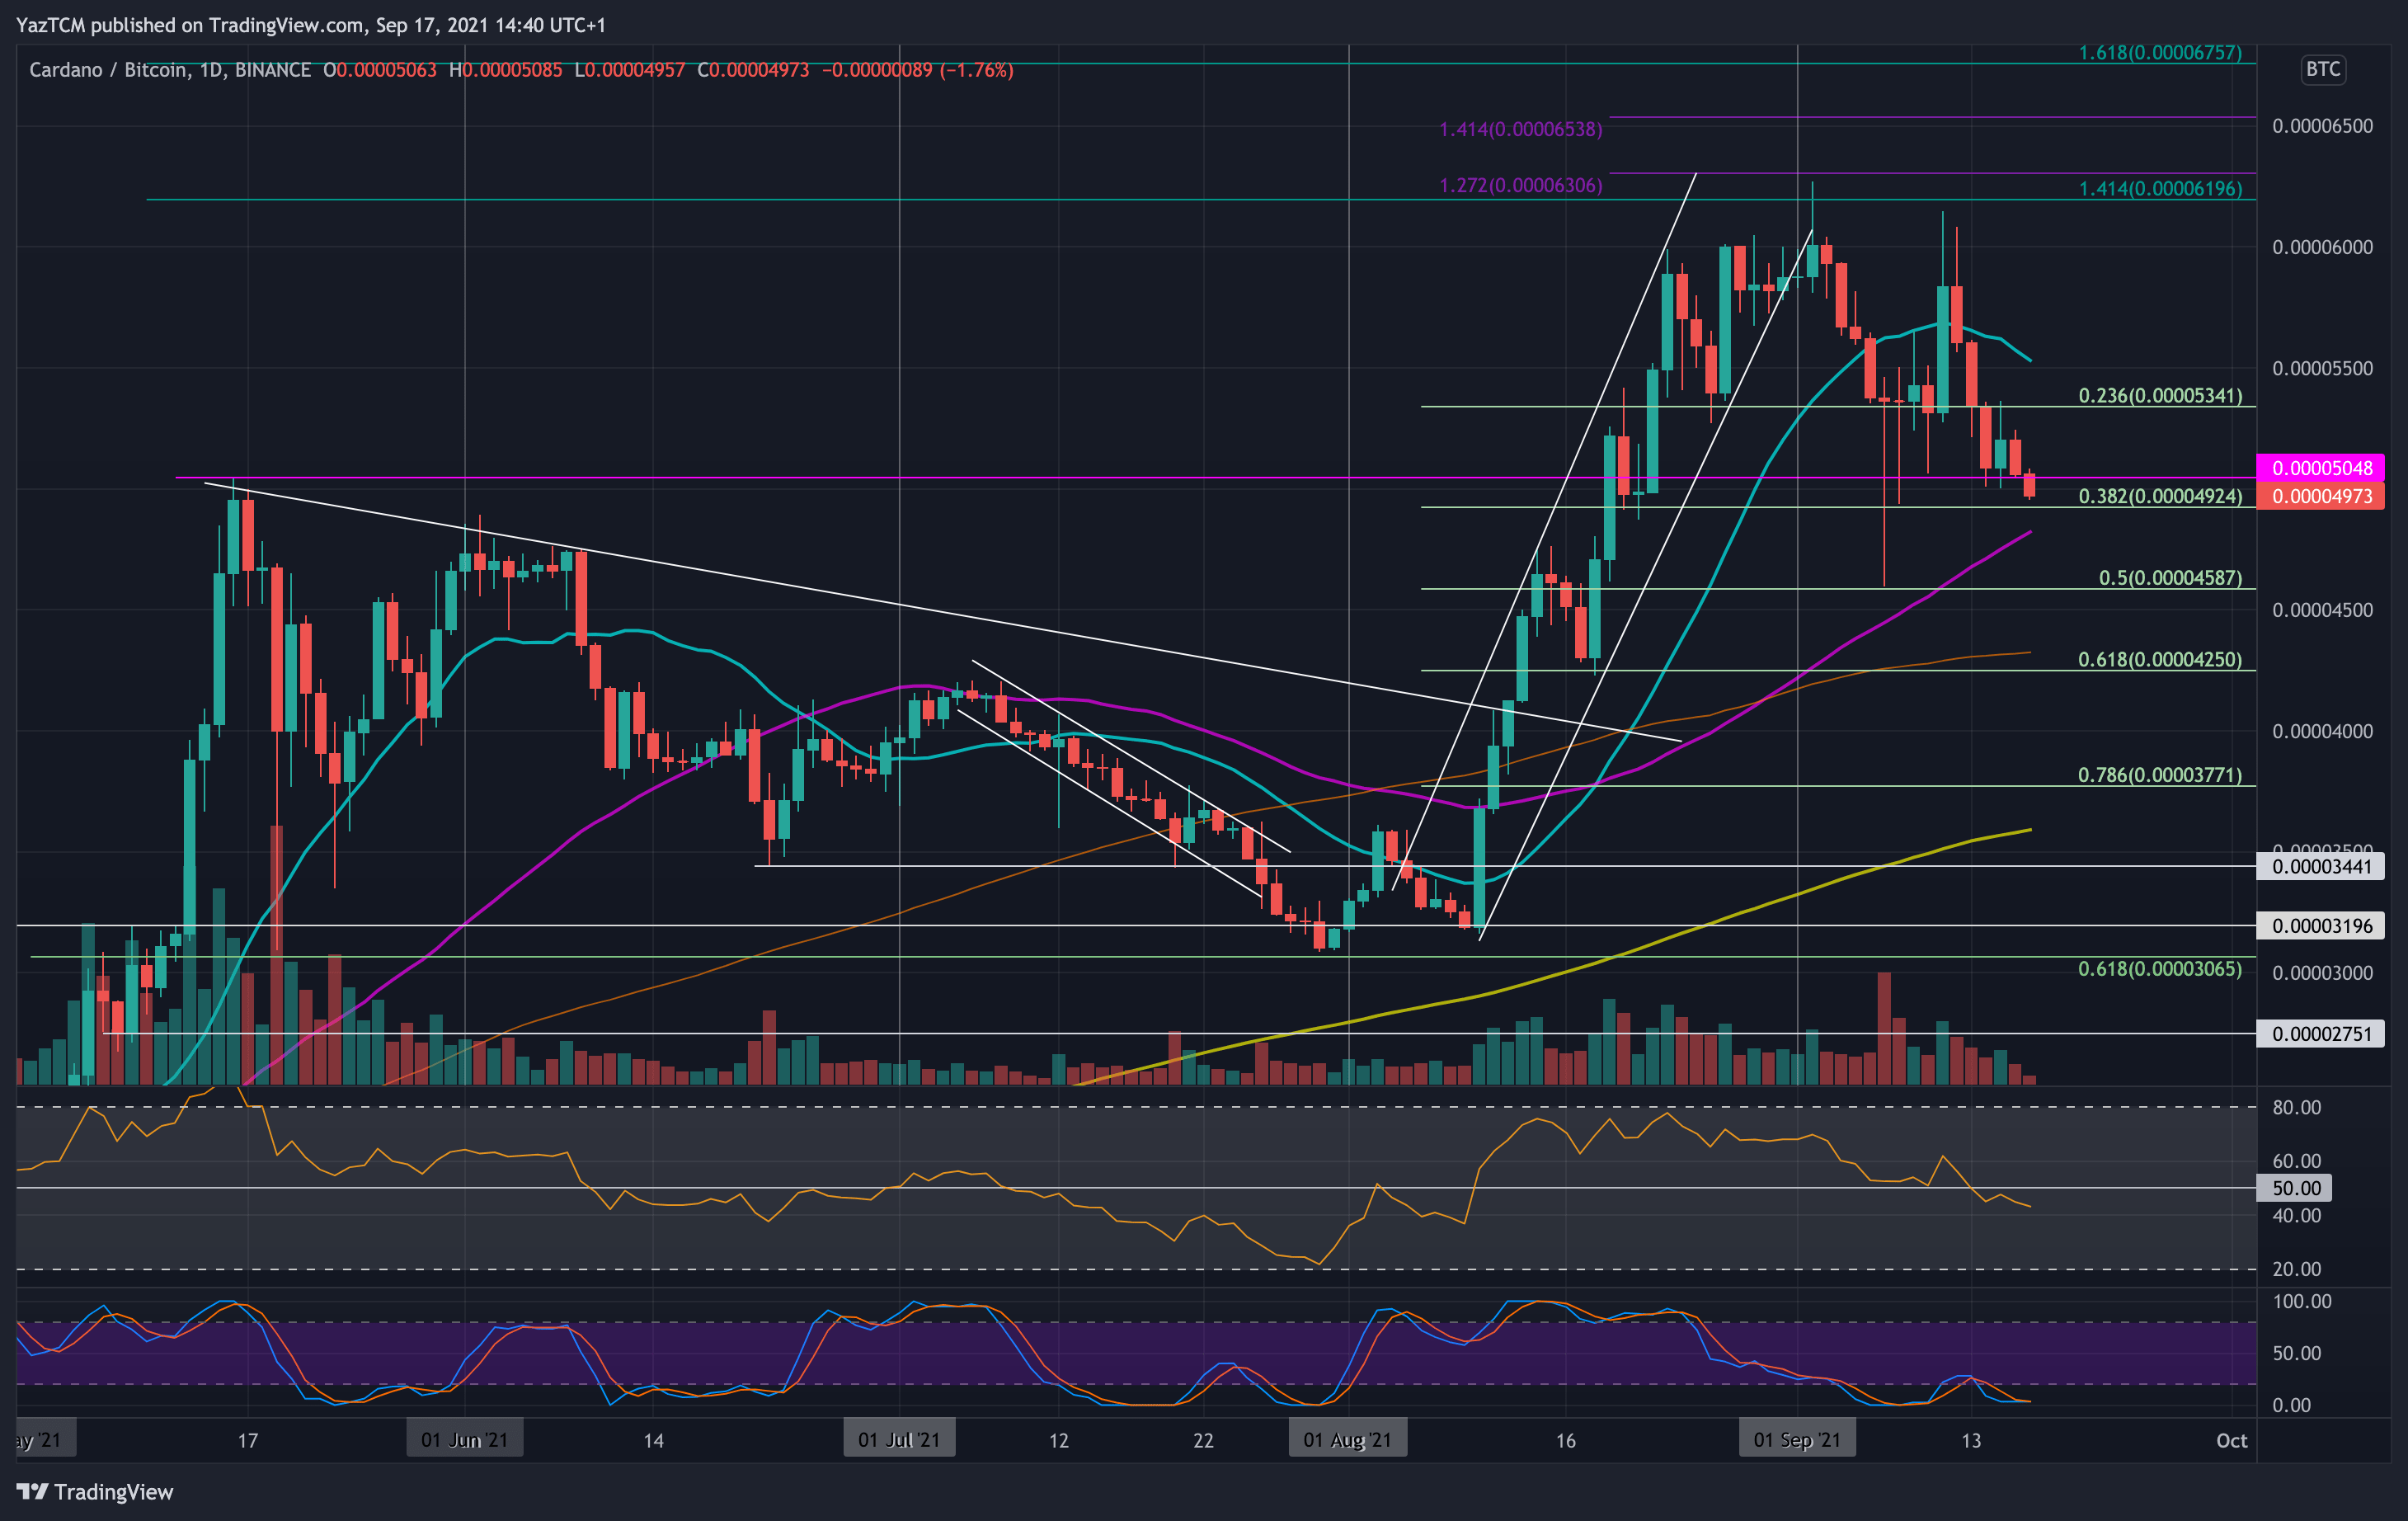
ADA is also struggling against BTC as it breaks beneath the 5000 SAT support today. The coin had reached 5340 SAT (.236 Fib) support last Friday and rebounded higher from there over the weekend. Unfortunately, it could not break resistance at 6000 SAT and ended up rolling over from there as the week progressed.
By Tuesday, ADA broke beneath the 5340 SAT support and continued into 5000 SAT, which was finally breached today.
Looking ahead, if the sellers continue lower, the first support lies at 4925 SAT (.382 Fib). This is followed by 4825 SAT (50-day MA), 4590 SAT (.5 Fib), and 4250 SAT (.618 Fib & 100-day MA).
On the other side, the first resistance lies at 5000 SAT. This is followed by 5340 SAT, 5500 SAT (20-day MA), 6000 SAT, and 6200 SAT (1.414 Fib Extension).
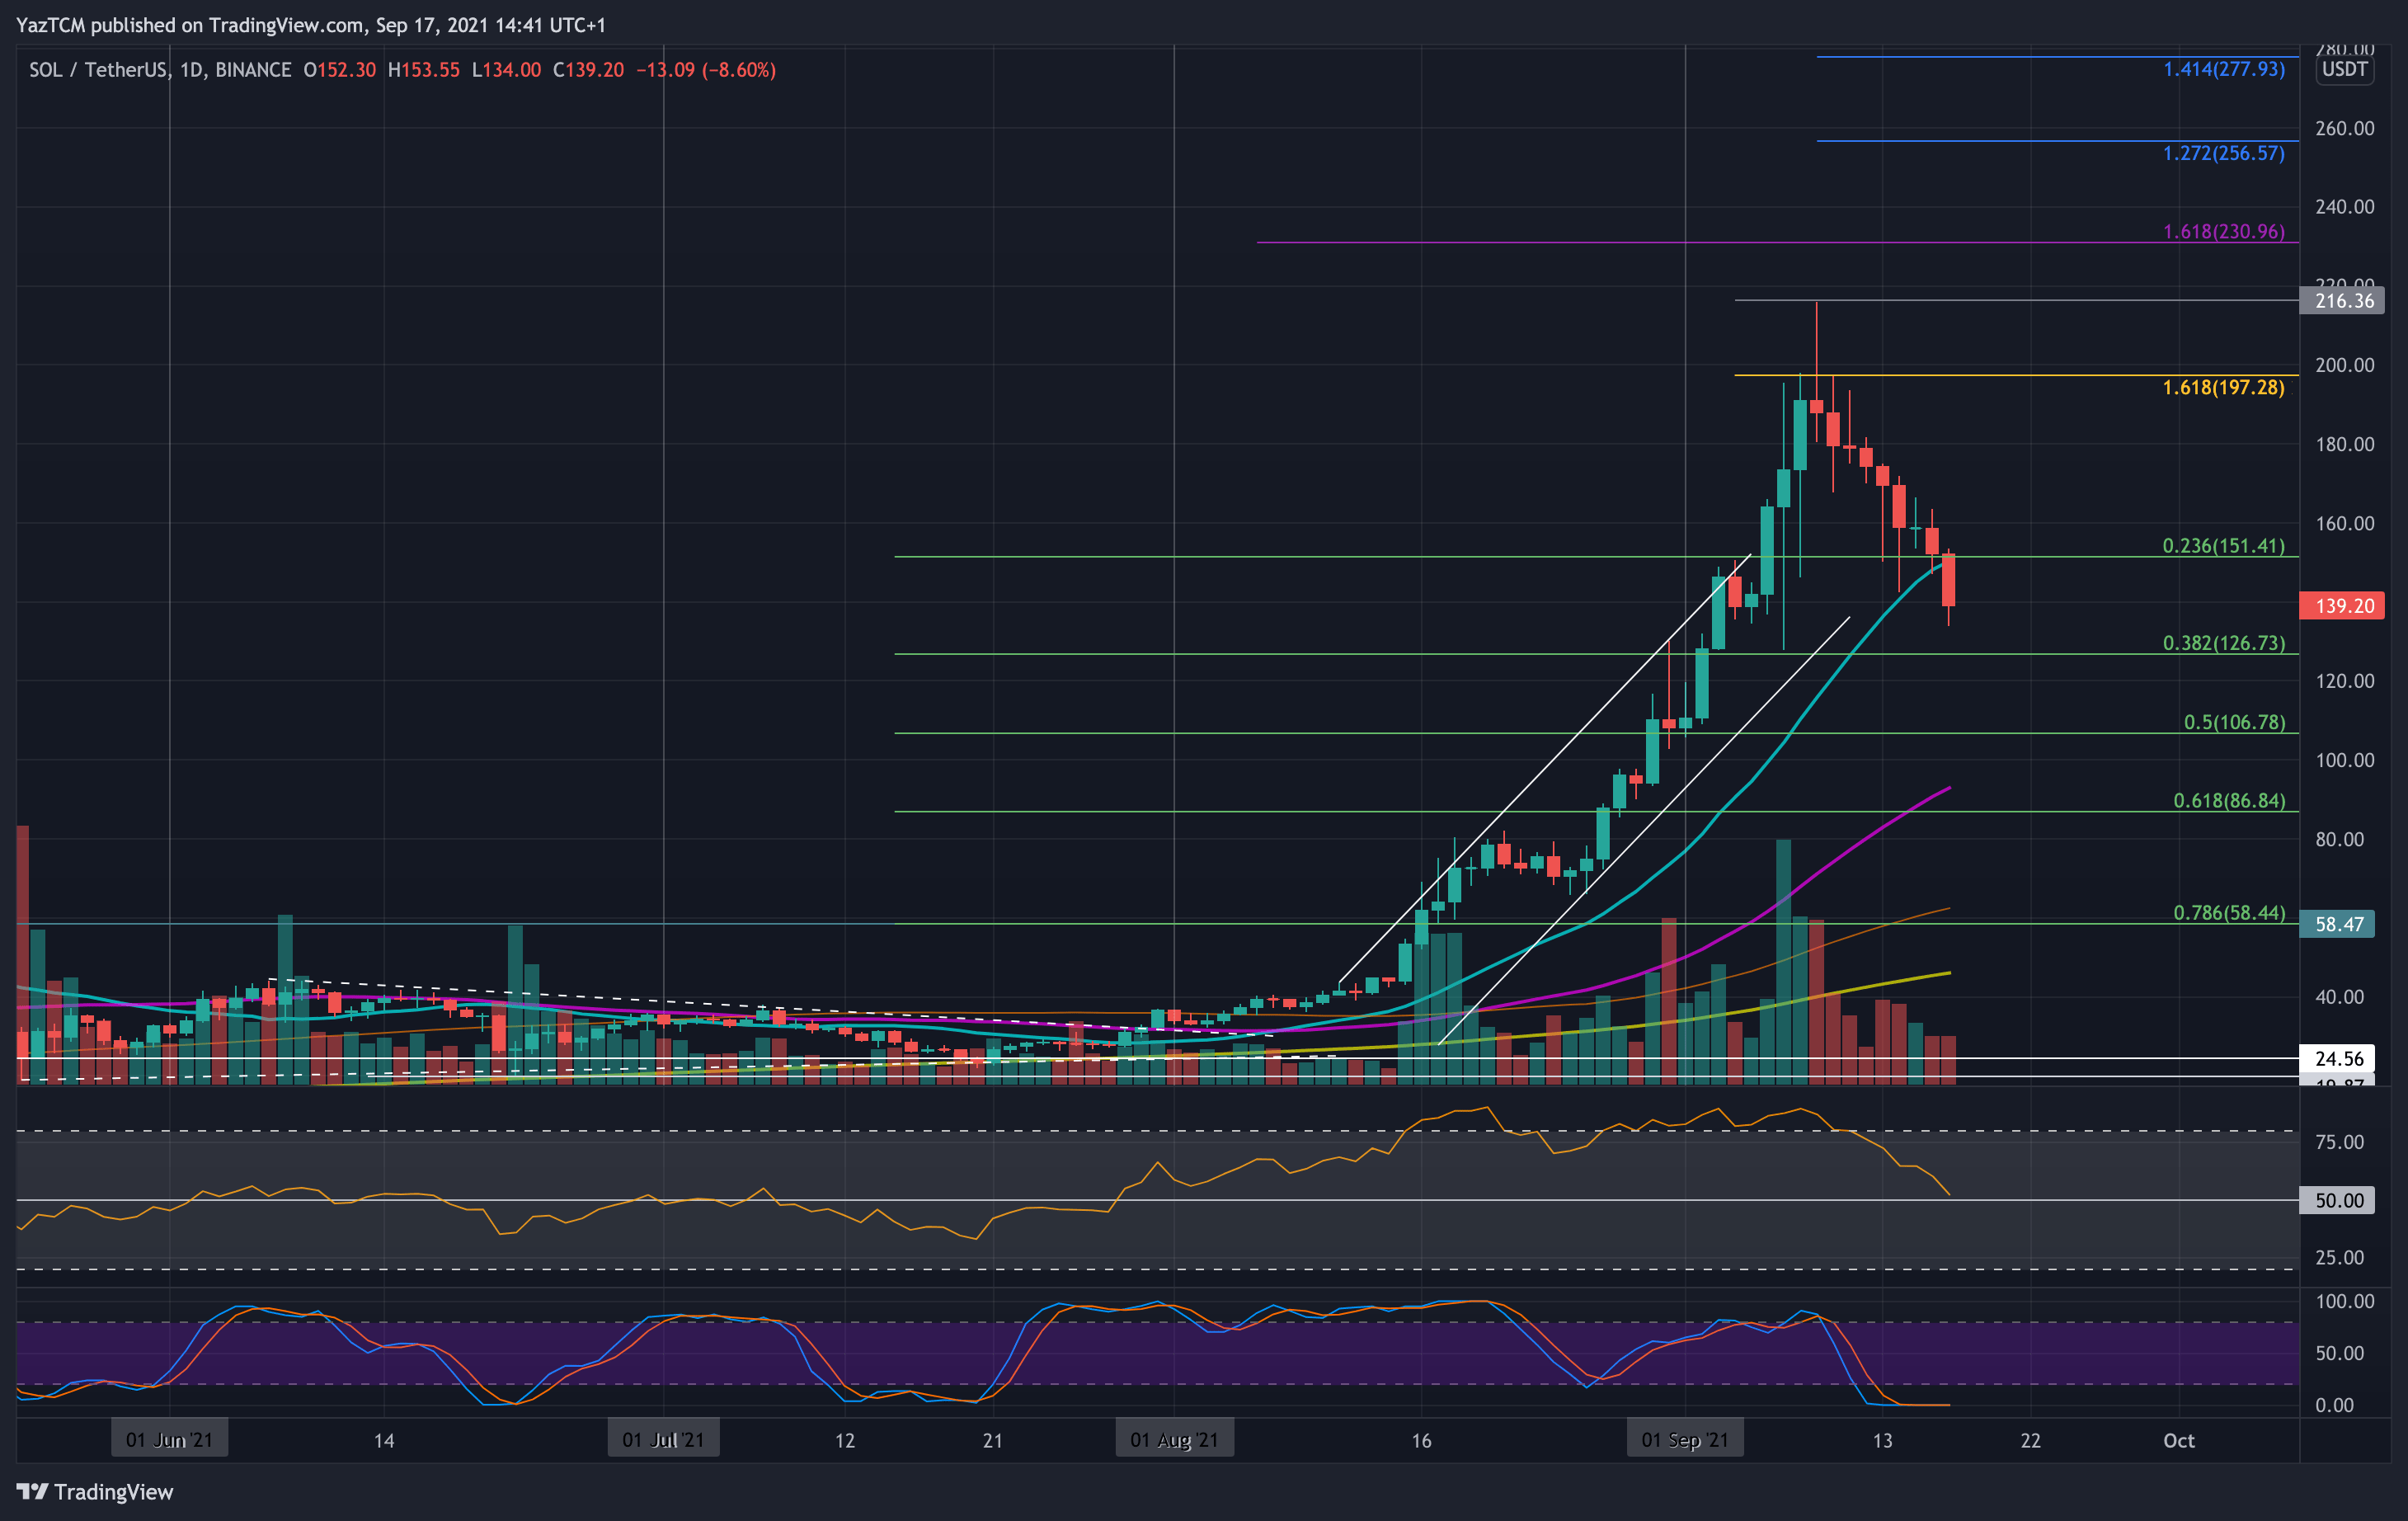
SOL is down by a strong 23.5% over the past week as it currently sits at around $139. The cryptocurrency had been on an incredible monthly run and is still up 105% on the month, despite the recent price drop.
It managed to reach as high as $216 at the start of September but has been in a retracement period ever since. Throughout the week, SOL managed to develop support at $151 (.236 Fib). However, the sellers broke beneath this support today as they broke beneath the 20-day MA to reach the current $139 level.
Looking ahead, the first support lies at $126 (.382 Fib). This is followed by $120, $106 (.5 Fib), $100, and $90 (50-day MA).
On the other side, the first resistance lies at $151 (20-day MA). This is followed by $160, $180, $200, and $216.
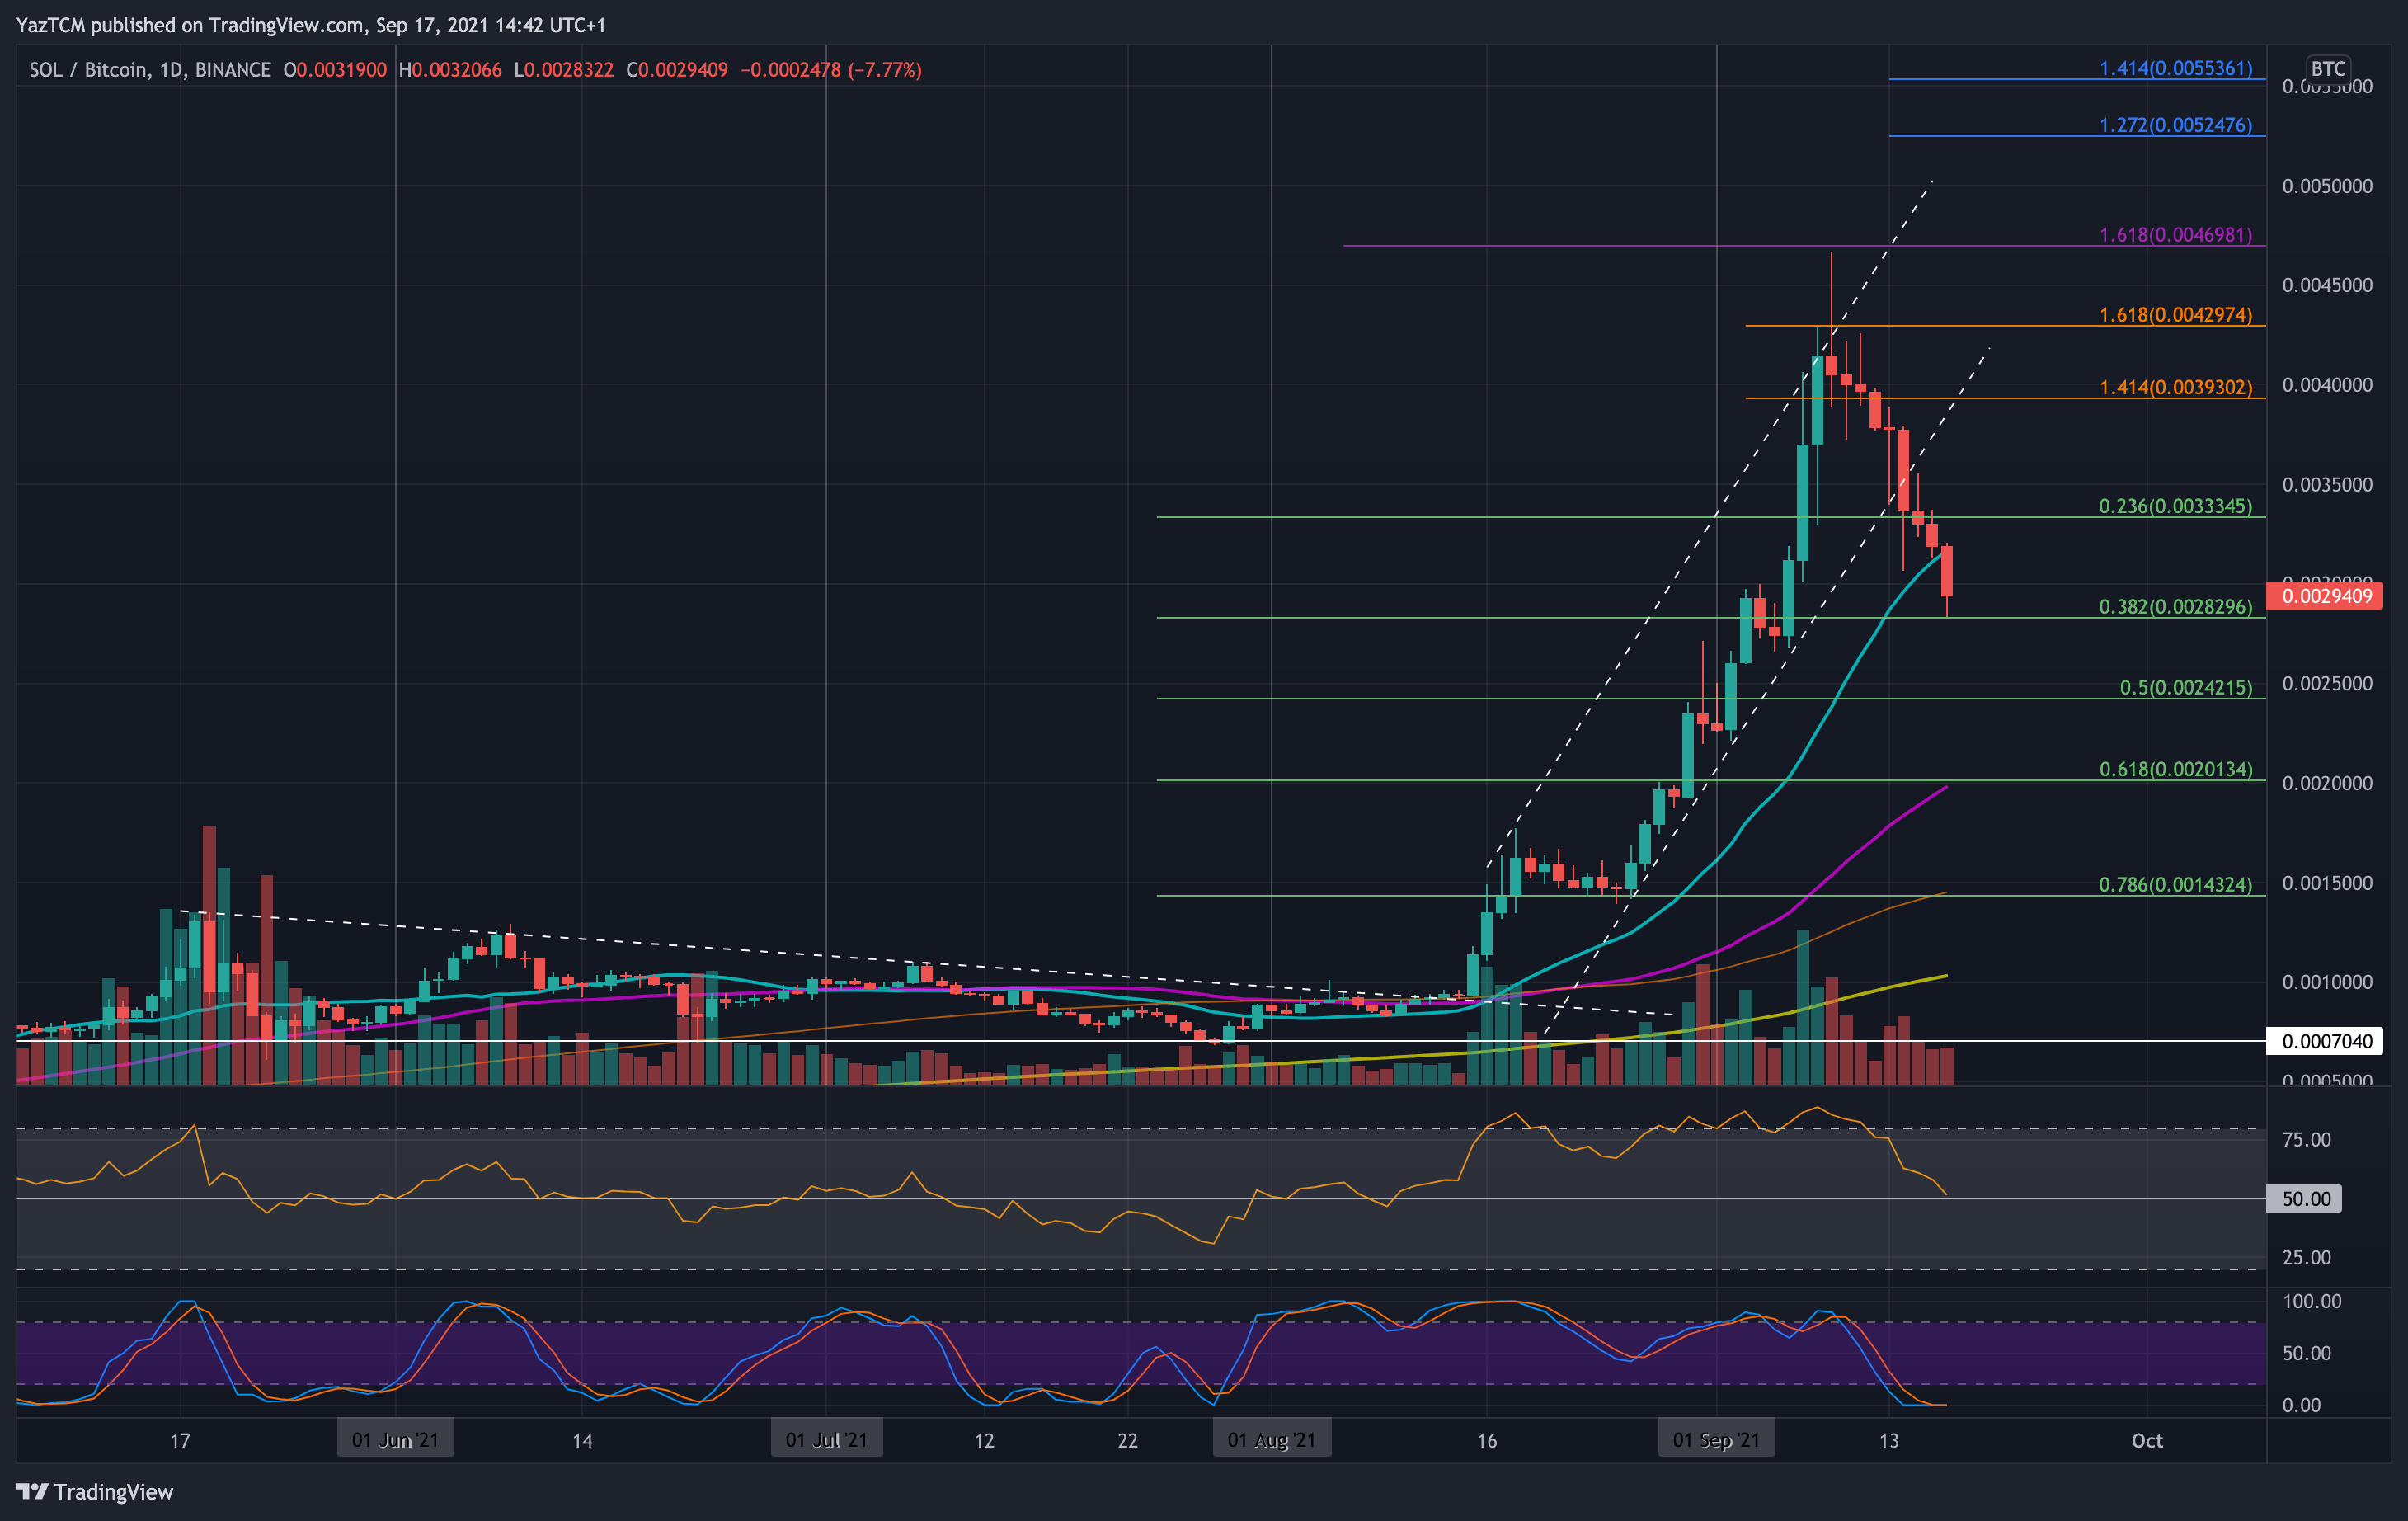
SOL is also in a retracement period against BTC as it currently sits at 0.00294 BTC. The coin was trading inside an ascending price channel since mid-August, which allowed it to reach as high as 0.0046 BTC at the start of September.
This week, SOL eventually fell beneath the ascending price channel on Tuesday to find support at 0.0033 BTC (.236 Fib). Yesterday, SOL continued below 0.0033 BTC to find the 20-day MA support at 0.0314 BTC. Today, SOL broke the 20-day MA and fell beneath 0.003 BTC to find the support at 0.00282 BTC (.382 Fib).
Looking ahead, if the bears break 0.00282 BTC, the first support lies at 0.0025 BTC. This is followed by 0.00242 BTC (.5 Fib), 0.002 BTC (618 Fib & 50-day MA), and 0.0019 BTC.
On the other side, the first resistance lies at 0.003 BTC. This is followed by 0.0033 BTC (20-day MA), 0.0035 BTC, 0.004 BTC (1.414 Fib Extension), and 0.00429 BTC (1.618 Fib Extension).
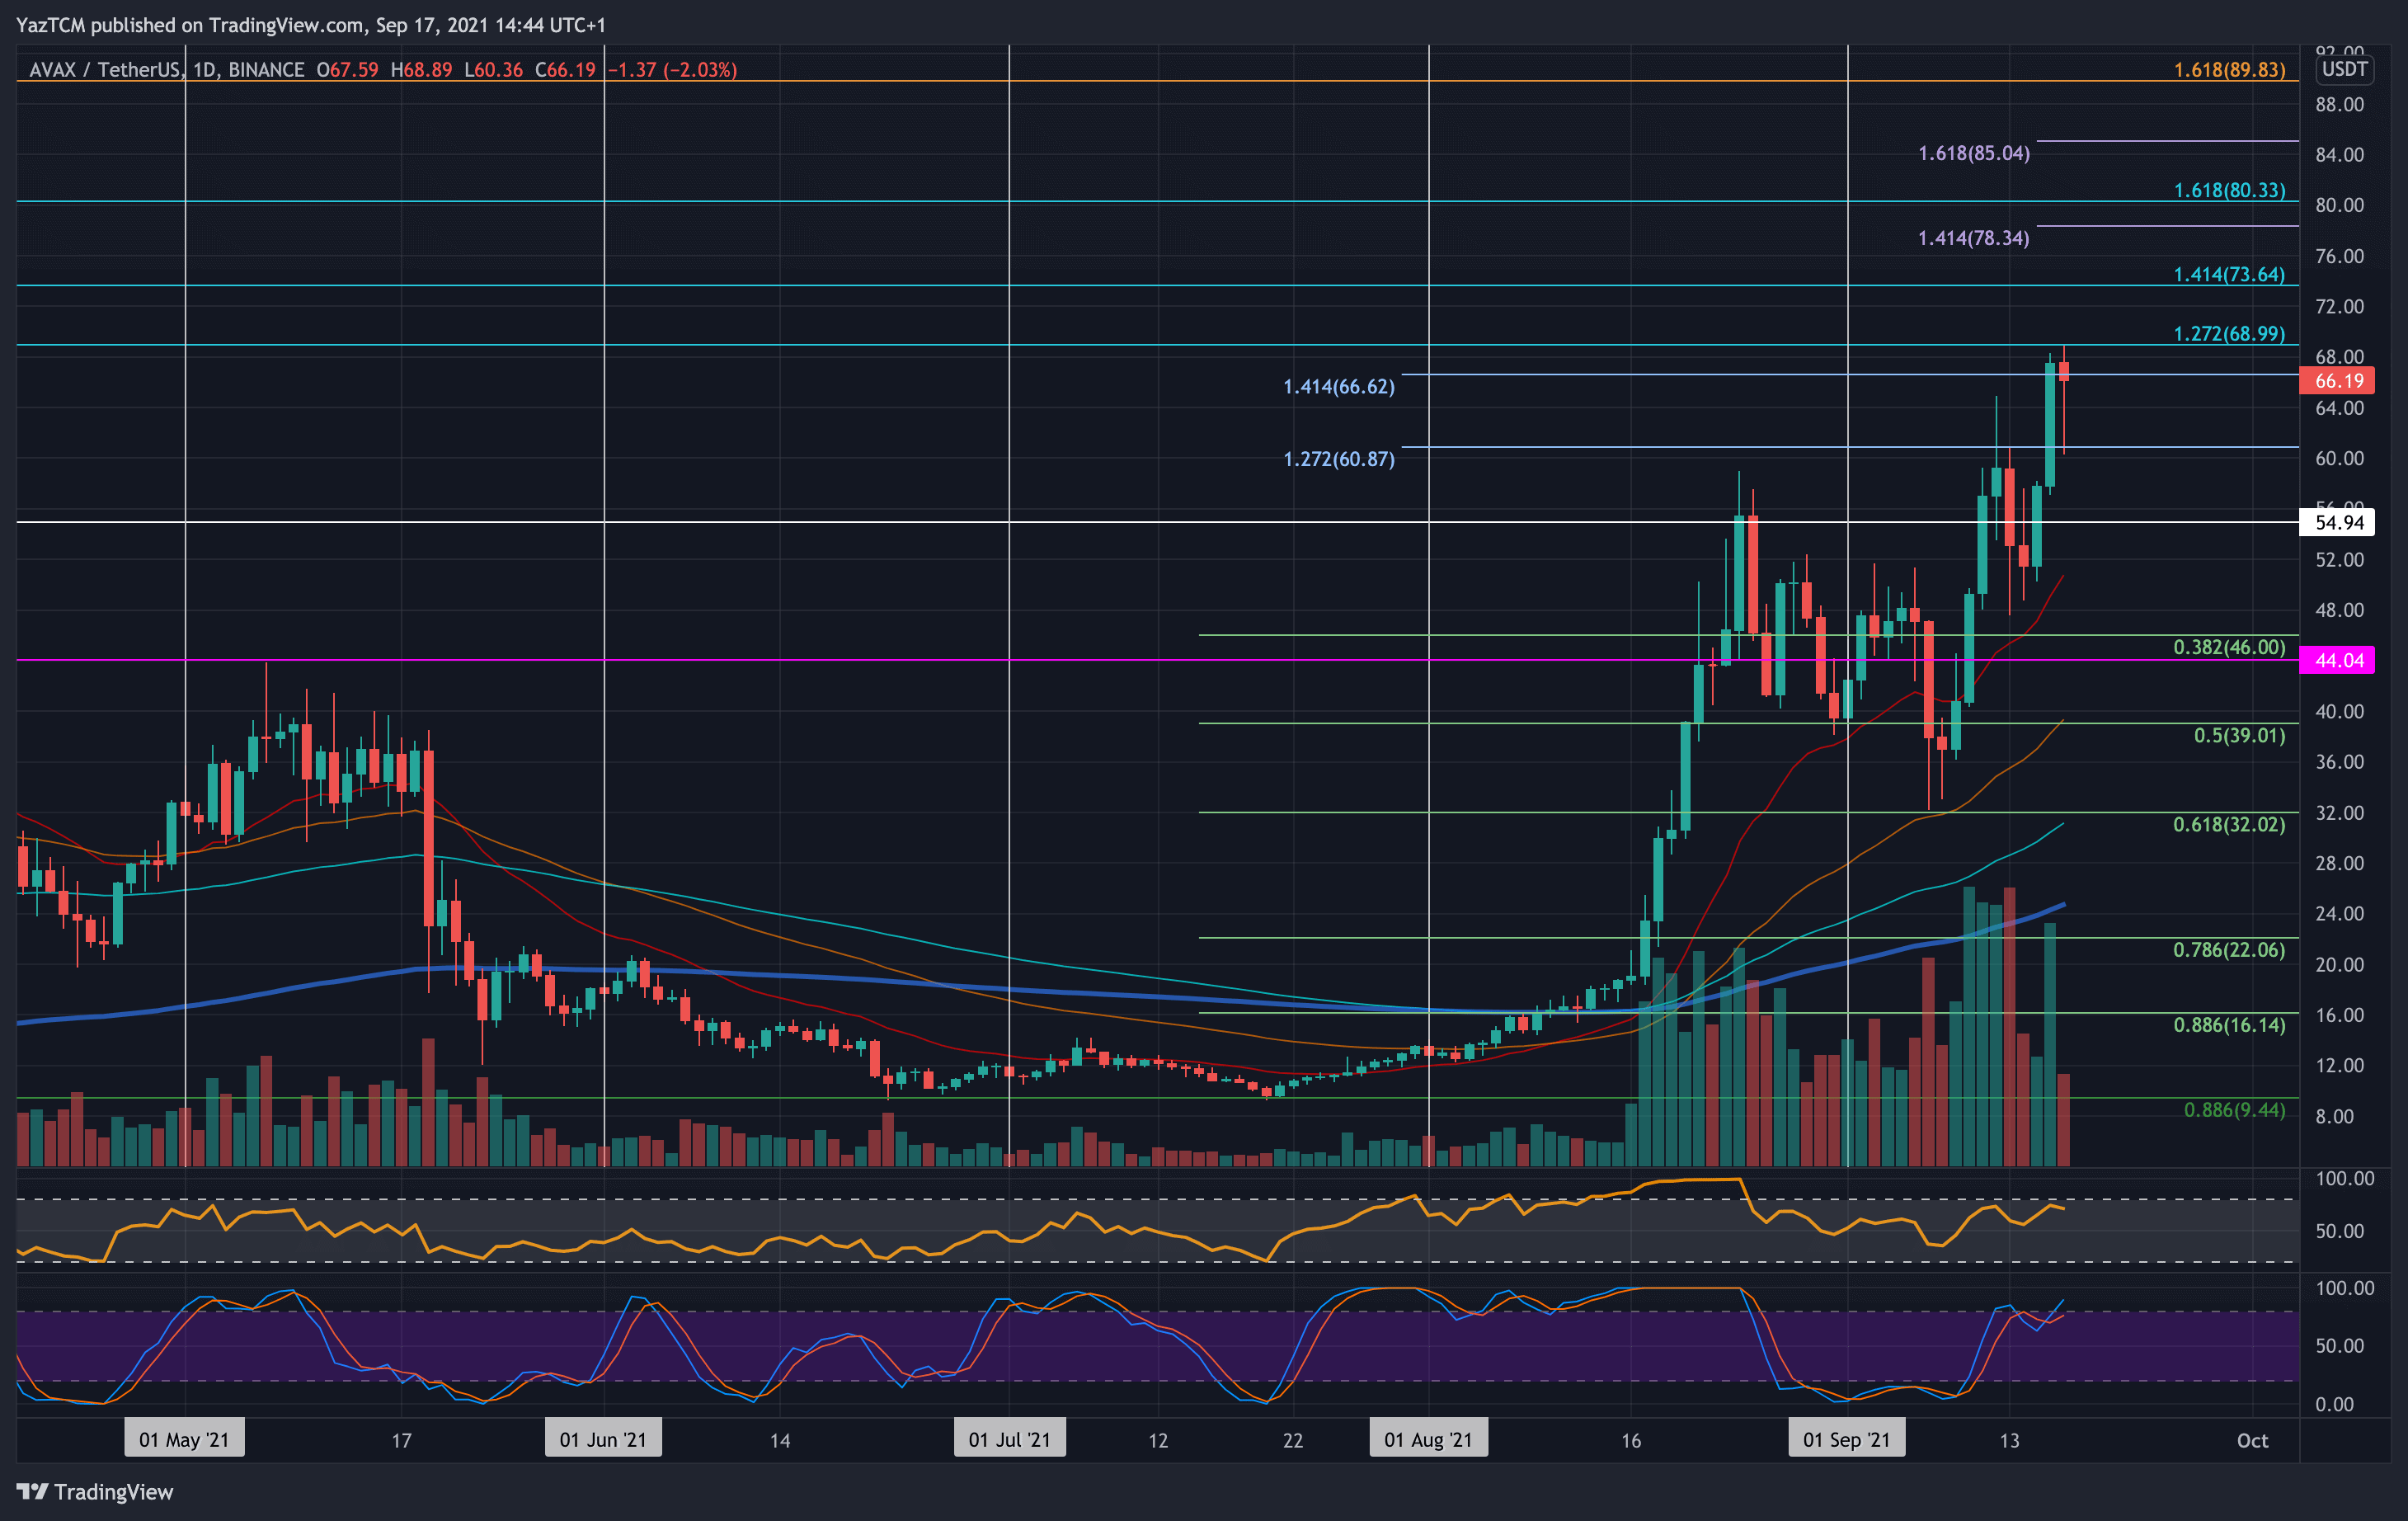
AVAX is up by an incredible 58% this week as the coin surges as high as $69 to put it in the 11th ranked position. It was trading at around $40 (20-day MA) last Friday as it started to surge higher. By the end of the weekend, AVAX had already managed to reach as high as $60.
After a brief retracement to $50, the cryptocurrency started to climb again on Wednesday. Yesterday, it surged past $60 and reached as high as $68. It continued today to reach resistance at $69 (1.272 Fib Extension) but has since dropped to $66.
Looking ahead, the first resistance beyond $69 (1.272 Fib Extension) lies at $73.65 (1.414 Fib Extension). This is followed by $78.35, $80 (1.618 Fib Extension), $85, and $90.
On the other side, the first support lies at $64. This is followed by $60, $55, $52 (20-day MA), and $48.
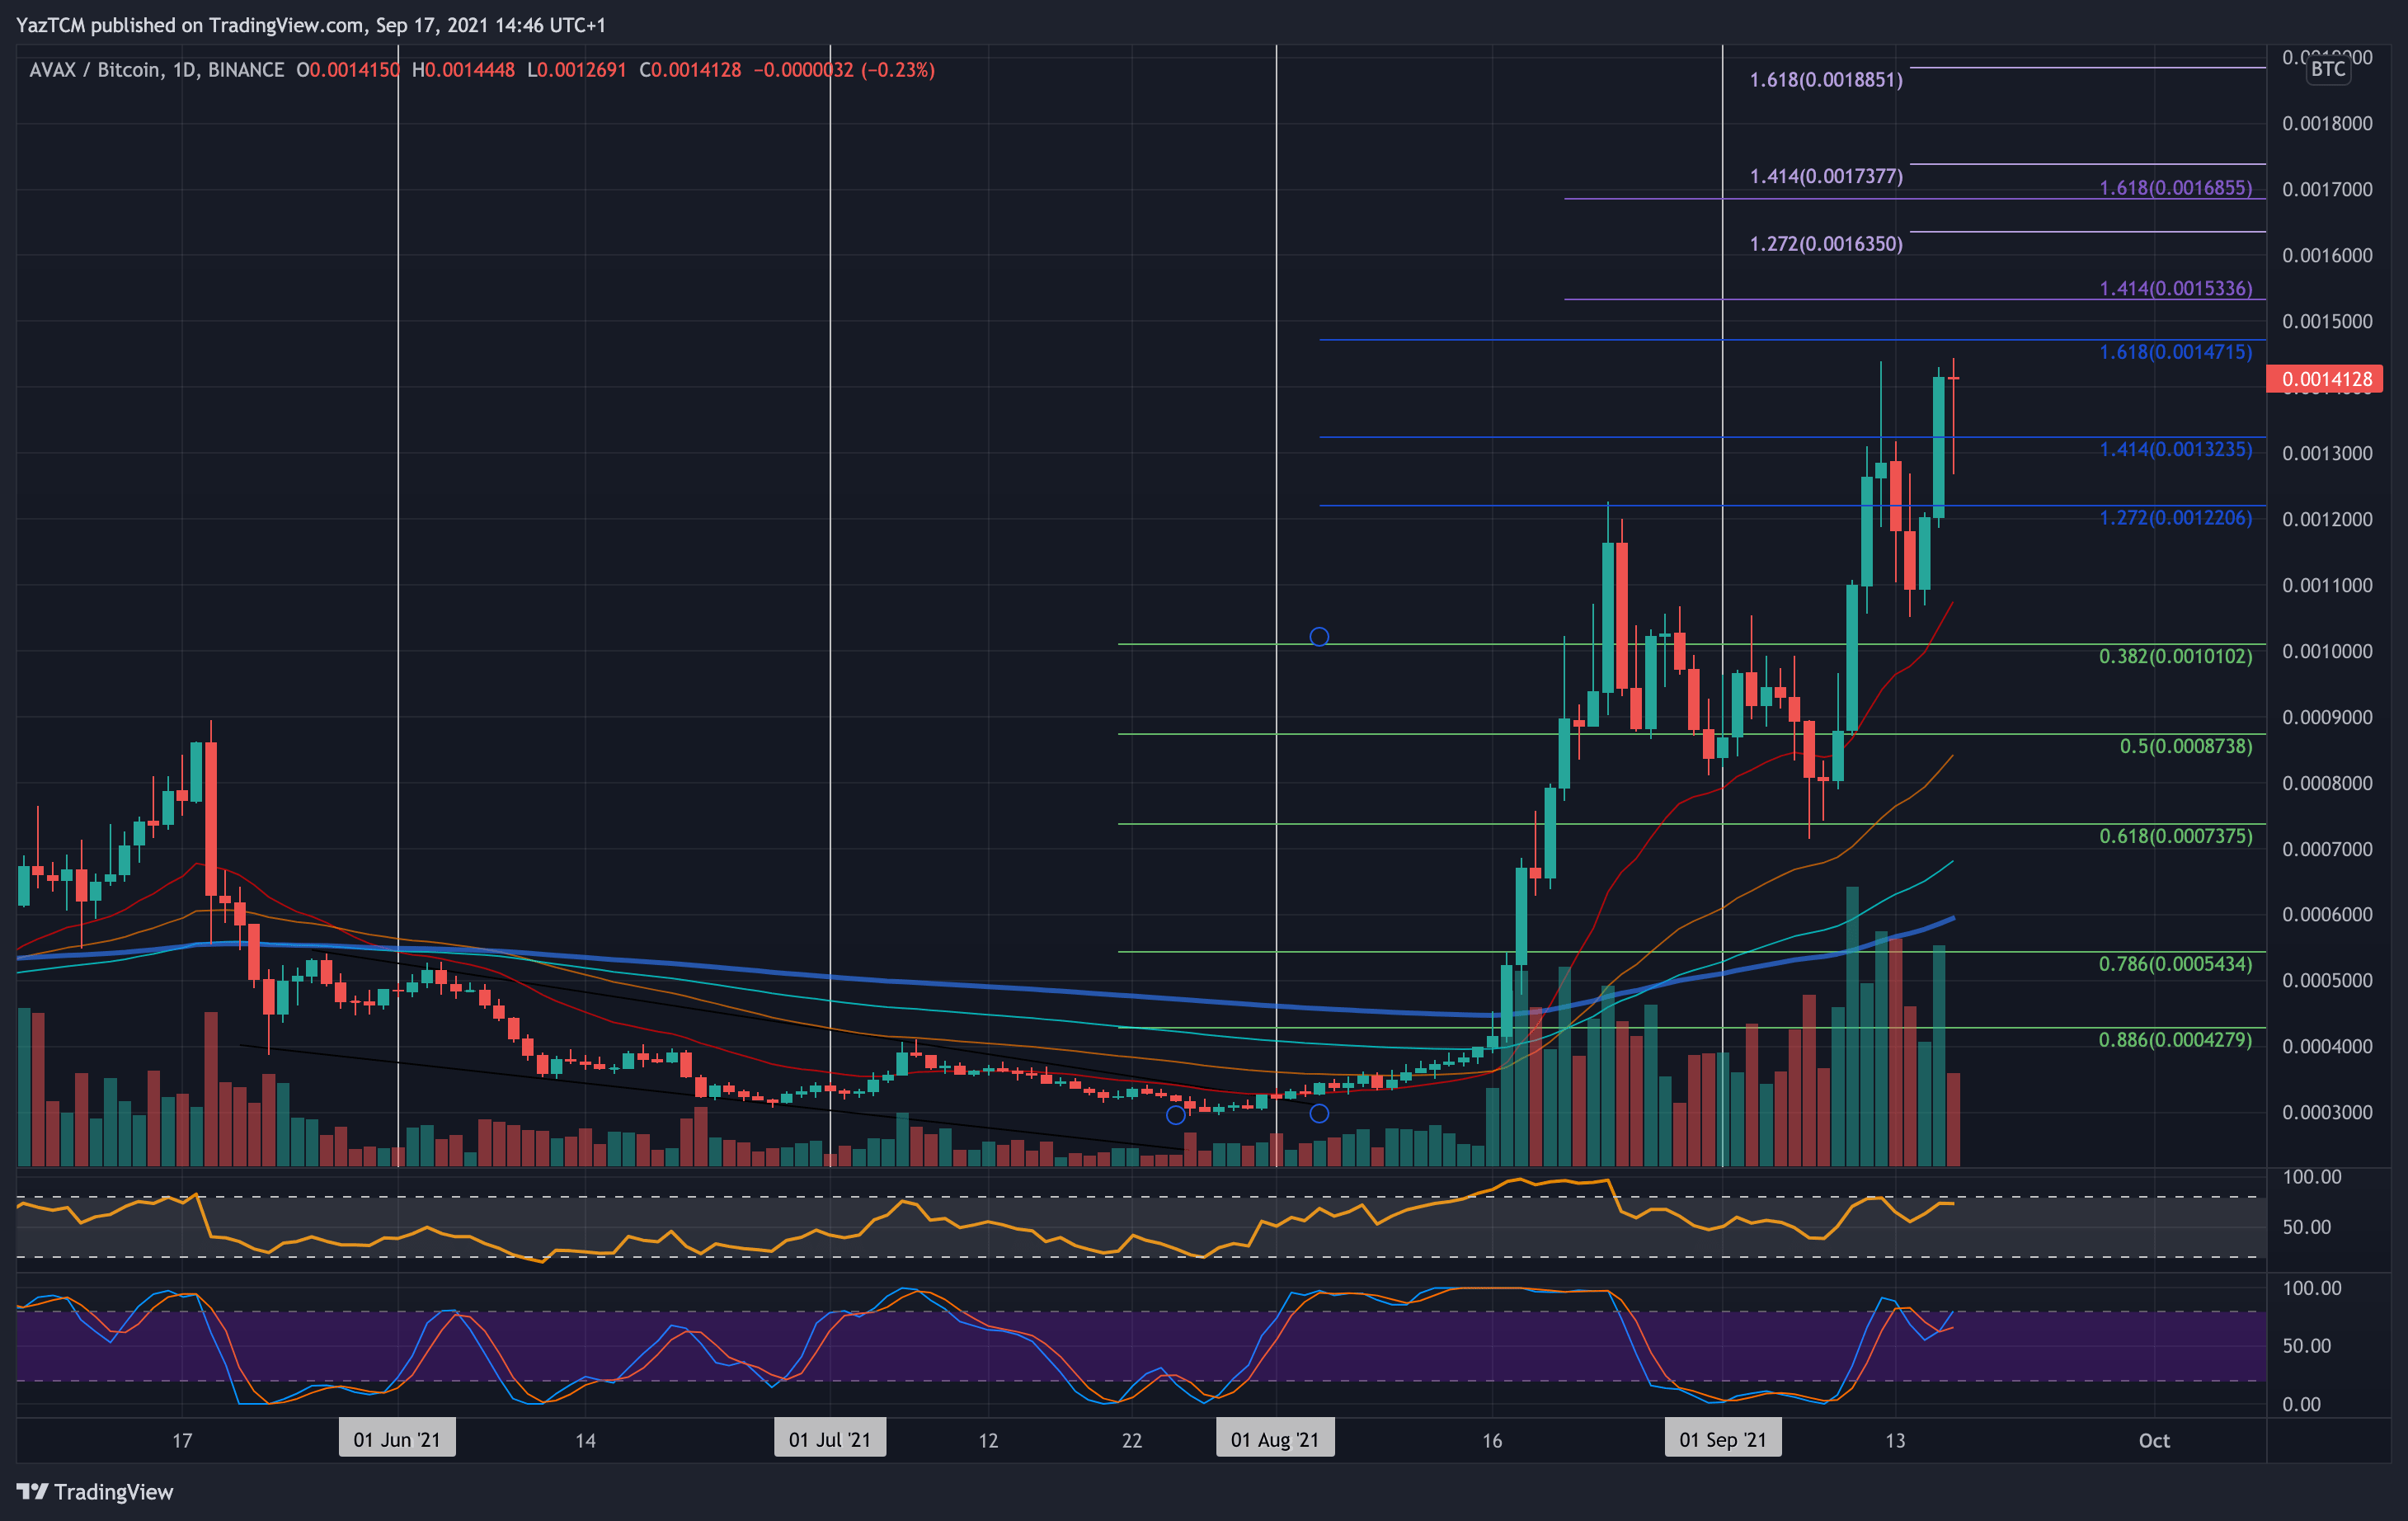
Against BTC, AVAX is also performing very well as it trades at 0.00141 BTC. The coin was trading around 0.00087 BTC (20-day MA) last Friday as it started to push higher to end the weekend at 0.0013 BTC. Yesterday, AVAX managed to break 0.0013 BTC to reach the current 0.00141 BTC level.
Looking ahead, the first resistance is expected at 0.00147 BTC (1.618 Fib Extension). This is followed by 0.0015 BTC, 0.00153 BTC, 0.00163 BTC (1.282 Fib Extension), 0.0017 BTC, and 0.00173 BTC (1.414 Fib Extension).
On the other side, the first support lies at 0.0014 BTC. This is followed by 0.00132 BTC, 0.00122 BTC, 0.0011 BTC (20-day MA), and 0.001 BTC.