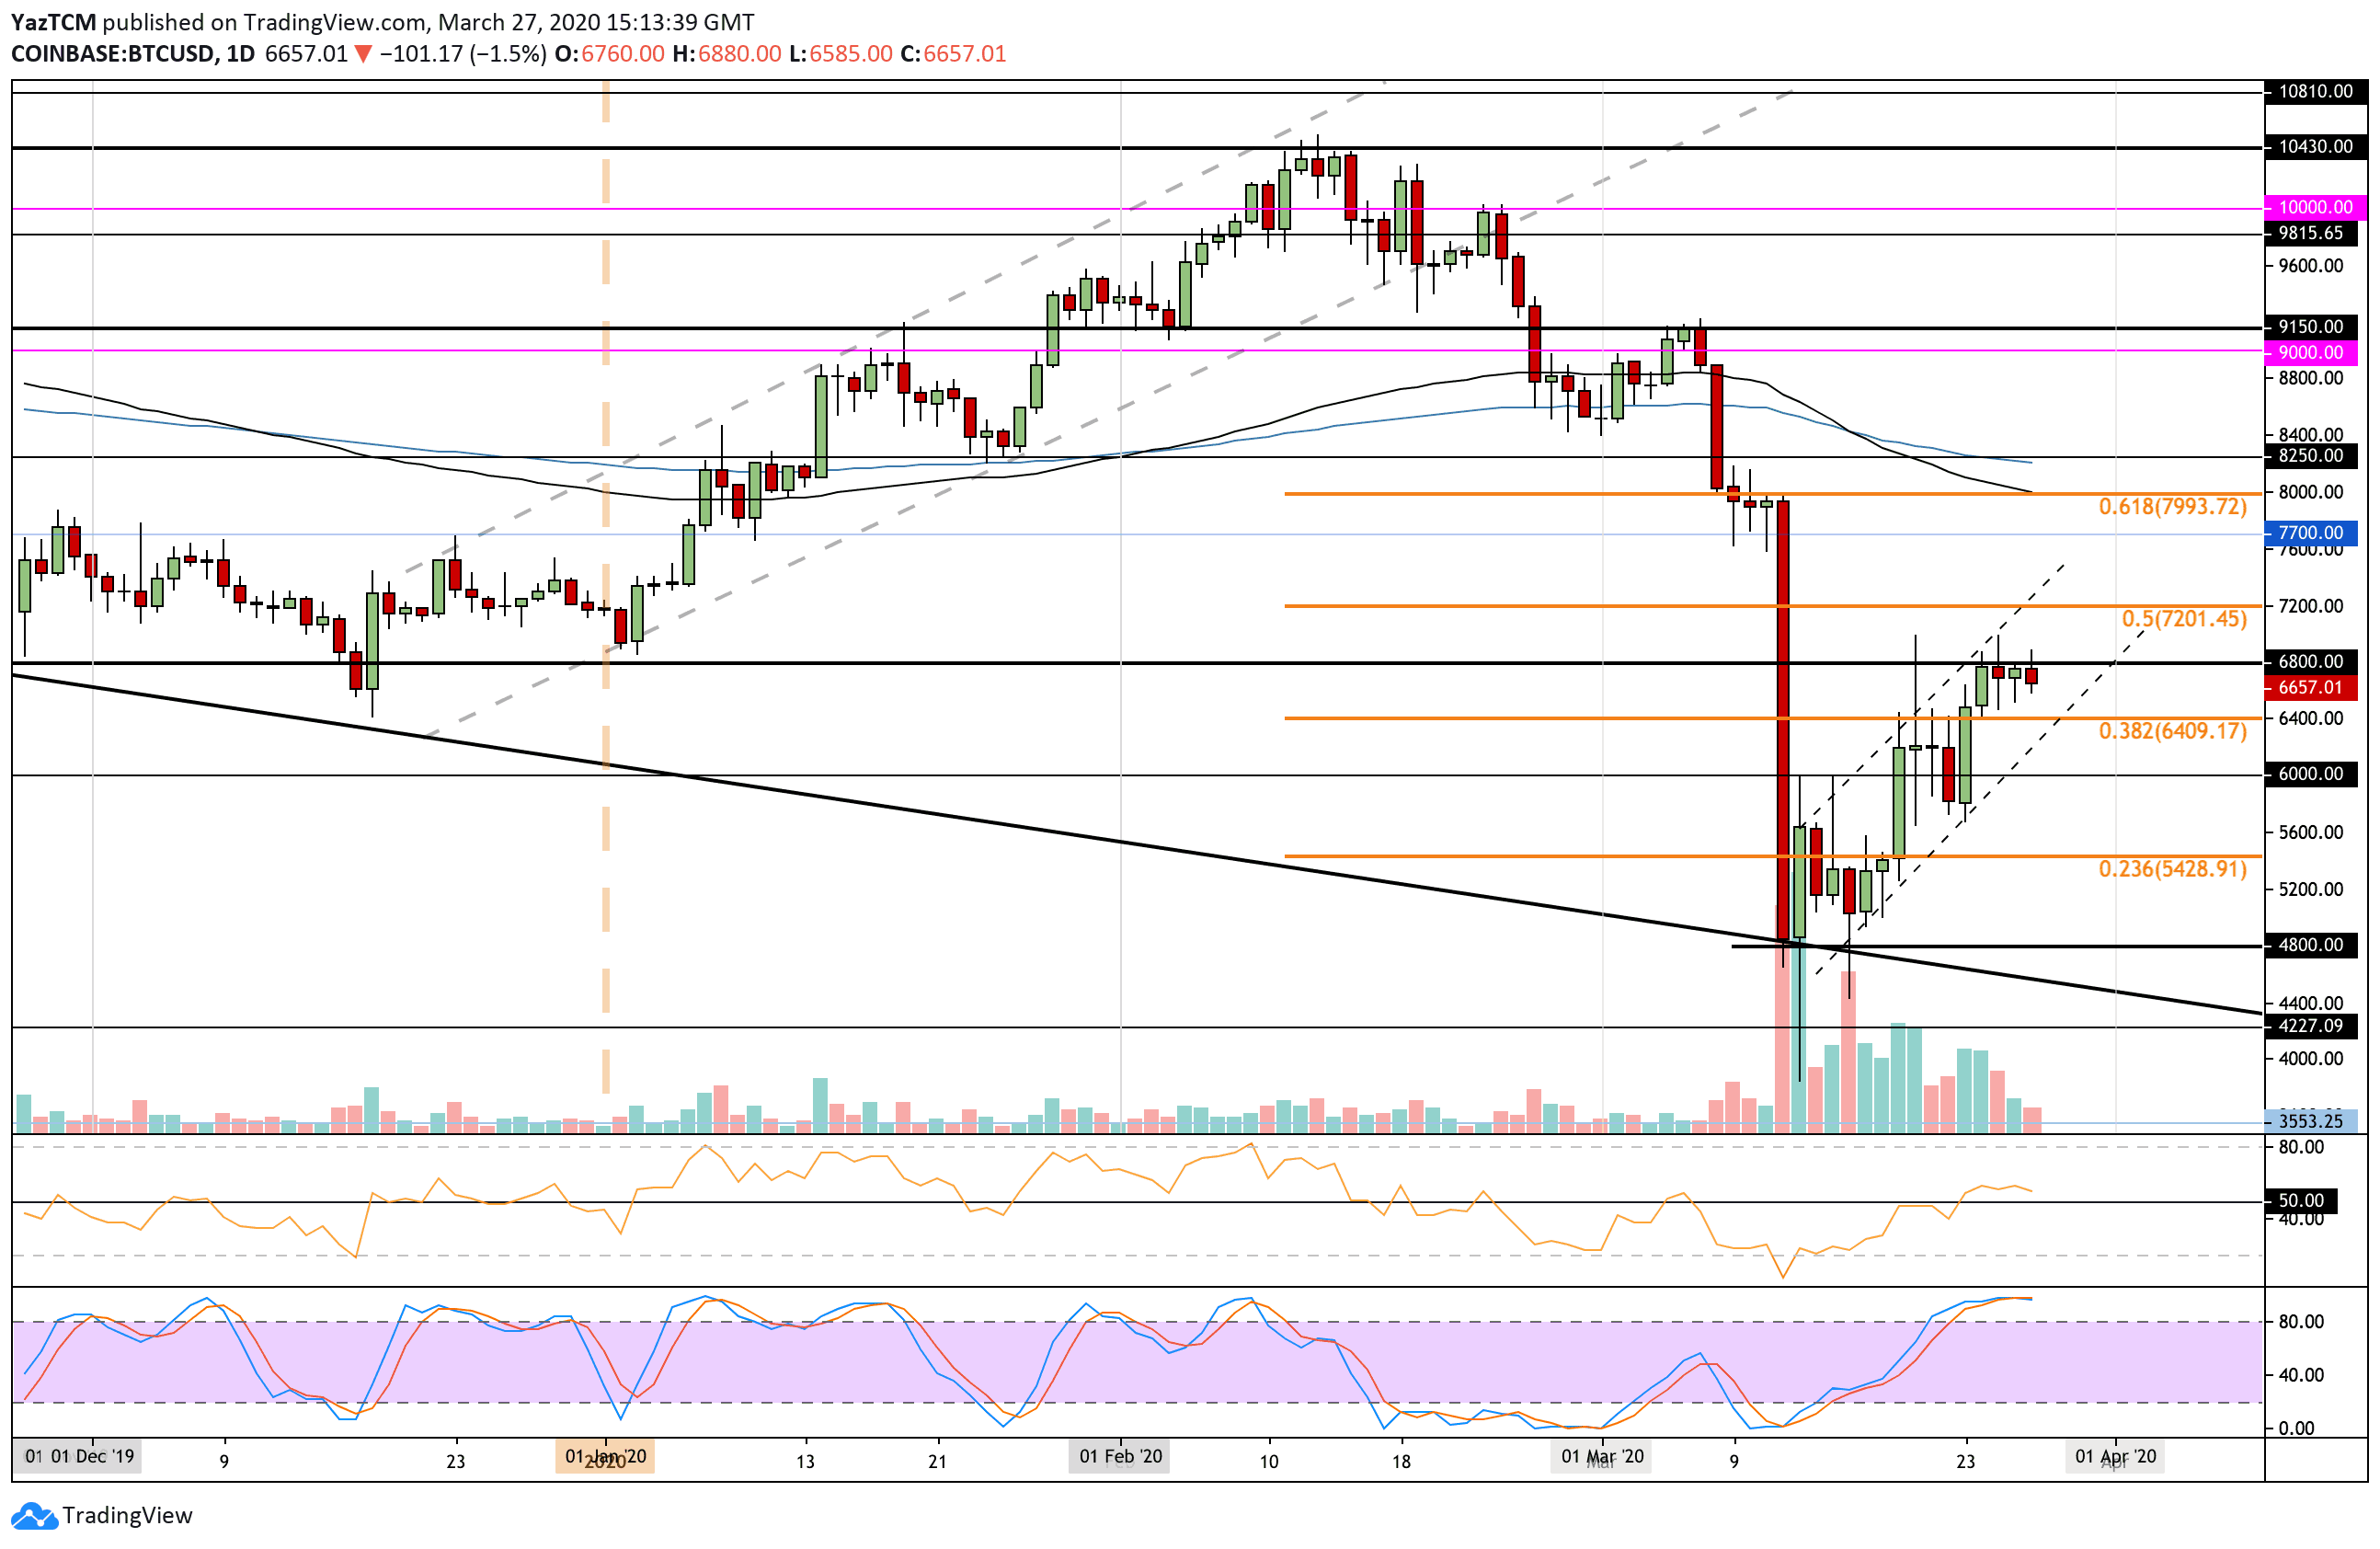
Bitcoin price increased by a total of around 10% this week as it blew past the $6,000 level to reach the resistance at $6,800. It did manage to spike as high as $7,000 but has failed to break above $6,800 for the past 4-days of trading and recently rolled over to reach $6,640.
From above, the first level of resistance to break lies at $6,800. Above this, resistance lies at $7,000, $7,200 (bearish .5 Fib Retracement), $7,500, $7,700, and $8,000 (bearish .618 Fib Retracement & 100-days EMA).
From below, the first level of support lies at $6,400. Beneath this, support lies at the lower boundary of the rising price channel, $6,000, $5,450, and $5,000. This is followed by $4,800.
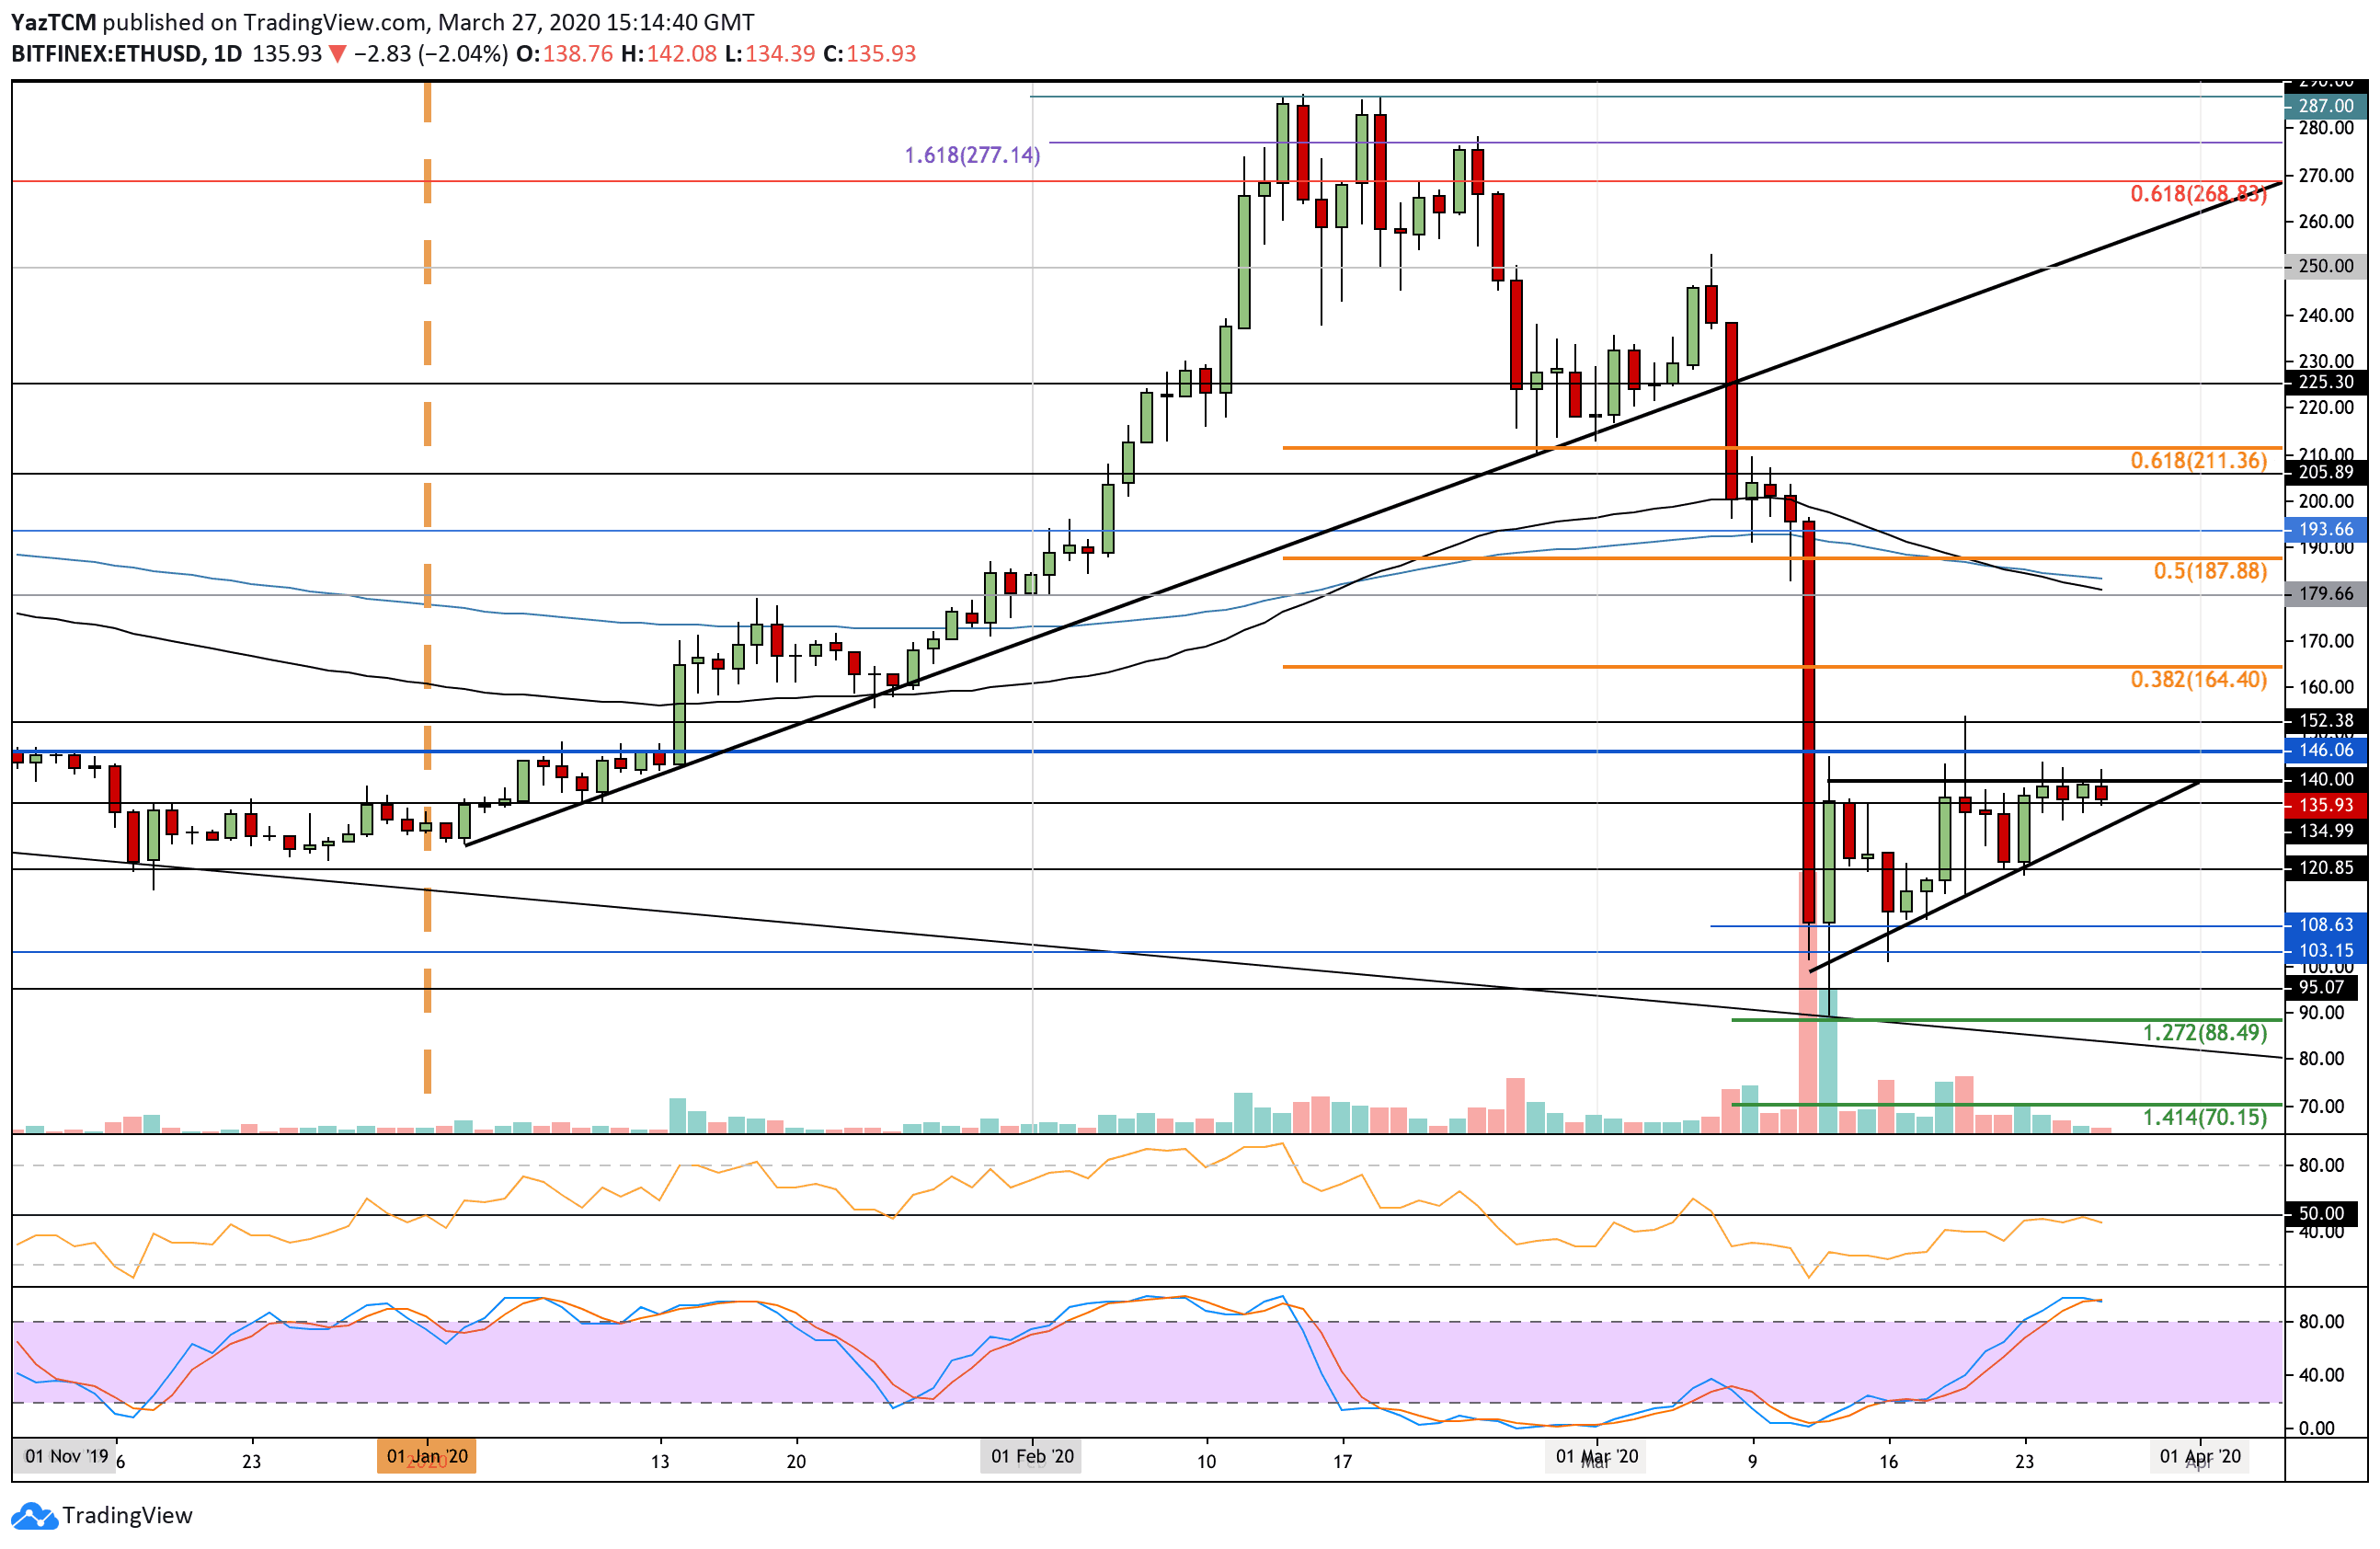
Ethereum increased by around 7.5% from the low seen seven days ago as it trades at the $135 level. It struggled to break above $140 this week, causing it to trade within an ascending triangle consolidation pattern. A break of this triangle will dictate the next direction for ETH.
Toward the upside, resistance lies at the upper boundary of the triangle at $140. Above this, resistance lies at $145, $150, $165 (bearish .382 Fib Retracement), and $180 (100-days EMA).
On the other side, support lies at $135. Beneath this, support lies at the rising trend line, $120, $110, and $105.
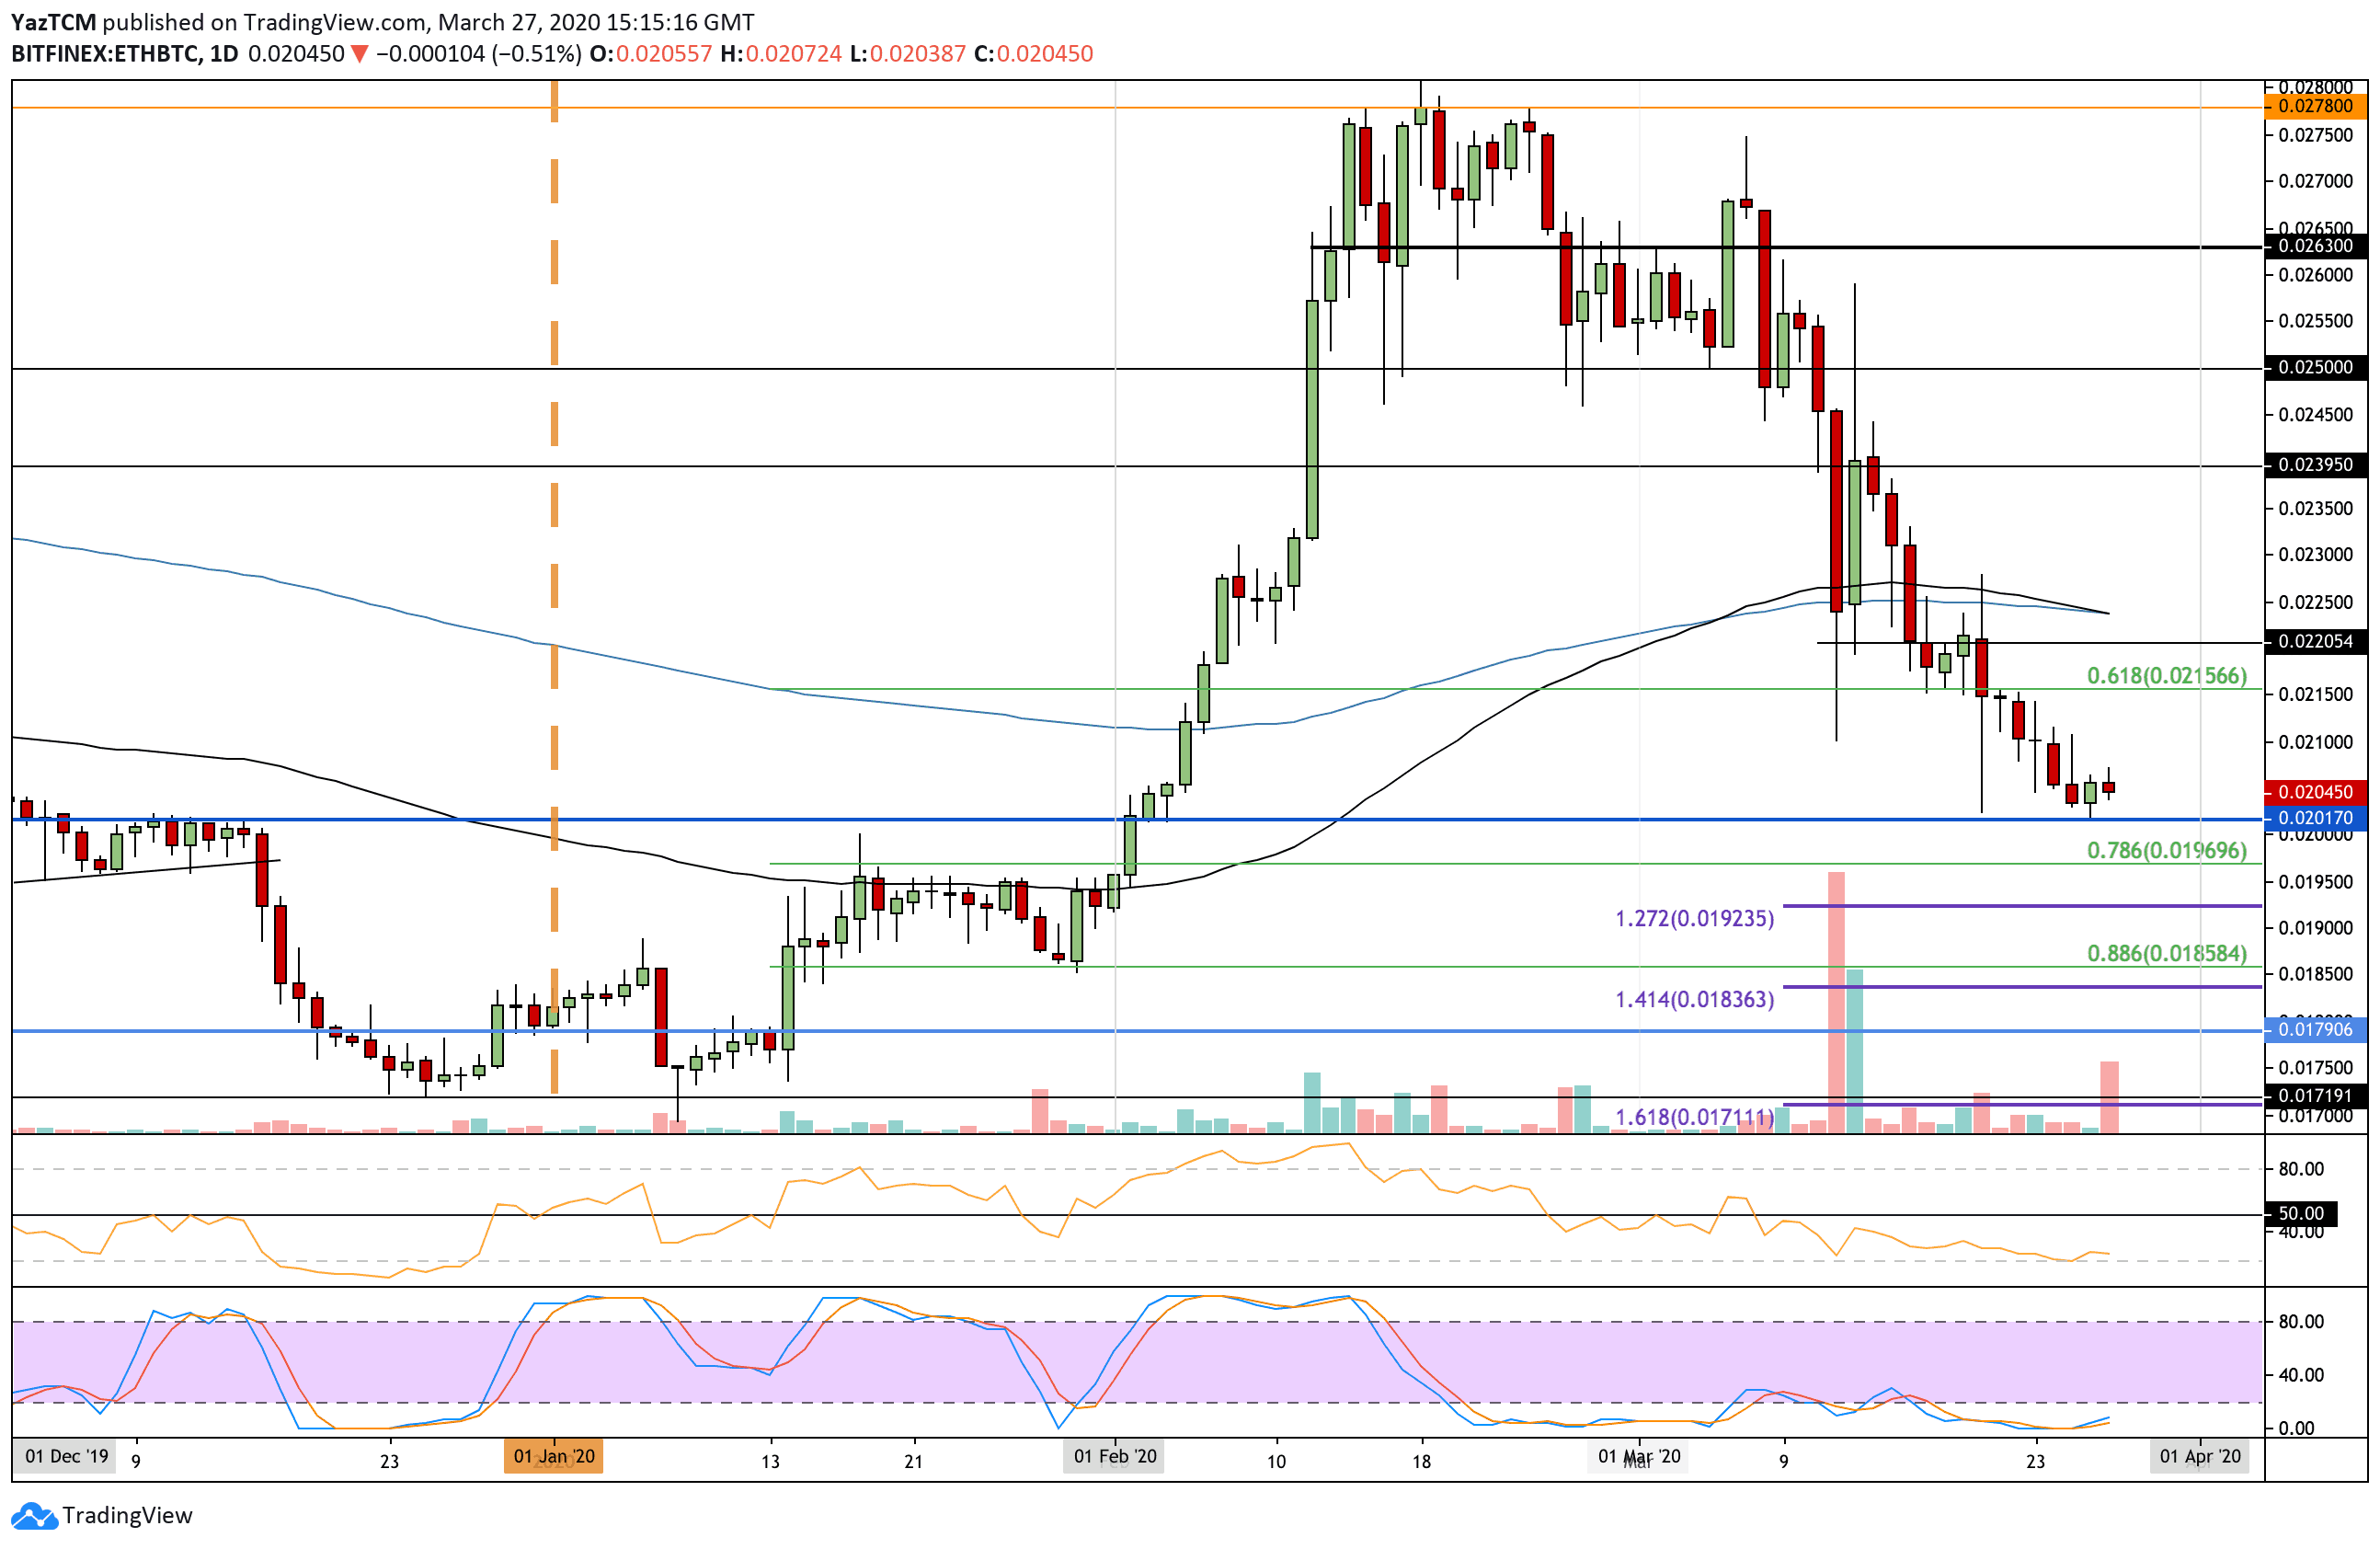
Against Bitcoin, ETH dropped beneath the crucial support at 0.0215 BTC that was highlighted last week. It continued to fall until reaching the recent support at 0.0201 BTC. A drop beneath 0.02 BTC will likely send ETH down to 0.0185 BTC against Bitcoin.
From below, support lies at 0.0201 BTC and 0.02 BTC. Beneath this, support lies at 0.0196 BTC (.786 Fib Retracement), 0.0192 BTC (downside 1.272 Fib Extension), and 0.0185 BTC (.886 Fib Retracement).
From above, resistance is located at 0.021 BTC. Above this, resistance lies at 0.0215 BTC, 0.022 BTC, and 0.0225 BTC (100-days and 200-days EMA’s).
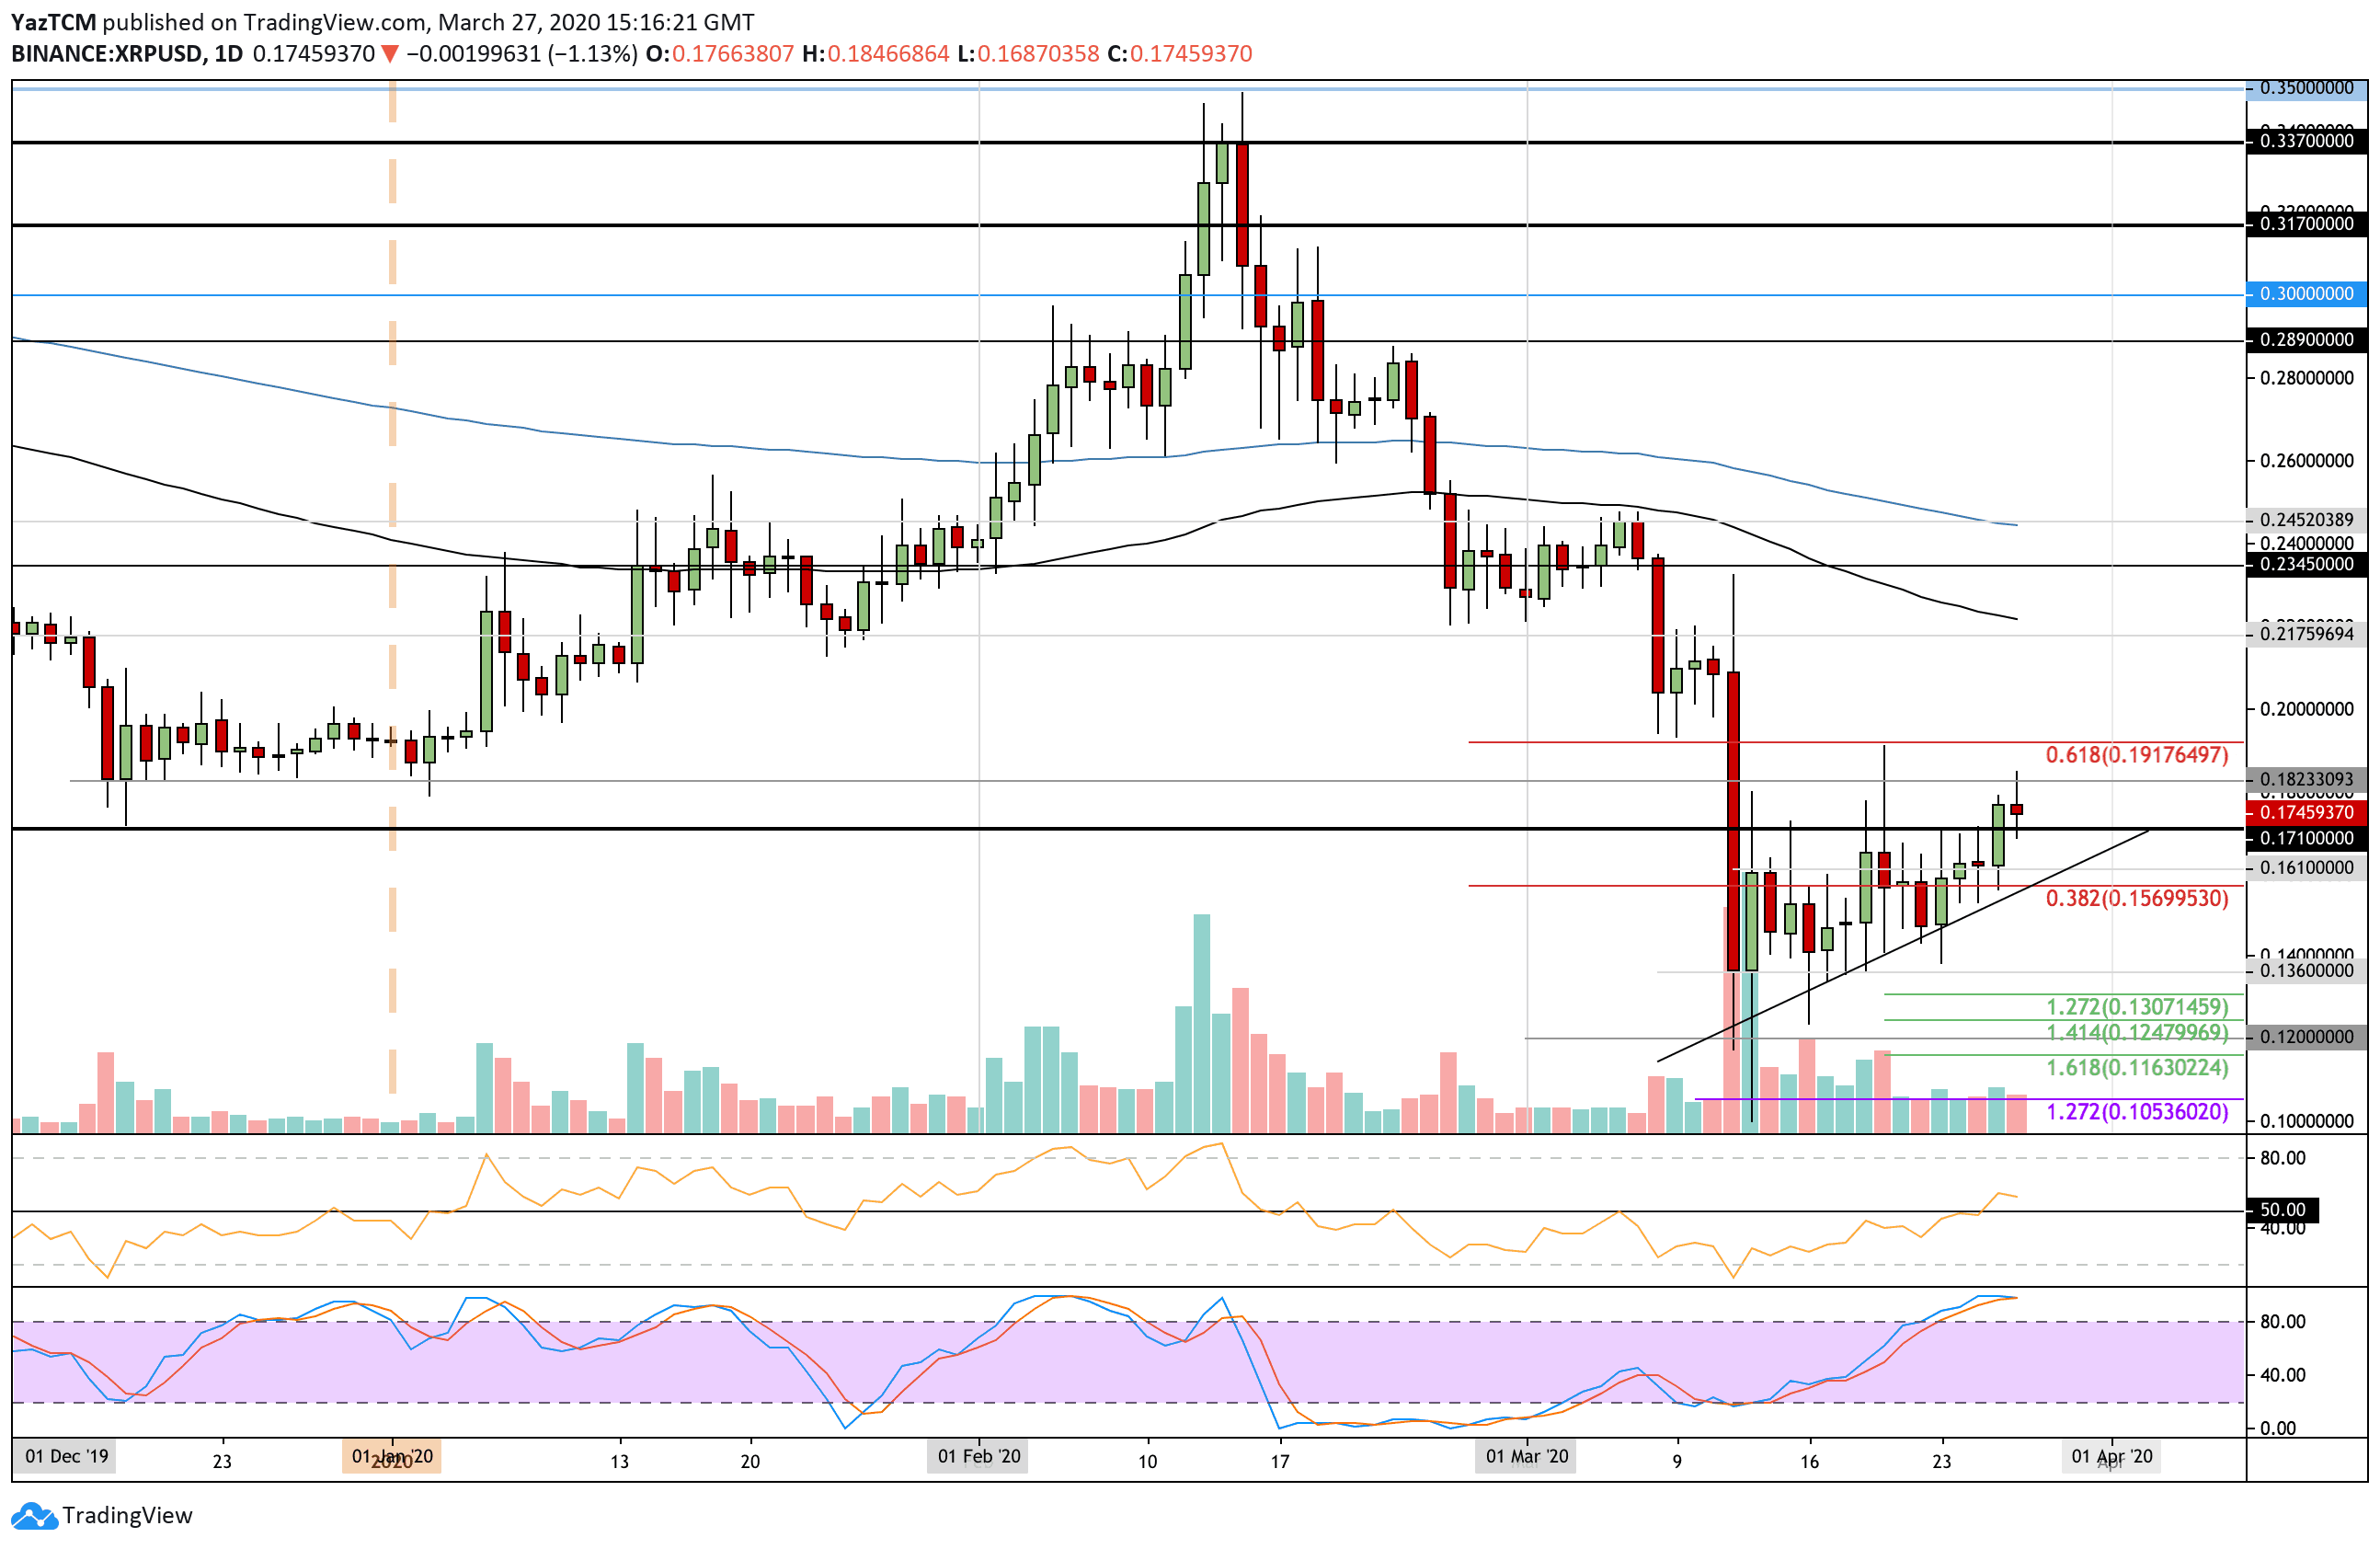
XRP saw a substantial 19% price increase from last week’s low price as the cryptocurrency managed to climb above an ascending triangle to reach as high as $0.18. It has since fallen and is trading at $0.175.
From above, resistance lies at $0.18, $0.191 (bearish .618 Fib Retracement), $0.20, and $0.217.
From below, support is located at $0.171. Beneath this, support lies at $0.161, the rising trend line, $0.155, $0.14, and $0.136.
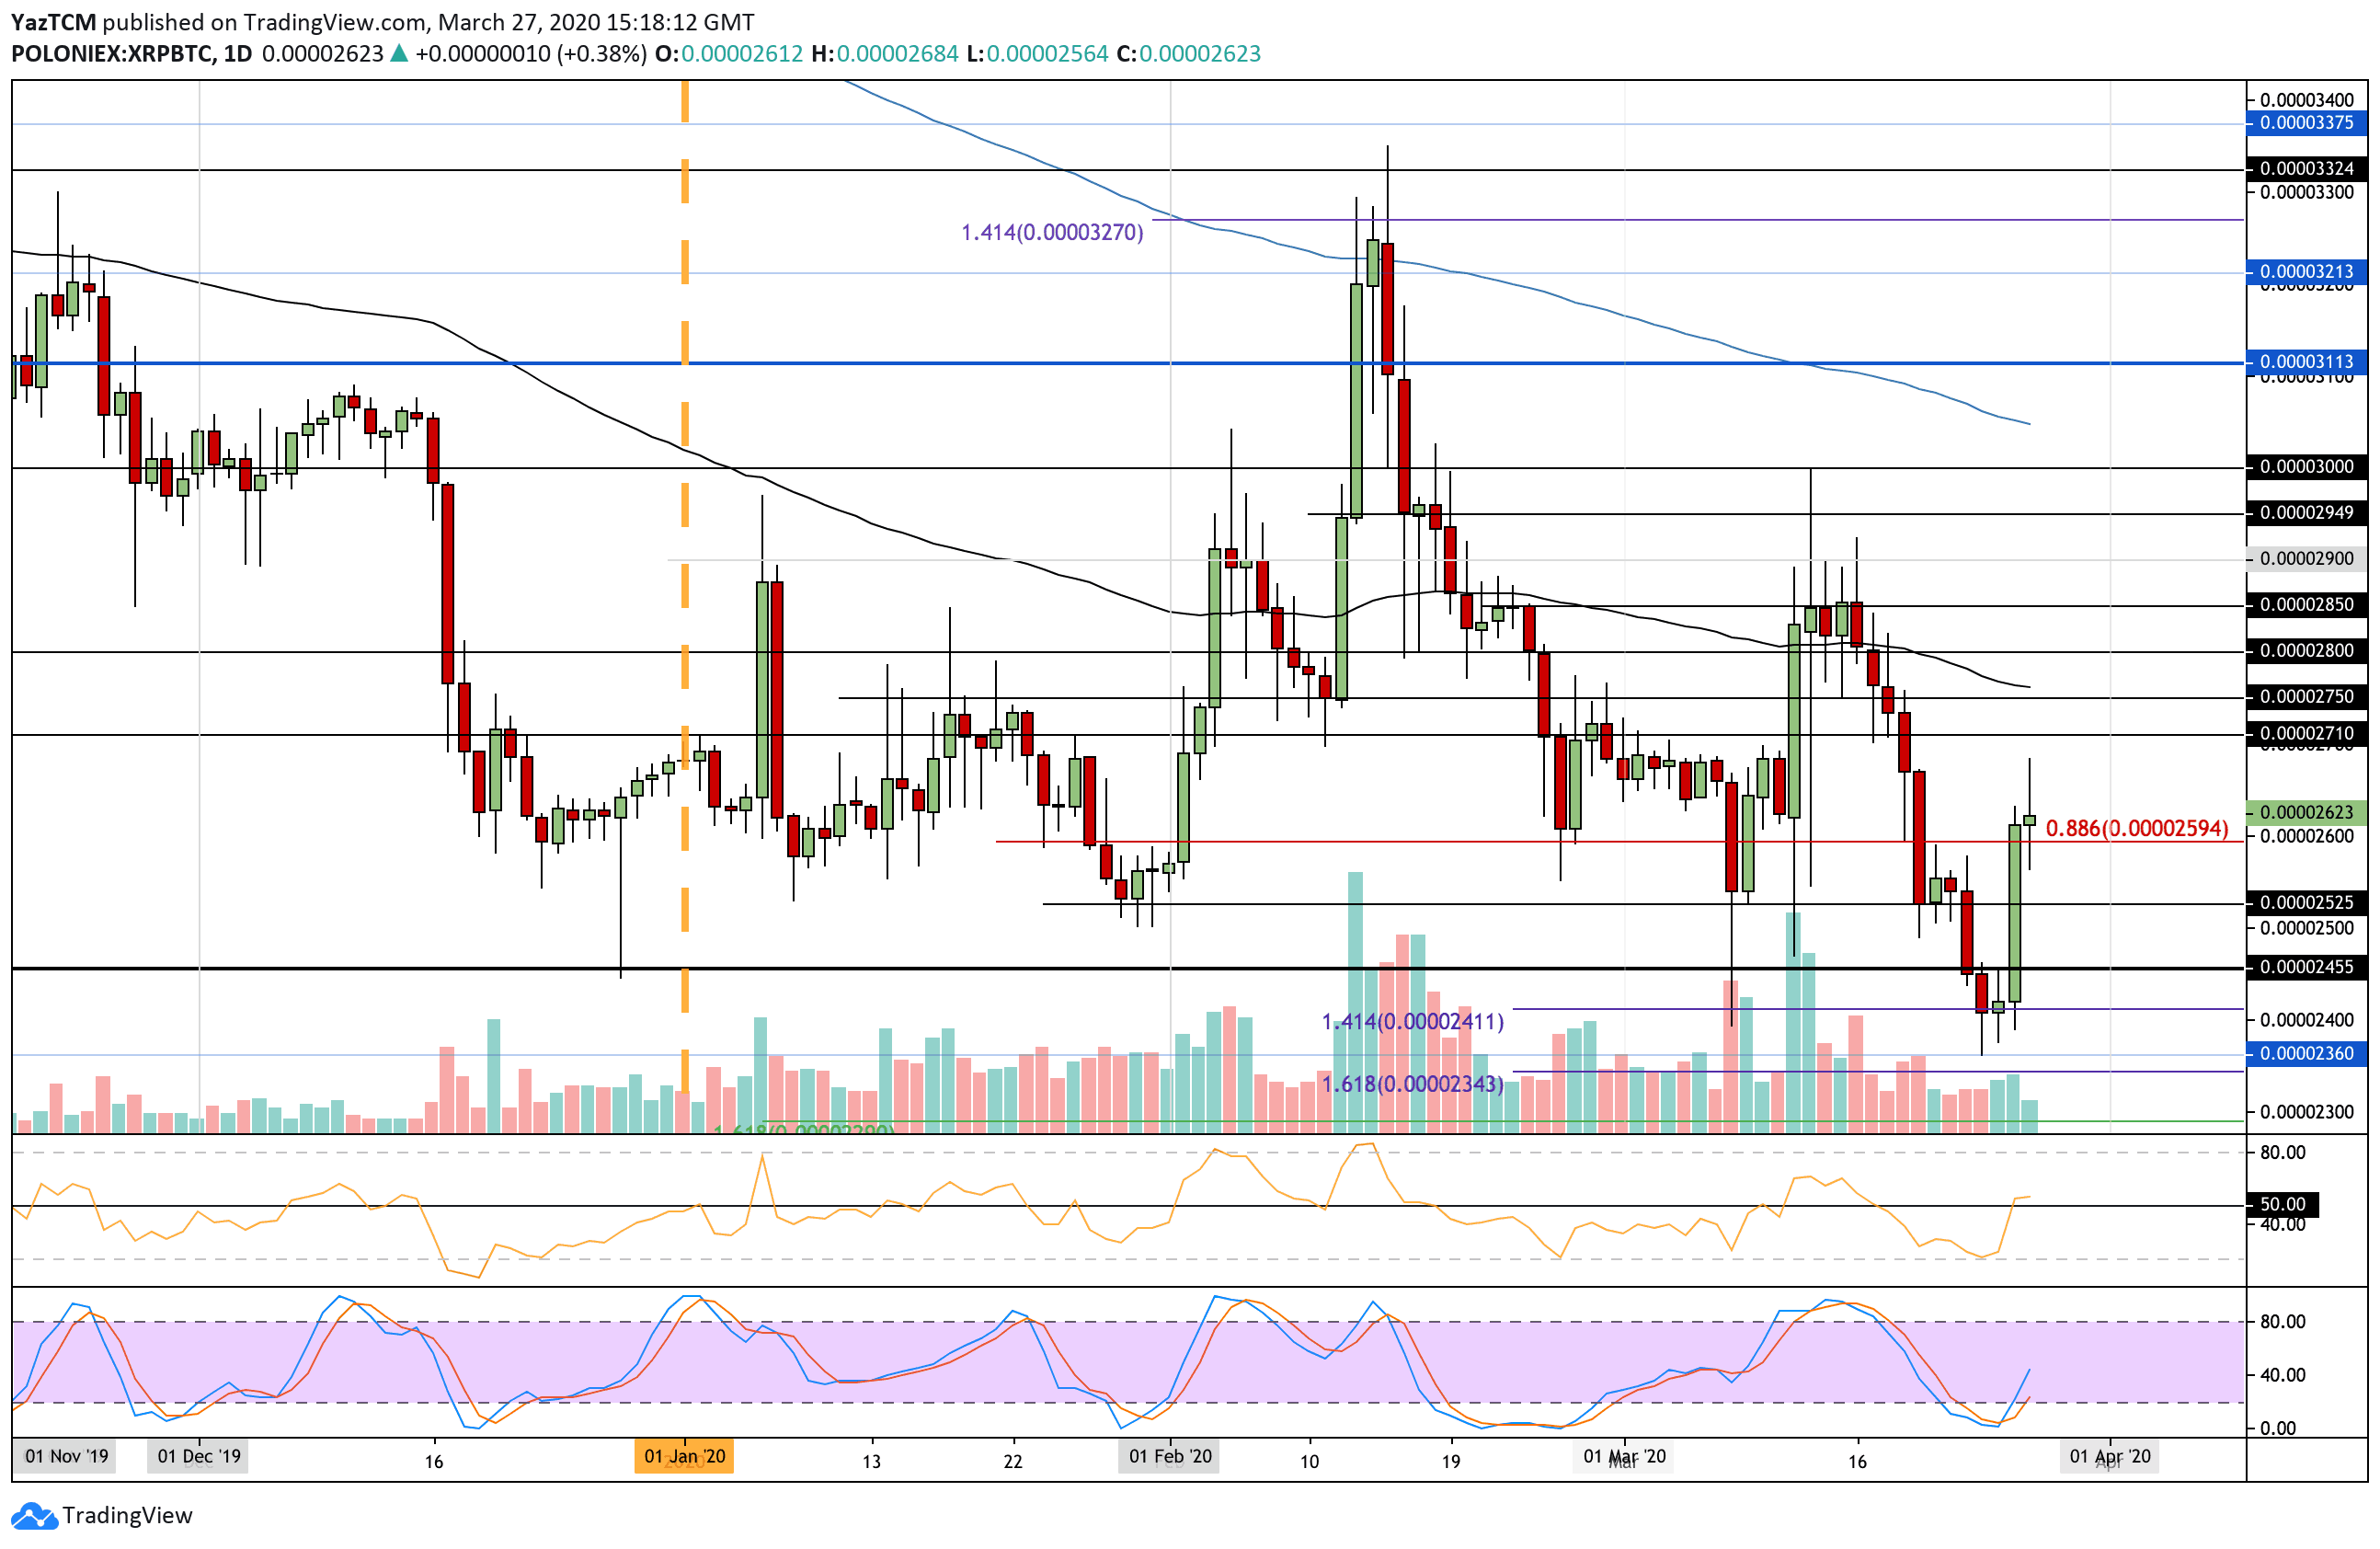
Against Bitcoin, XRP fell beneath the strong support at 2500 SAT to create a fresh 2020 price low at 2360 SAT. This level had provided support for the market during September 2019 and allowed XRP to rebound. It is now trading above 2600 SAT.
From above, the first level of resistance is at 2710 SAT. Above this, resistance lies at 2750 SAT, 2800 SAT, and 2850 SAT.
On the other side, the first level of support lies at 2600 SAT. Beneath this, support lies at 2525 SAT, 2500 SAT, and 2455 SAT.
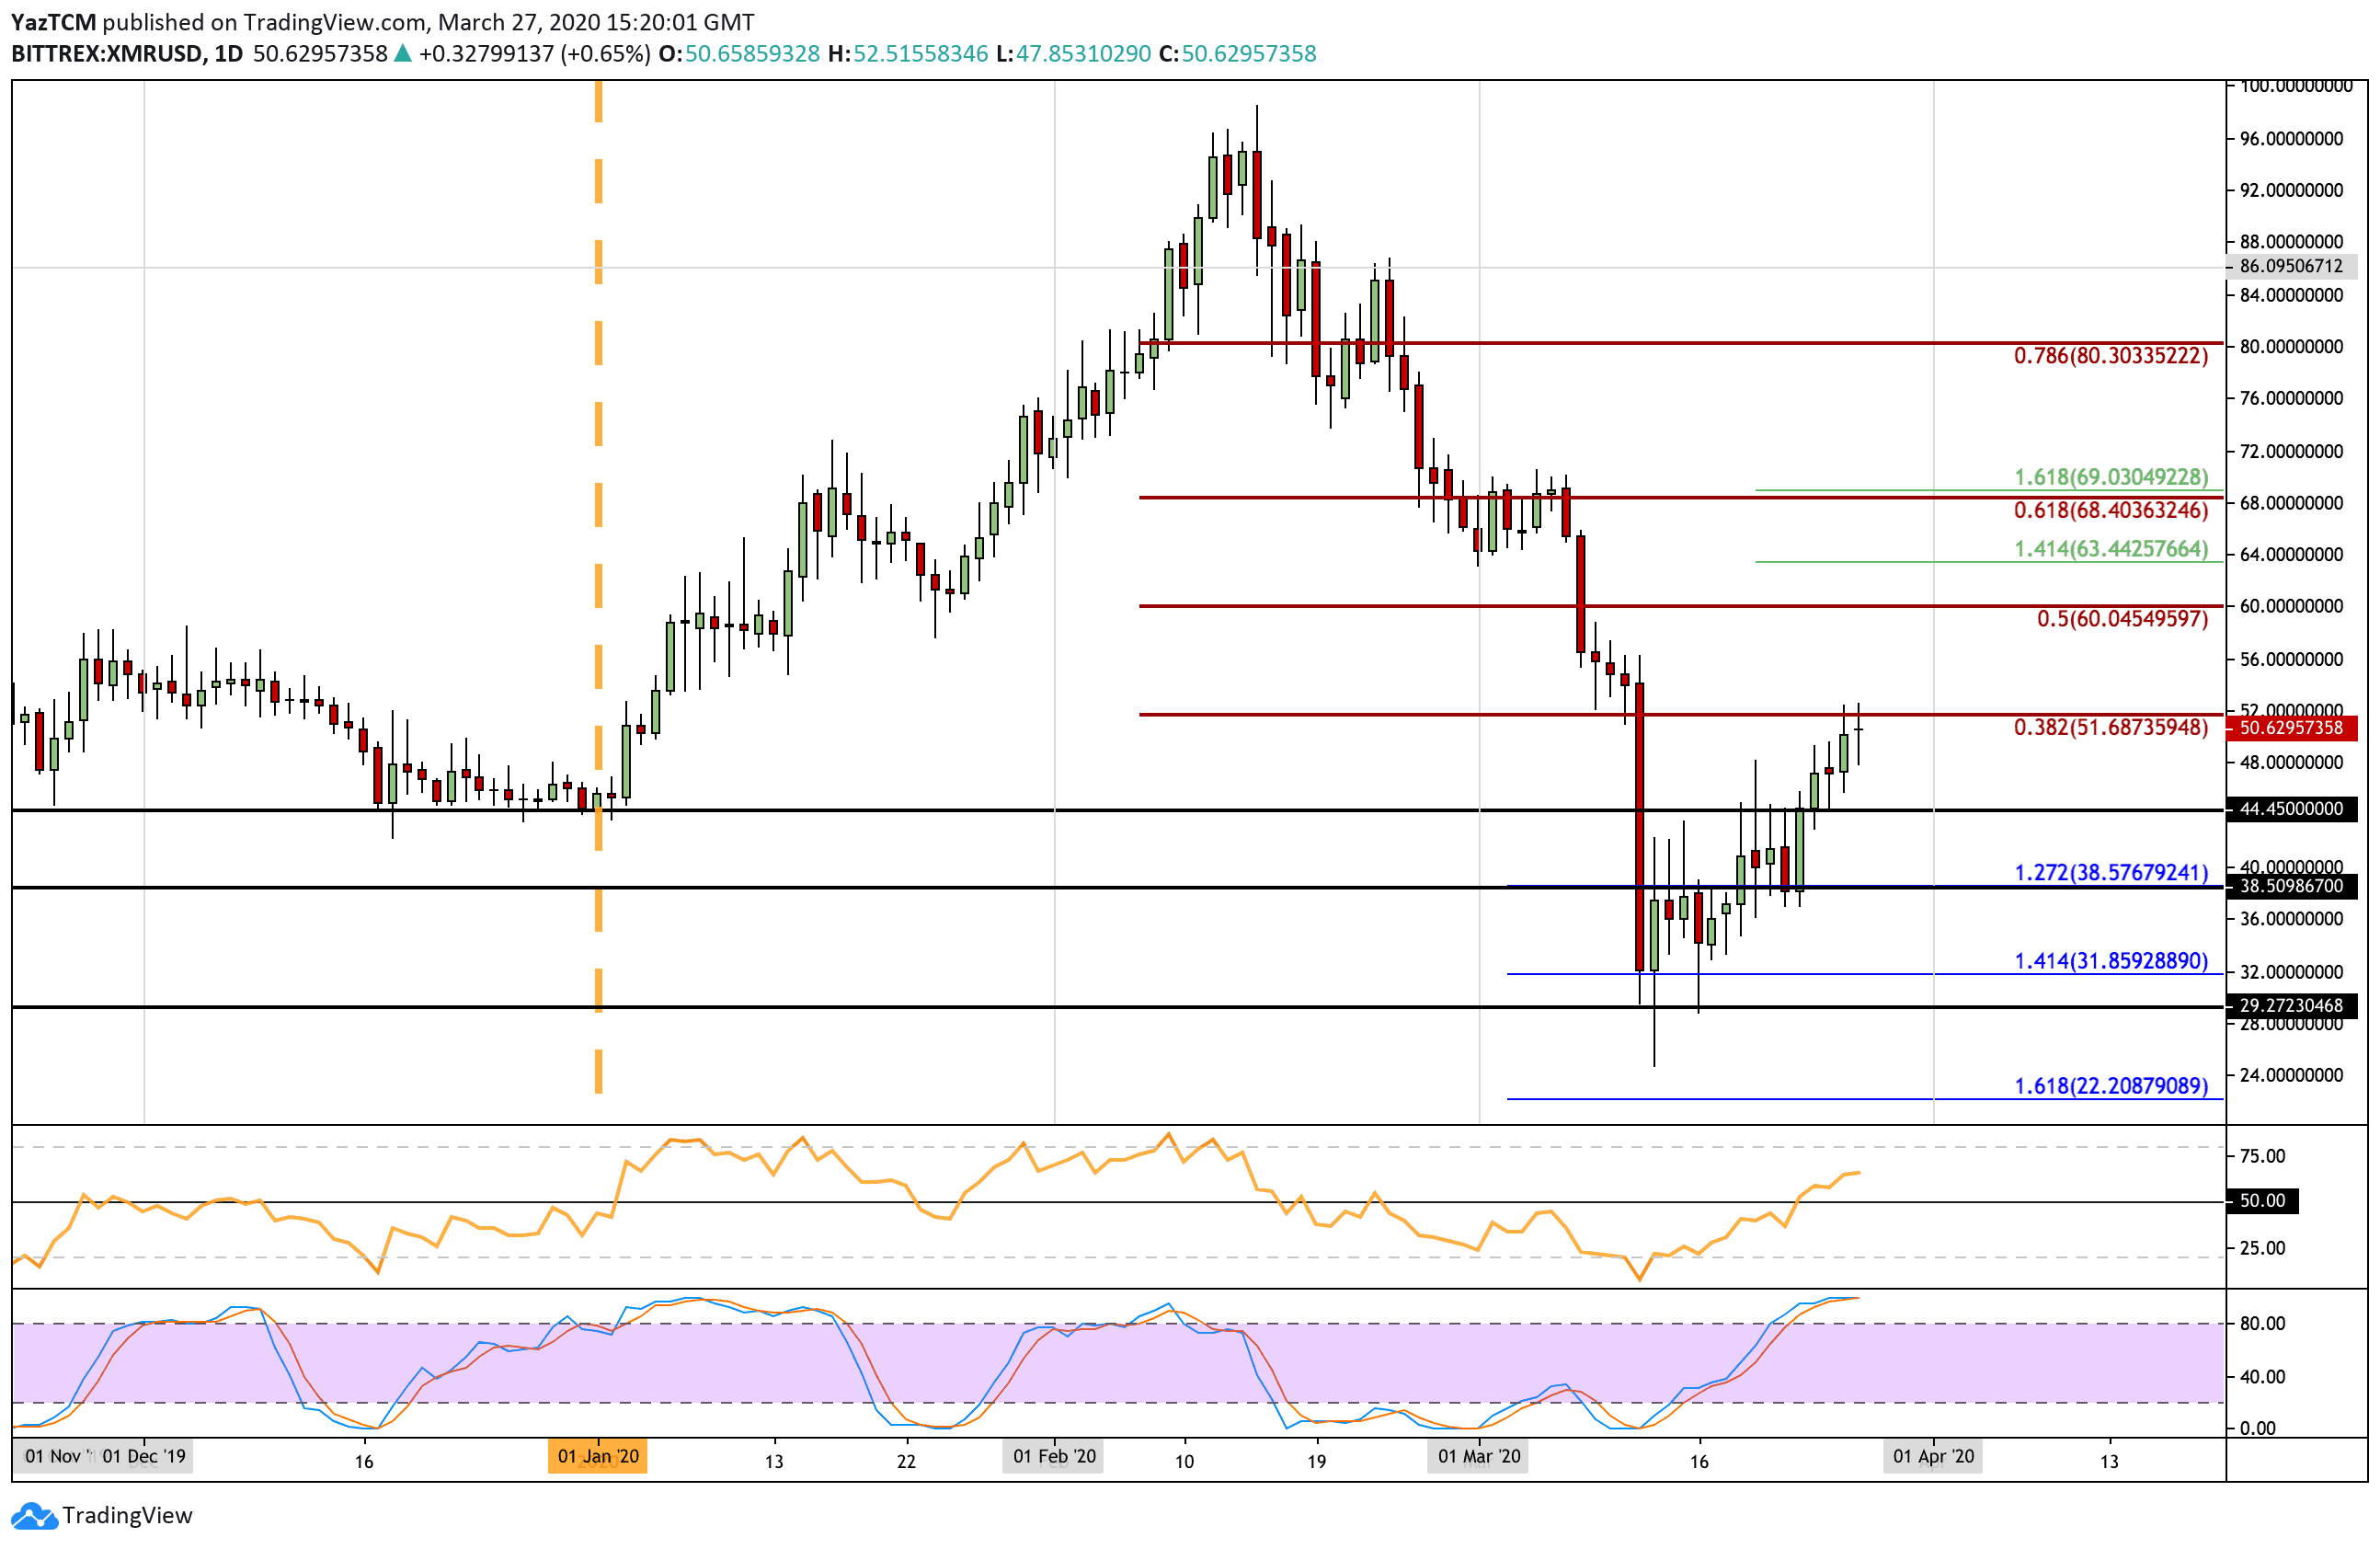
Monero saw an impressive 20.5% price increase this week as it climbs back above the $50 level. It dropped as low as $31.85 during the March market crash but rebounded from here and started a strong surge. It now faces resistance at $51.70 (bearish .382 Fib Retracement).
If the bulls break $51.70, resistance lies at $60 (bearish .5 Fib Retracement), $63.44 (1.414 Fib Extension), and $68 (bearish .618 Fib Retracement).
From below, support lies at $44.45, $40, $38.50, and $31.85.
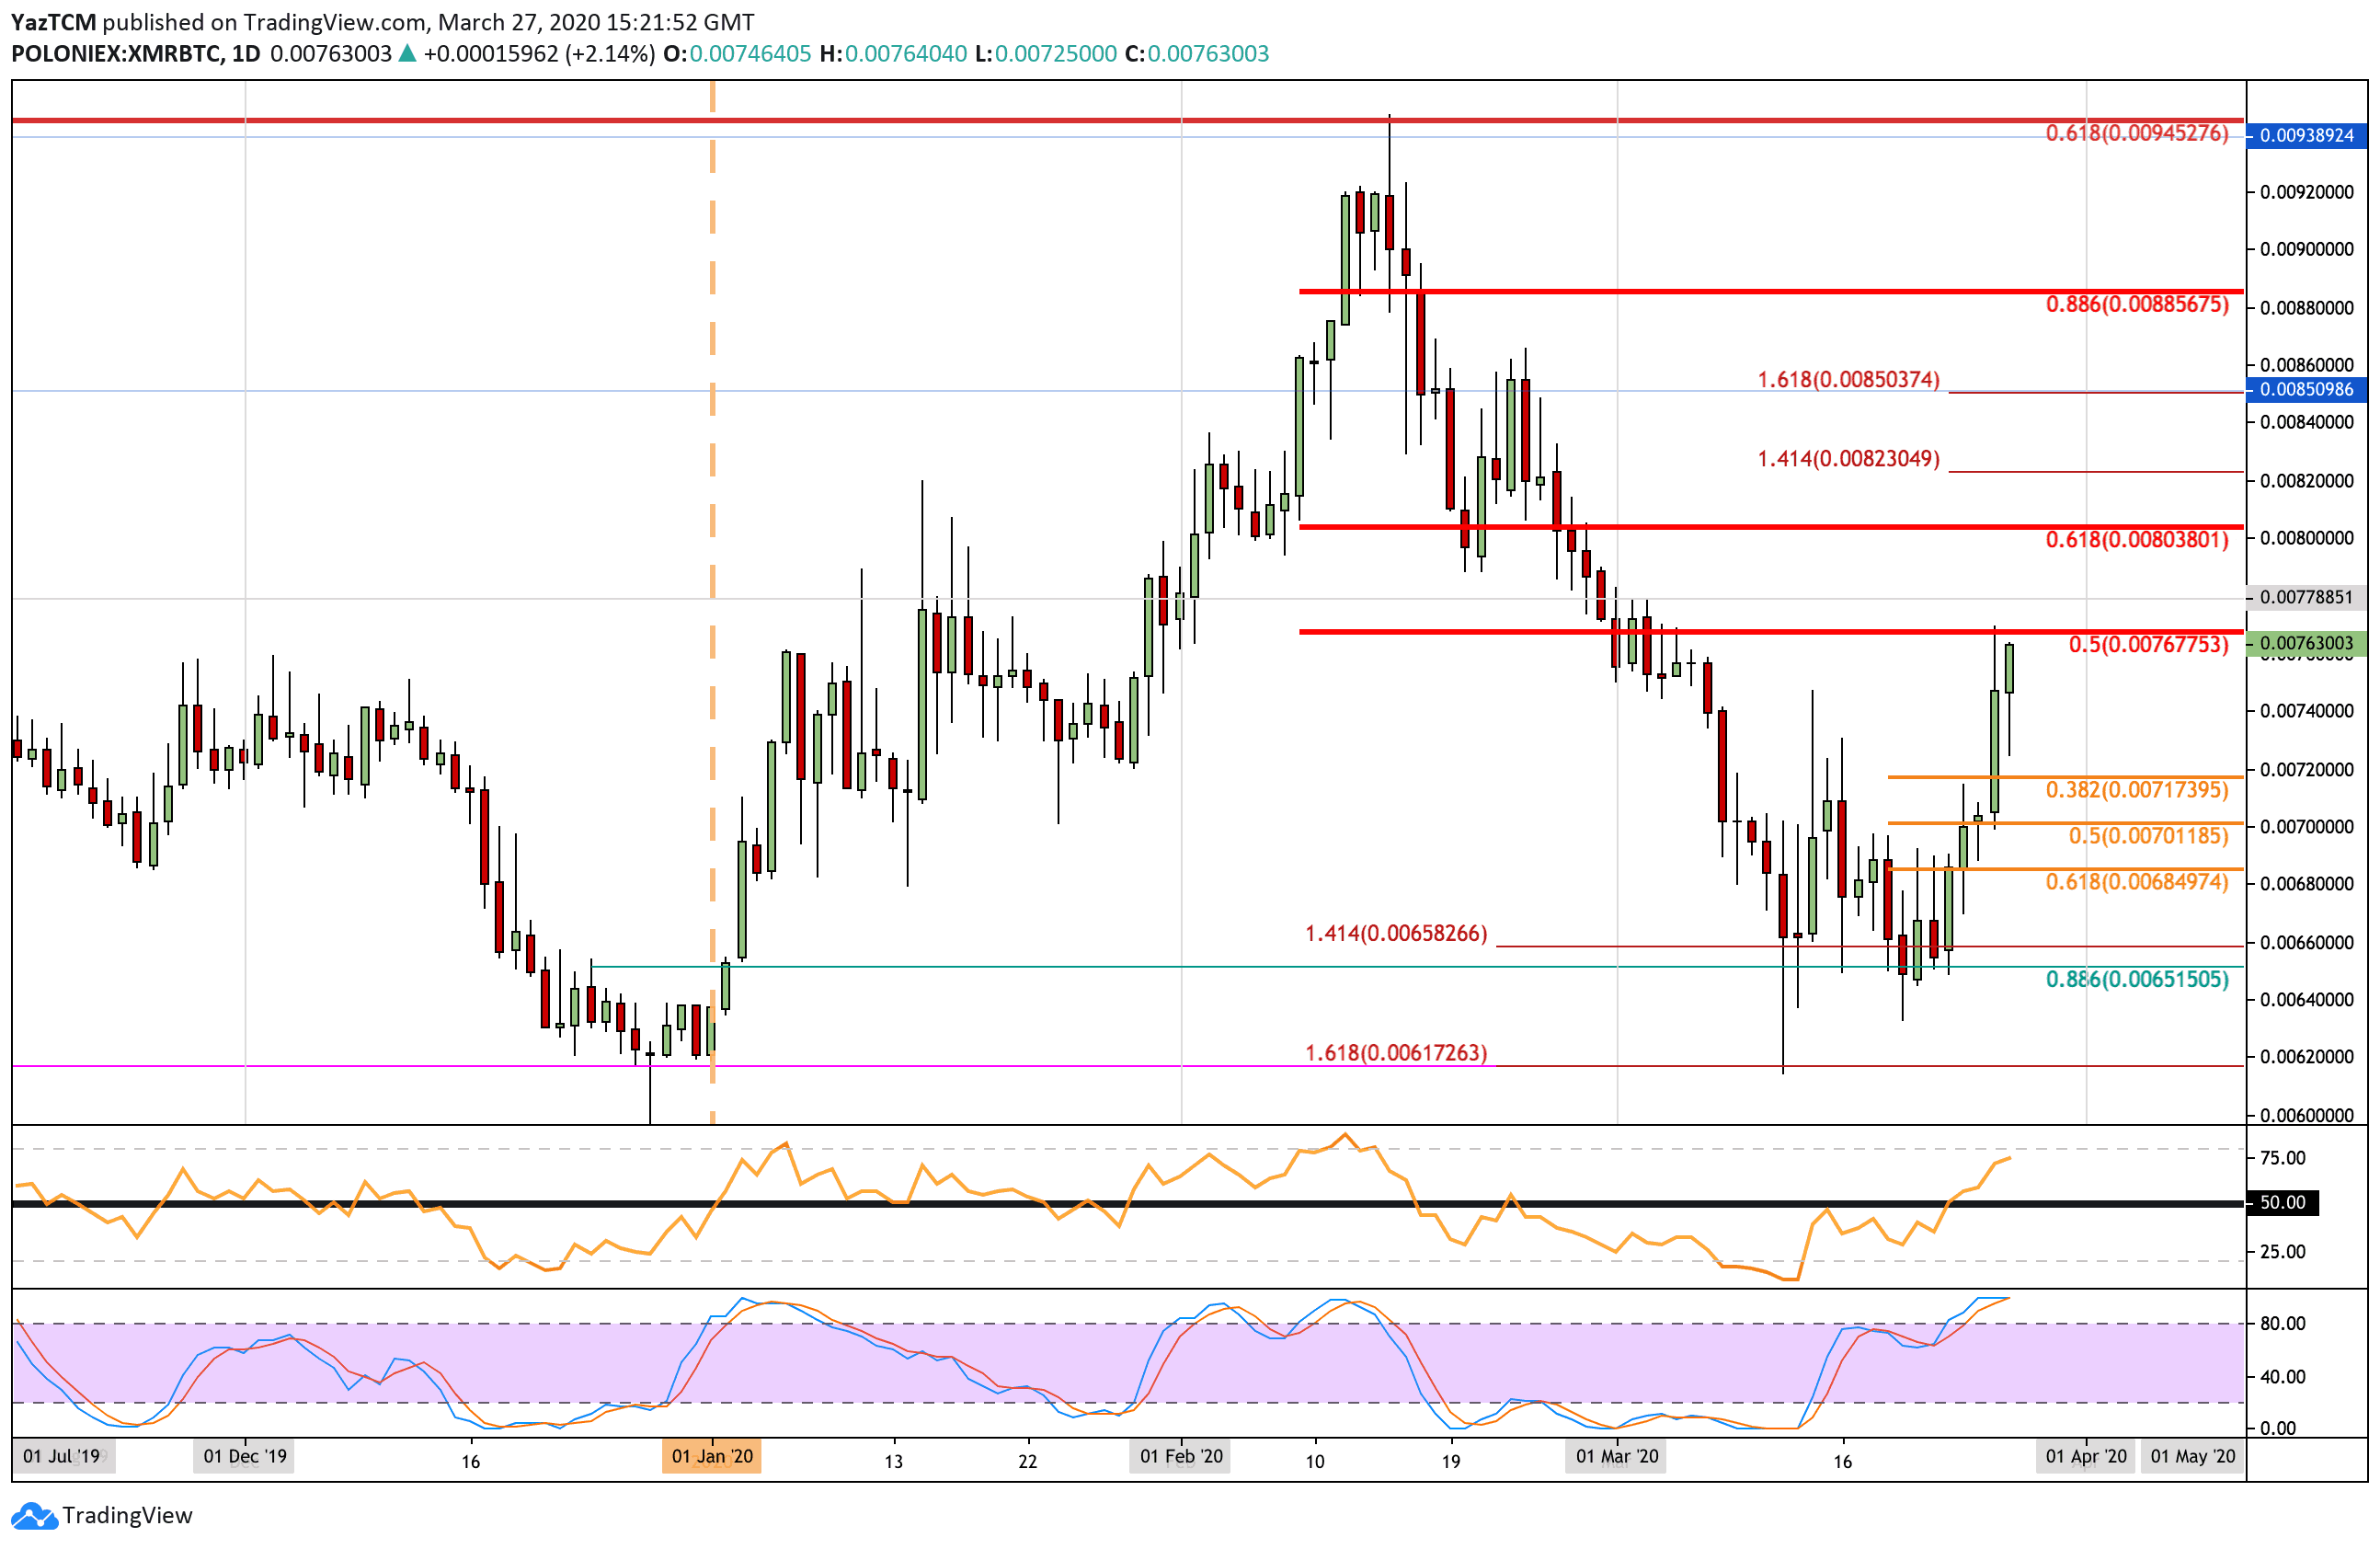
Against Bitcoin, XMR dropped as low as 0.0065 BTC before rebounding this week. It managed to climb back above 0.070 BTC to reach as high as 0.0076 BTC, where lies the bearish .5 Fibonacci Retracement resistance.
If the bulls break 0.007 BTC, resistance is located at 0.077 BTC and 0.008 BTC (bearish .618 Fib Retracement). Above this, resistance lies at 0.0082 BTC (1.414 Fib Extension).
Alternatively, support can be found at 0.0072 BTC, 0.0070 BTC (.618 Fib Retracement), and 0.0068 BTC.
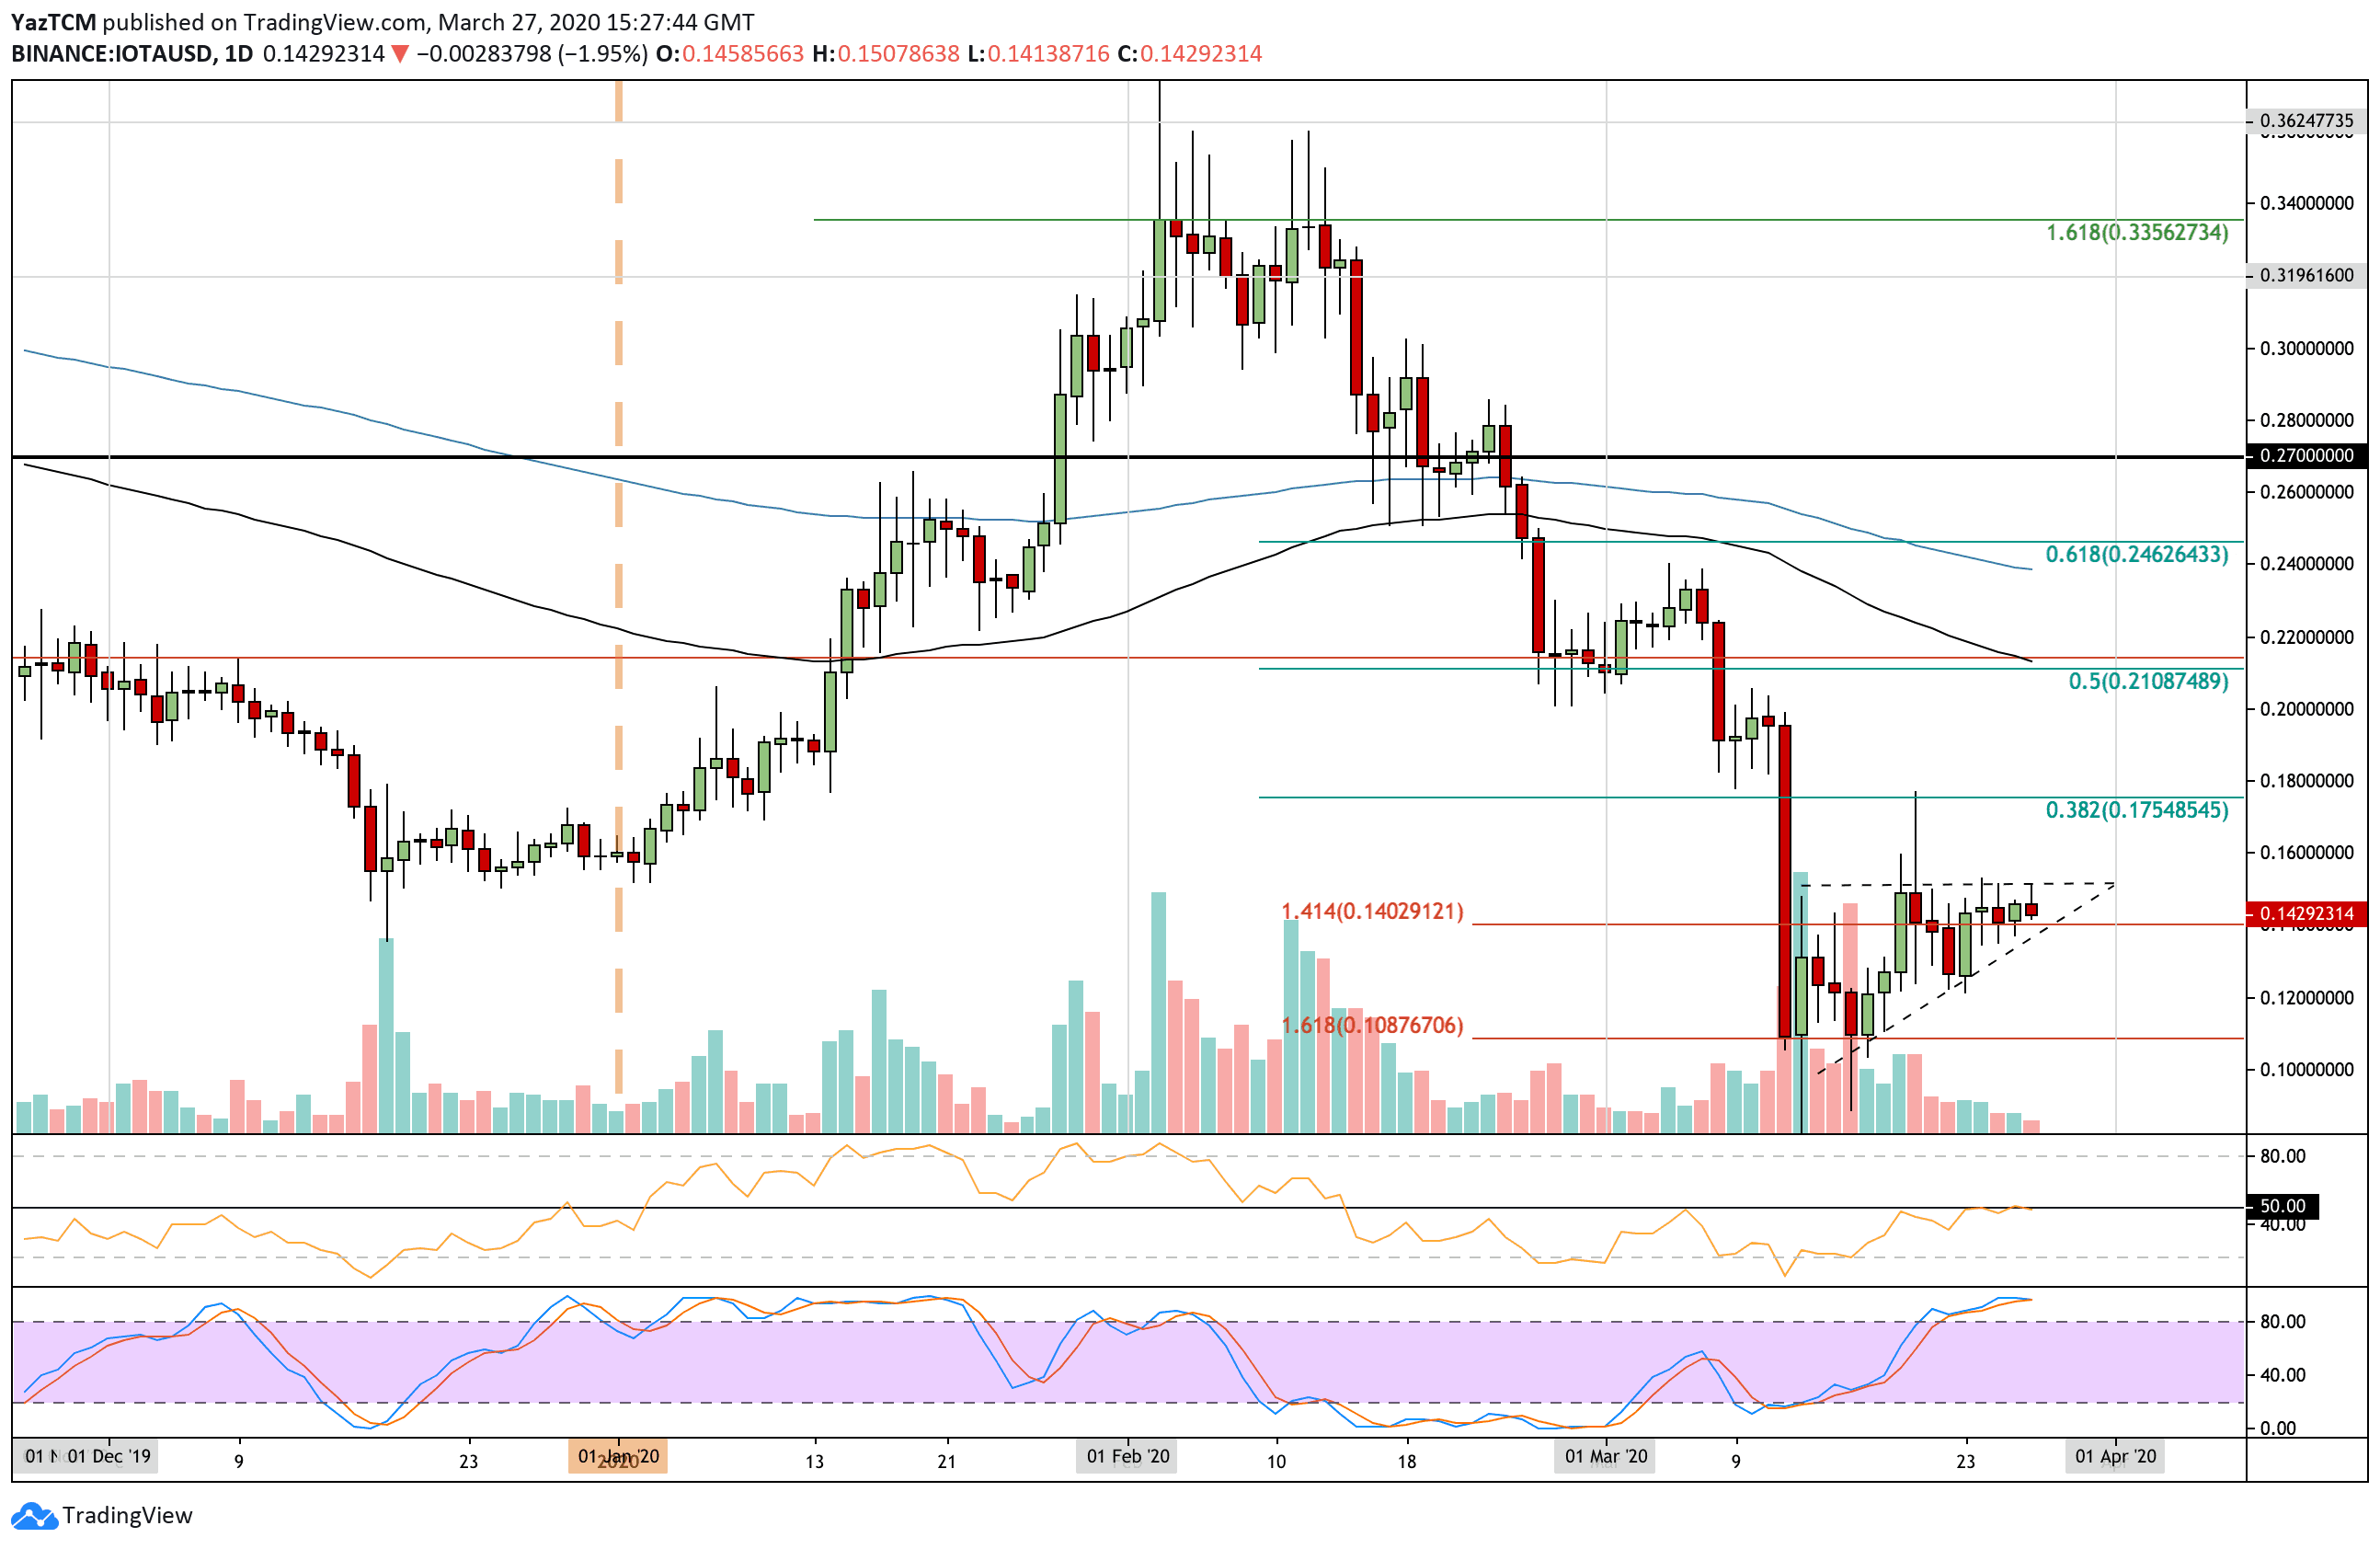
IOTA has increased by around 8% this week, but it is trapped within an ascending triangle pattern. It is struggling at the resistance of $0.151 and must break here to head higher.
From above, if the buyers break $0.151, resistance is expected at $0.16 and $0.175 (bearish .382 Fib Retracement). This is followed by resistance at $0.18 and $0.20.
From below, support lies at $0.14 and the rising trend line. Beneath this, support is located at $0.12, $0.108, and $0.10.
Against Bitcoin, IOTA dropped into a fresh 2020 low at the 2100 SAT level. This level provided strong support for the market during August 2019 and should hold the market moving forward.
If 2100 SAT breaks, support lies at 2000 SAT, 1850 SAT (downside 1.272 Fib Extension), 1900 SAT, and 1885 SAT.
On the other side, resistance lies at 2200 SAT. Above this, resistance lies at 2300 SAT, 2460 SAT (bearish .236 Fib Retracement), and 2600 SAT (100-days EMA).