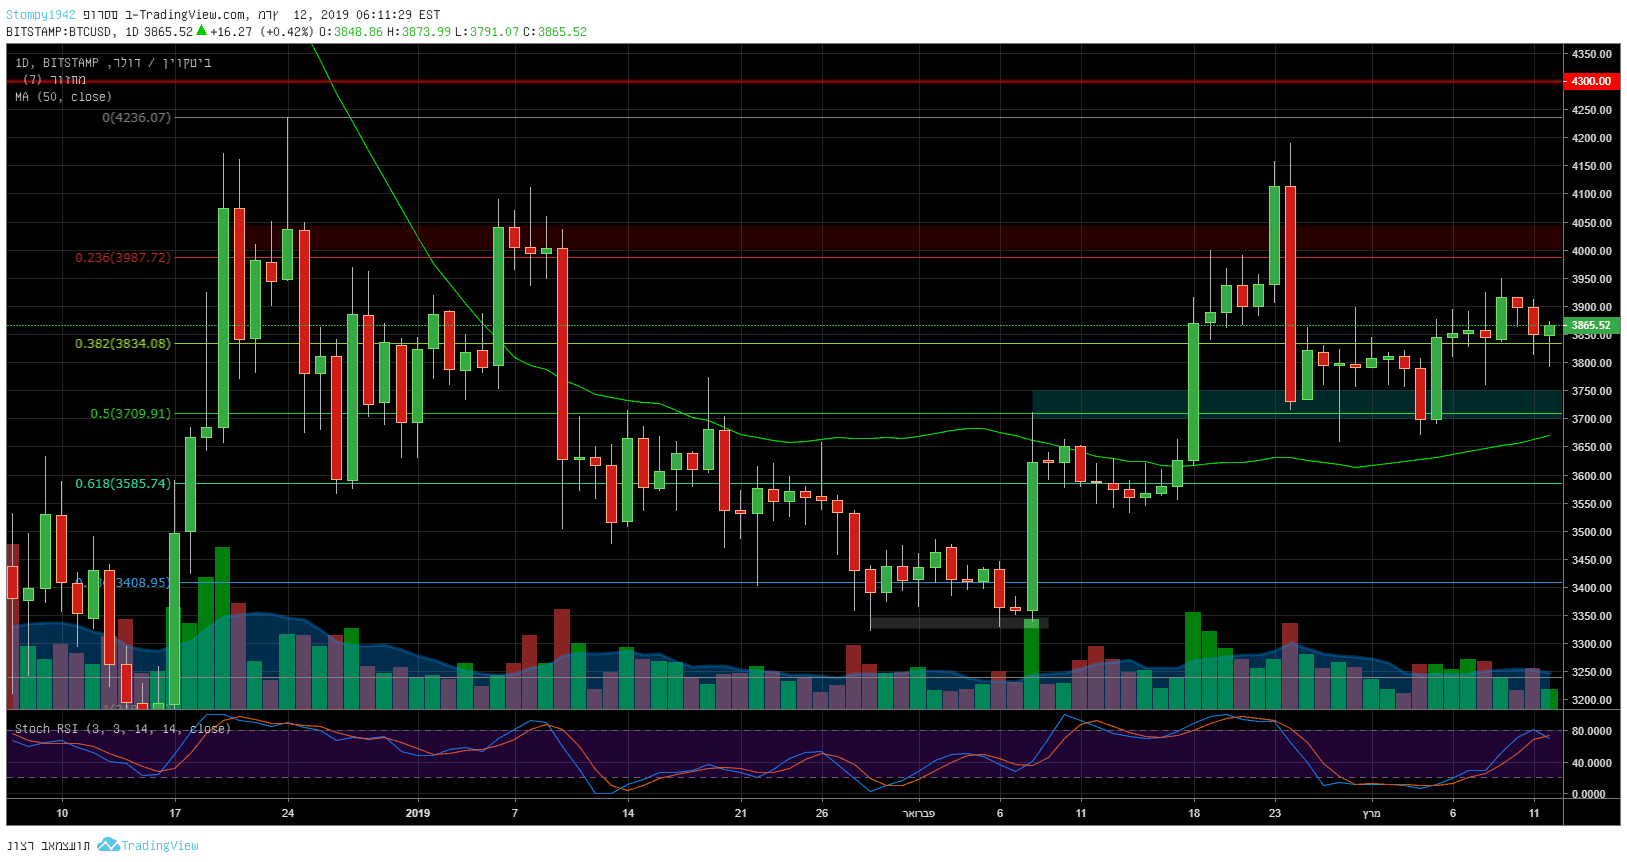
Resistance at $3,900 is being tested, and it seems easier to break it in relation to the resistance around $4,200 where we saw more extreme reactions and where the next test will be. Support holds around $3,700 and provides positive confirmation for the uptrend. In addition, we can see that RSI is trying to break the 80 points and support holds above the 50-days MA.
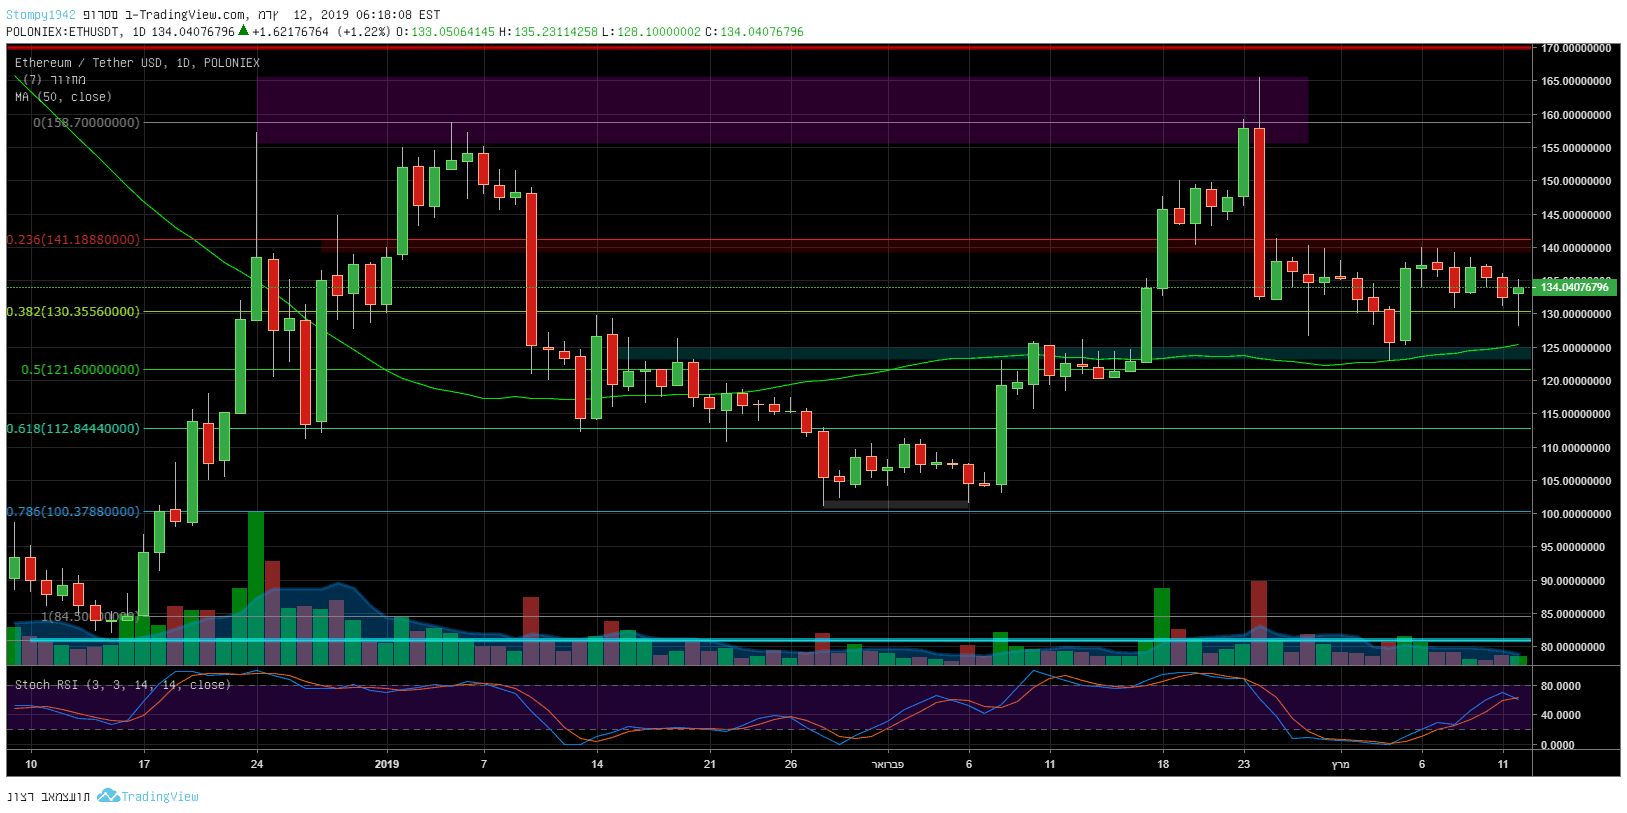
Against the dollar, the support at $125 is based on over 50MA. Resistance at $140 and a double top pattern appears on the daily chart, and the RSI is pointing up.
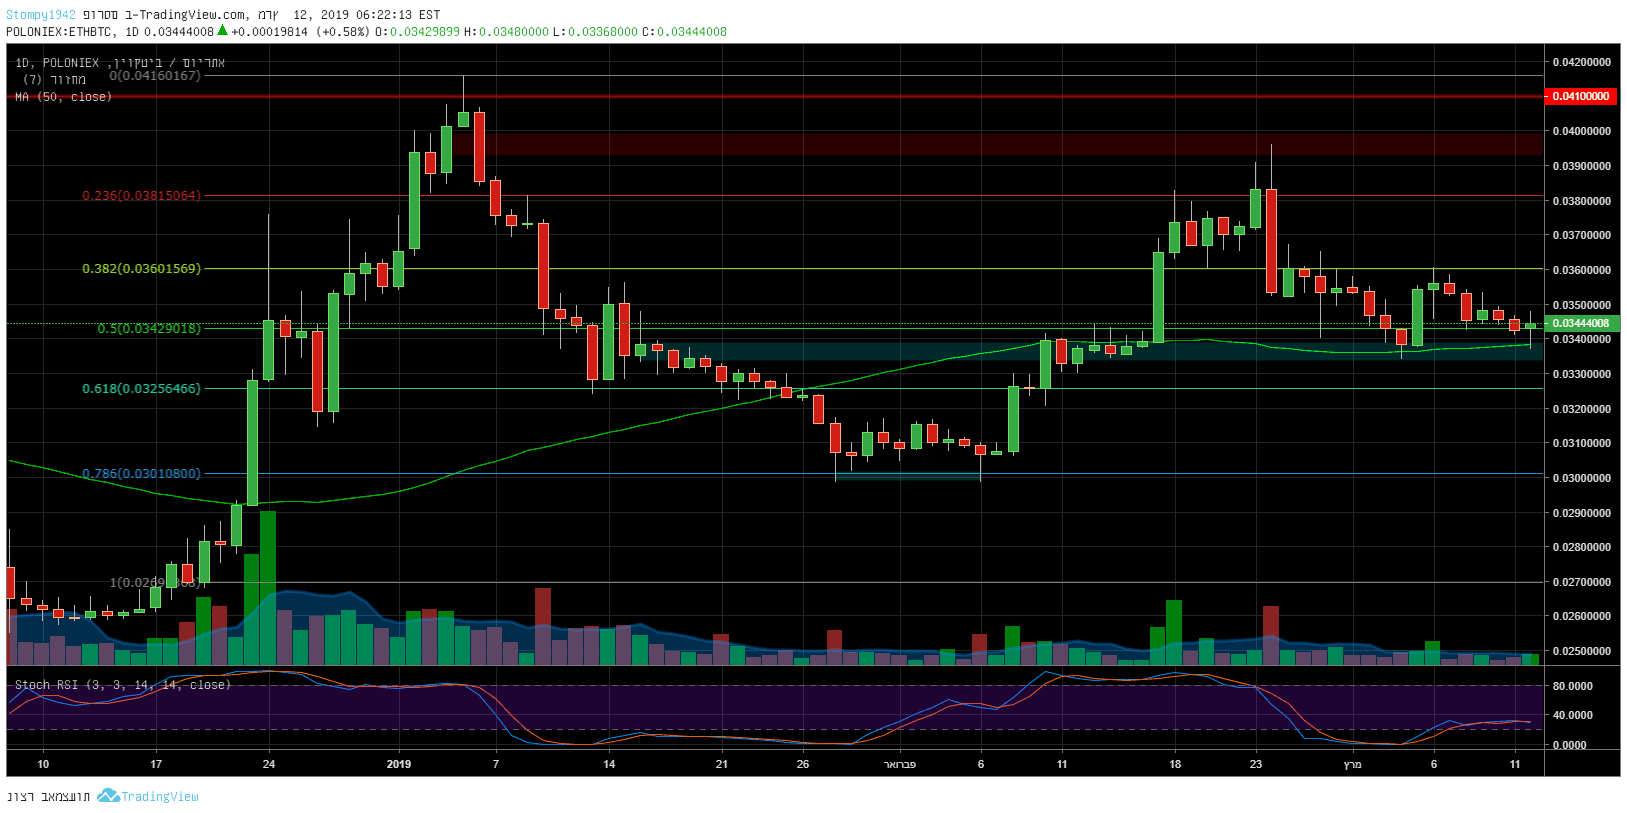
Against Bitcoin, the image is somewhat similar to the previous graph. Here too, 50MA marks the support. Also, there is a double-top pattern, and the price is above 0.033BTC. Resistance fell to 0.036BTC and further resistance, around 0.04BTC.
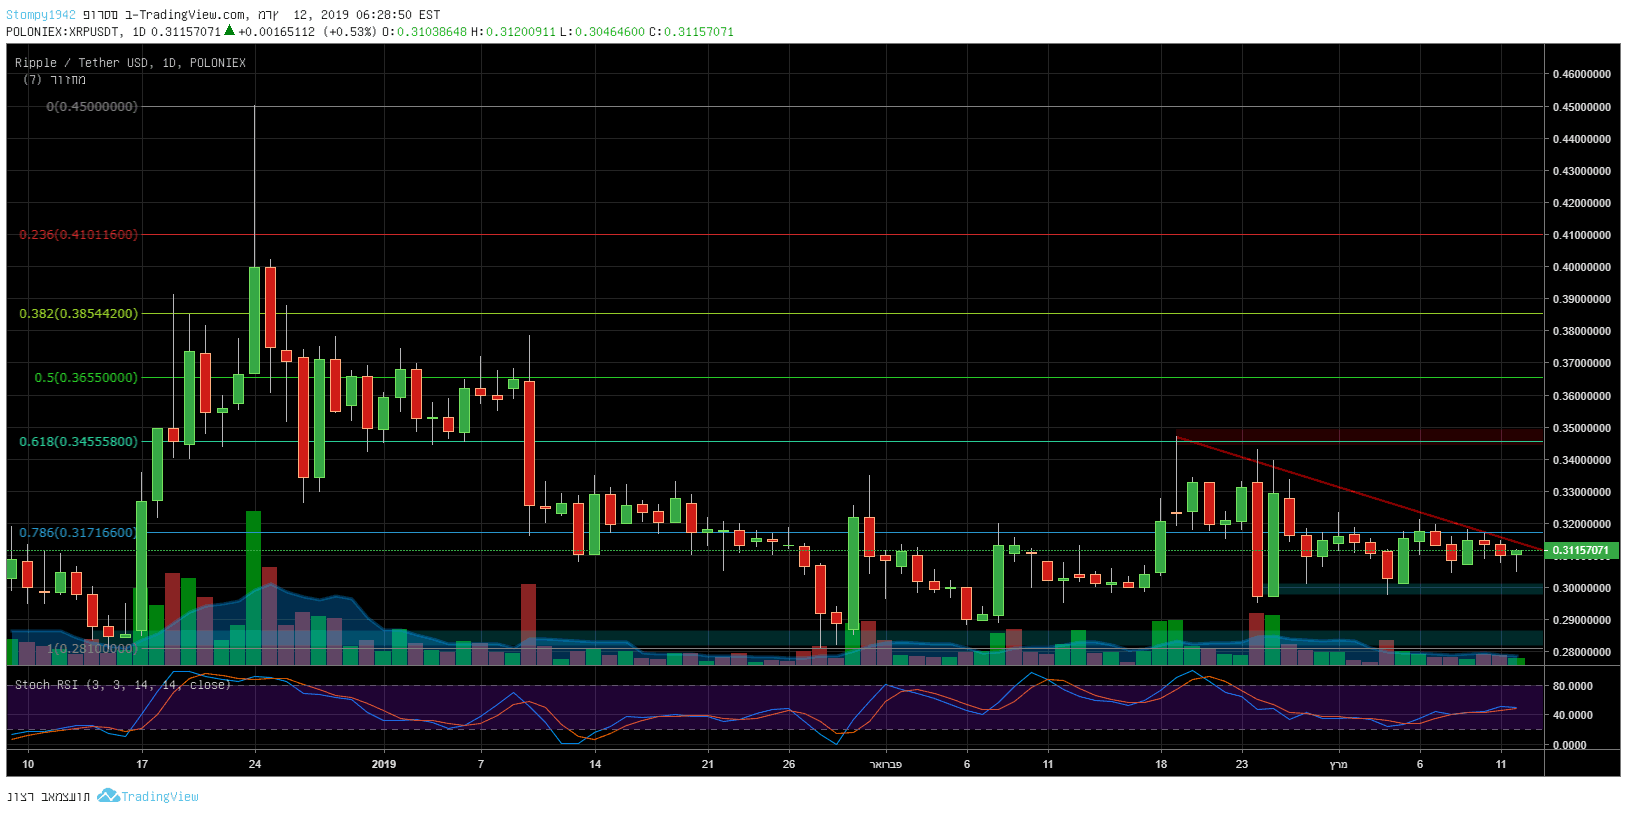
Against the dollar support around $0.30 holds another week. Resistance at $0.32, after the previous resistance was at $0.35 and the market reaction lowered the price to test the support.
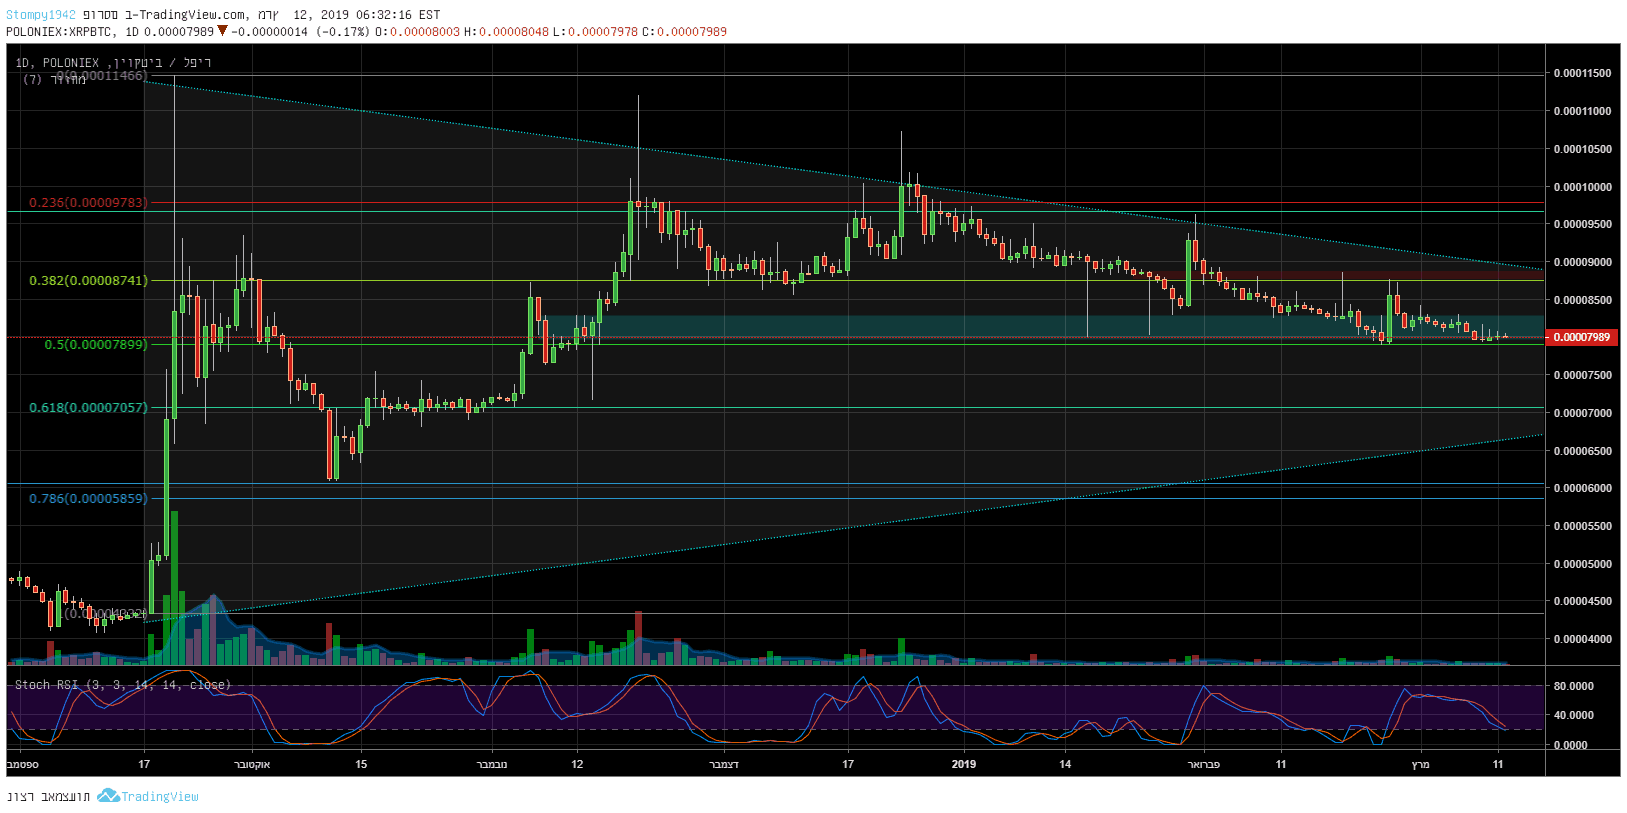
Against Bitcoin, we returned to the support areas within the range of 7,900-8,200SAT. If we break above or below these levels, we will get an indication of where the market is heading. Volatility is decreasing but there is still a lot of uncertainty about the general direction, and it should be noted that the RSI is very low.
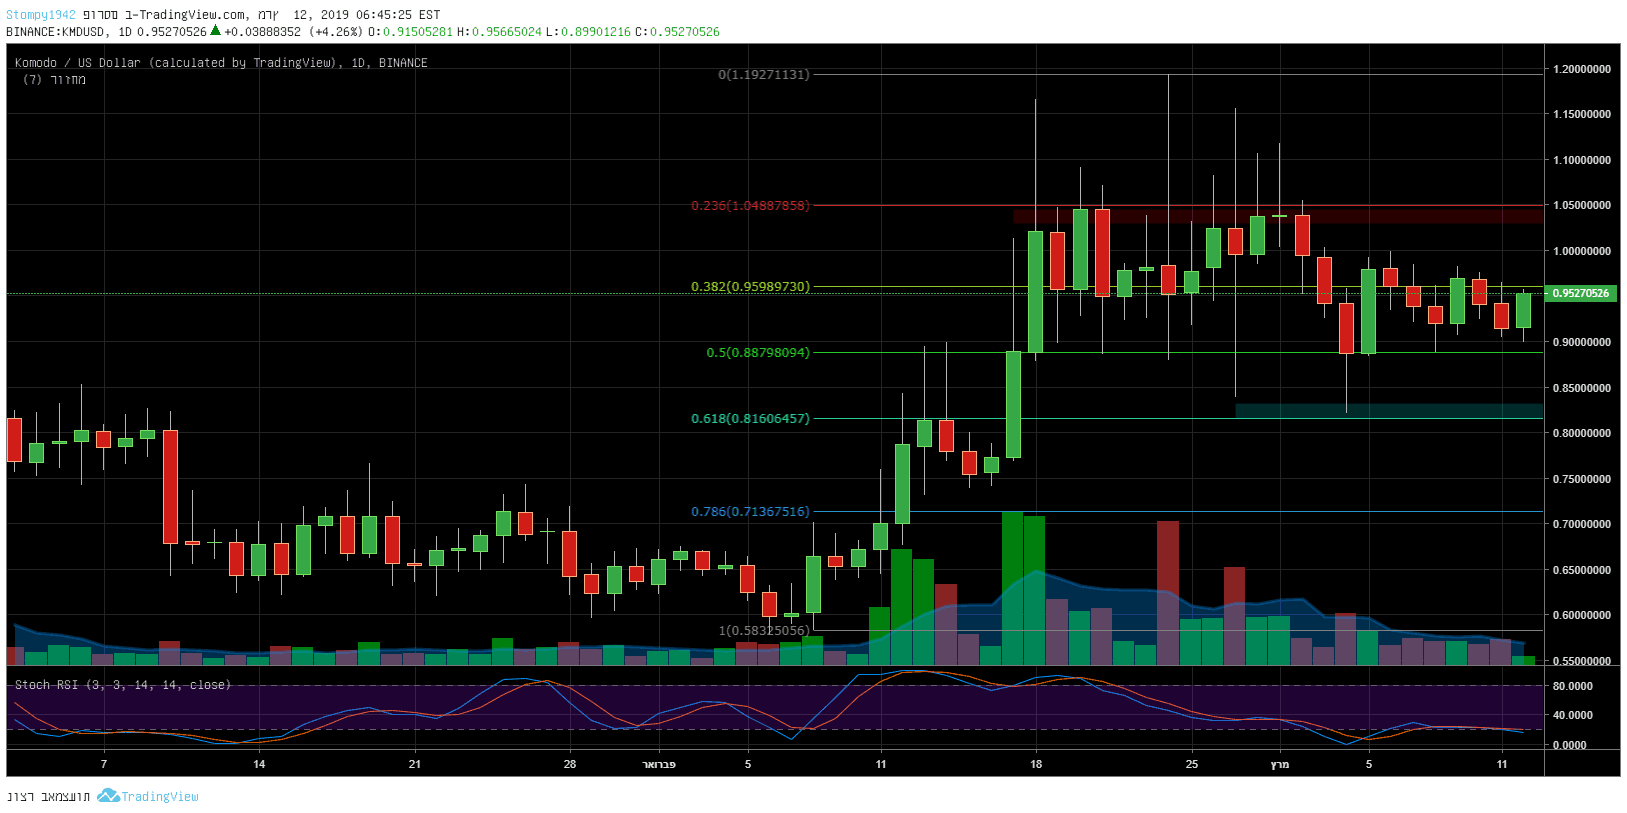
Against the dollar, it has seen an increase in trading volume since the beginning of February, which led to a bullish trend in an attempt to breach the $1 where it is now traded after encountering resistance at $1.20 and returned to test support around $0.80. In addition, the RSI is low.
Against Bitcoin, the story on the graph begins to look interesting. From August 2018 to February, the price failed to breach the 0.00022BTC levels, until recently there was an attempt to reverse the trend, and the resistance broke out and turned into support. Resistance in the new range stands around 0.00025BTC.
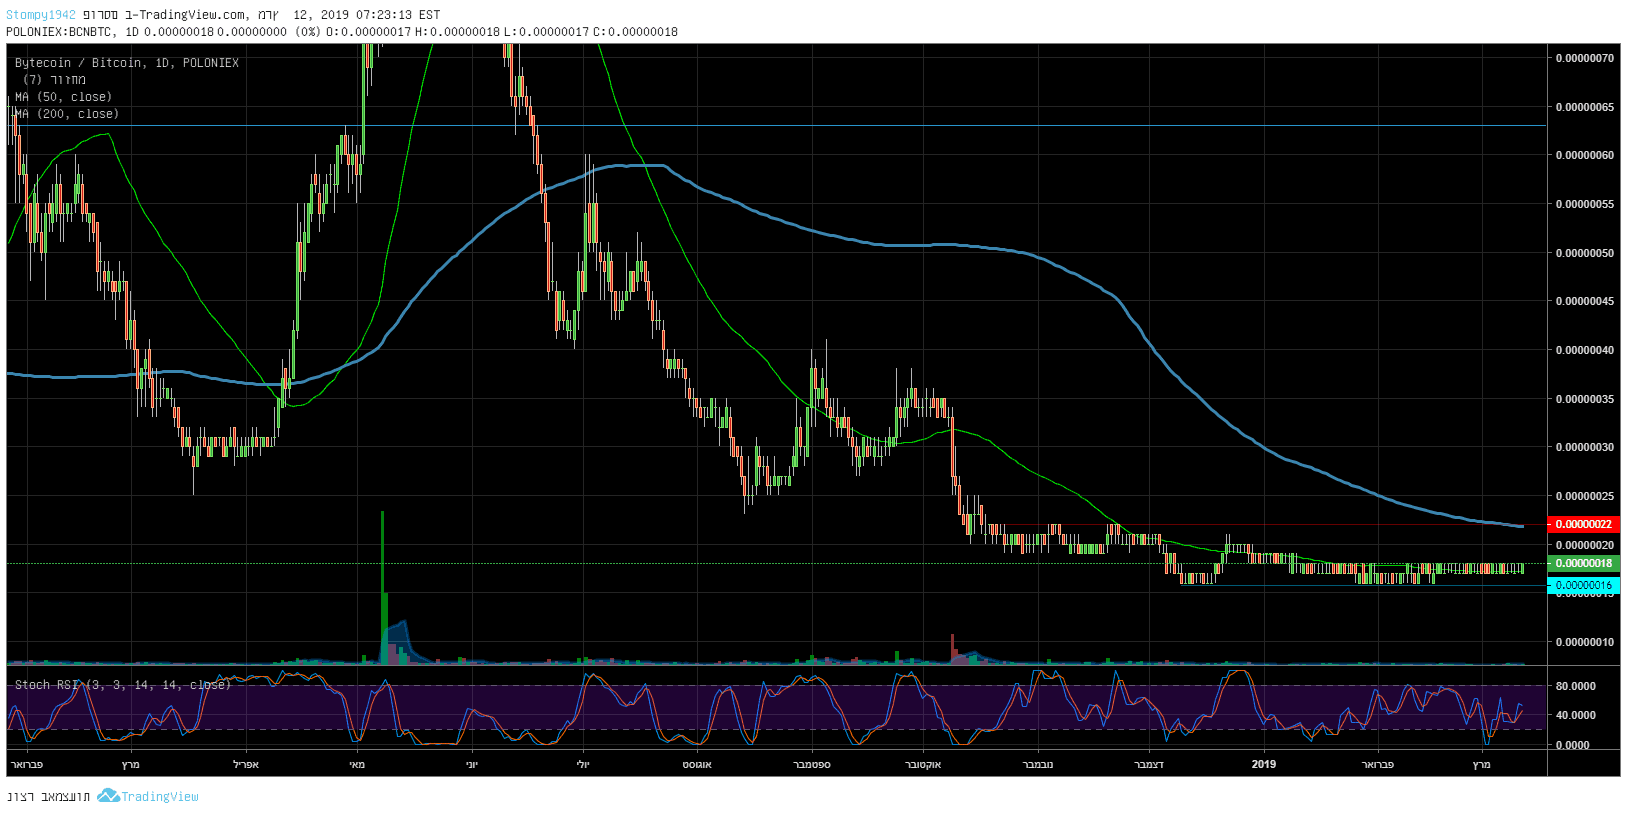
Against Bitcoin, a daily chart trades in a range of 16-18SAT, which is based on 50MA. In this range, resistance on 22 SAT is at 200MA after a sharp correction.