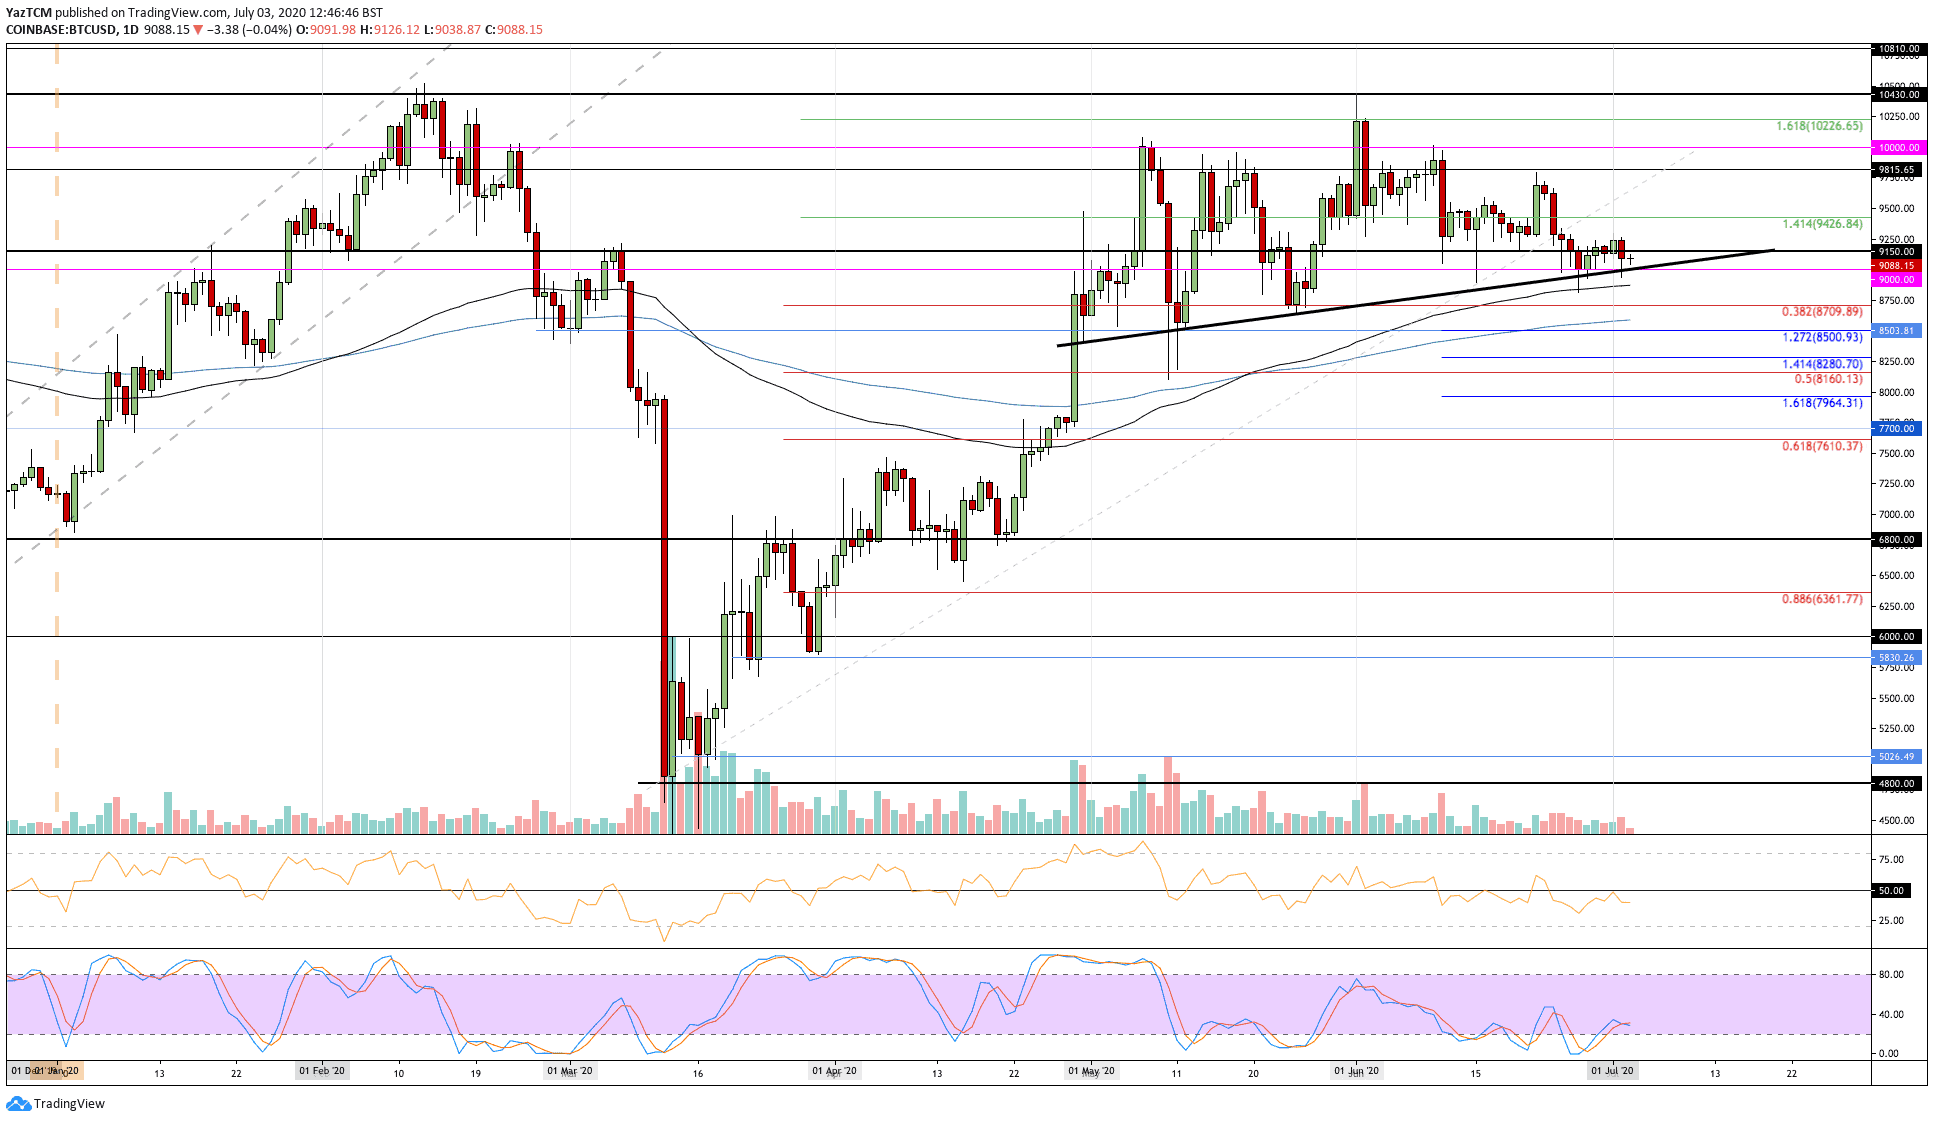
Bitcoin pretty much moved sideways this week after slipping by a small 1%. While predominantly trading in a tight range, BTC did slip beneath a critical level on a couple of occasions but has managed to recover.
Last week, Bitcoin fell beneath a rising trend line formation that had been in play since mid-March. This provided the first alert that the uptrend could be stalling. This week, BTC has found support at a shorter termed rising trend line, adding to the strength of the support at $9,000.
Looking ahead, if the sellers push BTC beneath $9,000, then it would be a sign that they are looking to take charge of the market momentum. The first level of support lies at $8,800 (100-days EMA). Beneath this, added support is found at $8,709 (.382 Fib Retracement), and $8,500 (200-day EMA).
On the other side, the first level of resistance lies at $9,150. This is followed by $9,450, $9,815, and $10,000.
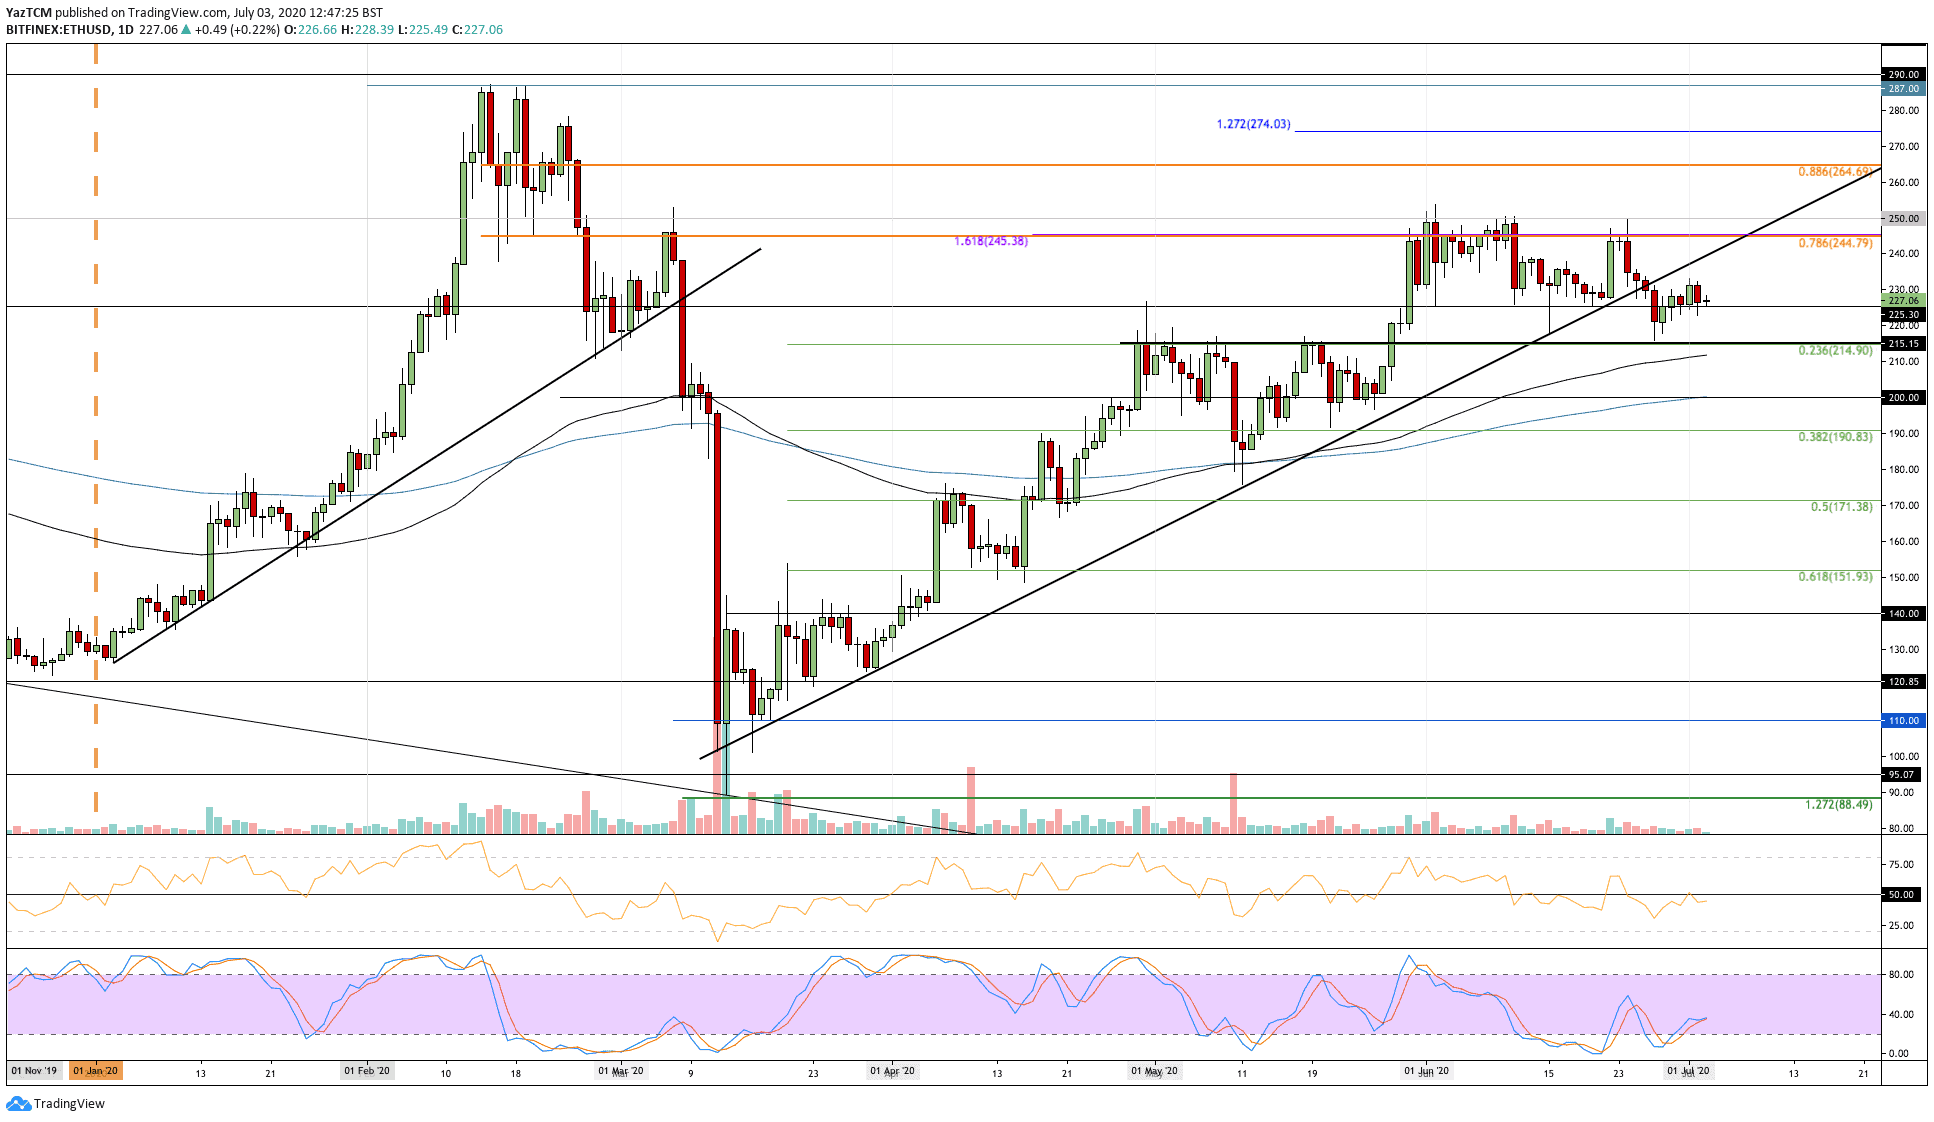
Ethereum saw a 1,61% price drop over the past week as it trades at $227. Last week, the coin also fell beneath a rising trend line that has been in play since mid-March 2020. After that, ETH headed lower until it found support at $215 (.236 Fib Retracement).
Luckily, ETH rebounded from there this week as it headed higher above the $225 level. Moving forward, if the sellers push beneath $225, the first level of support lies at $215 (.236 Fib Retracement). The next selling targets are found at $210 (100-day EMA) and $200 (200-day EMA).
On the other side, if the buyers push higher, the first level of resistance lies at $245 (bearish .786 Fib Retracement). This is followed by added resistance at $250 and $265 (bearish .886 Fib Retracement).
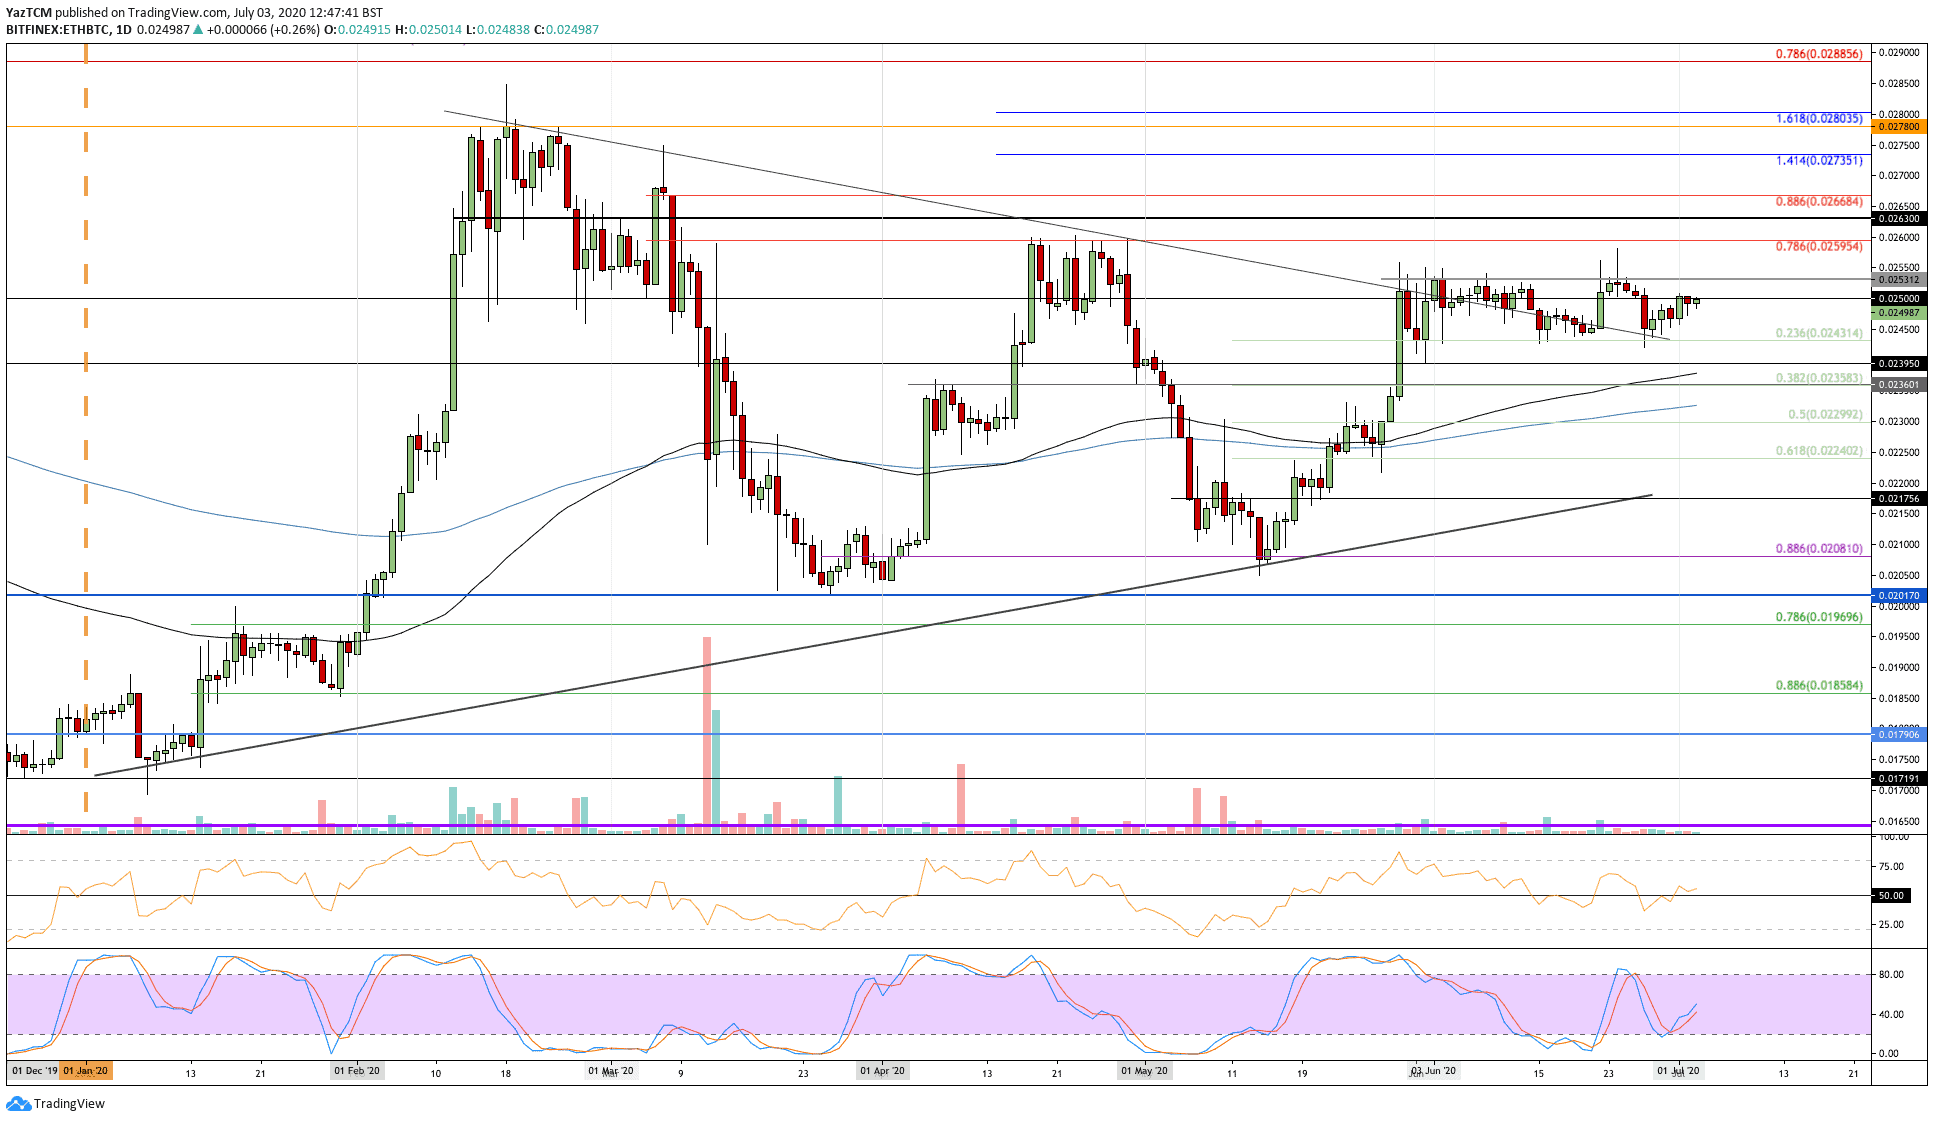
Against Bitcoin, ETH moved sideways this week as it trades beneath the 0.025 BTC level. At the start of the week, it dropped below 0.025 BTC as it headed lower toward the support at 0.0243 BTC (.236 Fib Retracement).
ETH rebounded from there as it pushed back into the resistance at the 0.025 BTC level. Looking ahead, if the buyers climb above 0.025 BTC, resistance is expected at 0.0253 BTC. Beyond this, added resistance lies at 0.026 BTC (bearish .786 Fib Retracement) 0.0263 BTC.
On the other side, the first level of support lies at 0.0243 BTC (.236 Fib Retracement). Beneath this, added support is found at 0.0239 BTC and 0.0235 BTC (.382 Fib Retracement).
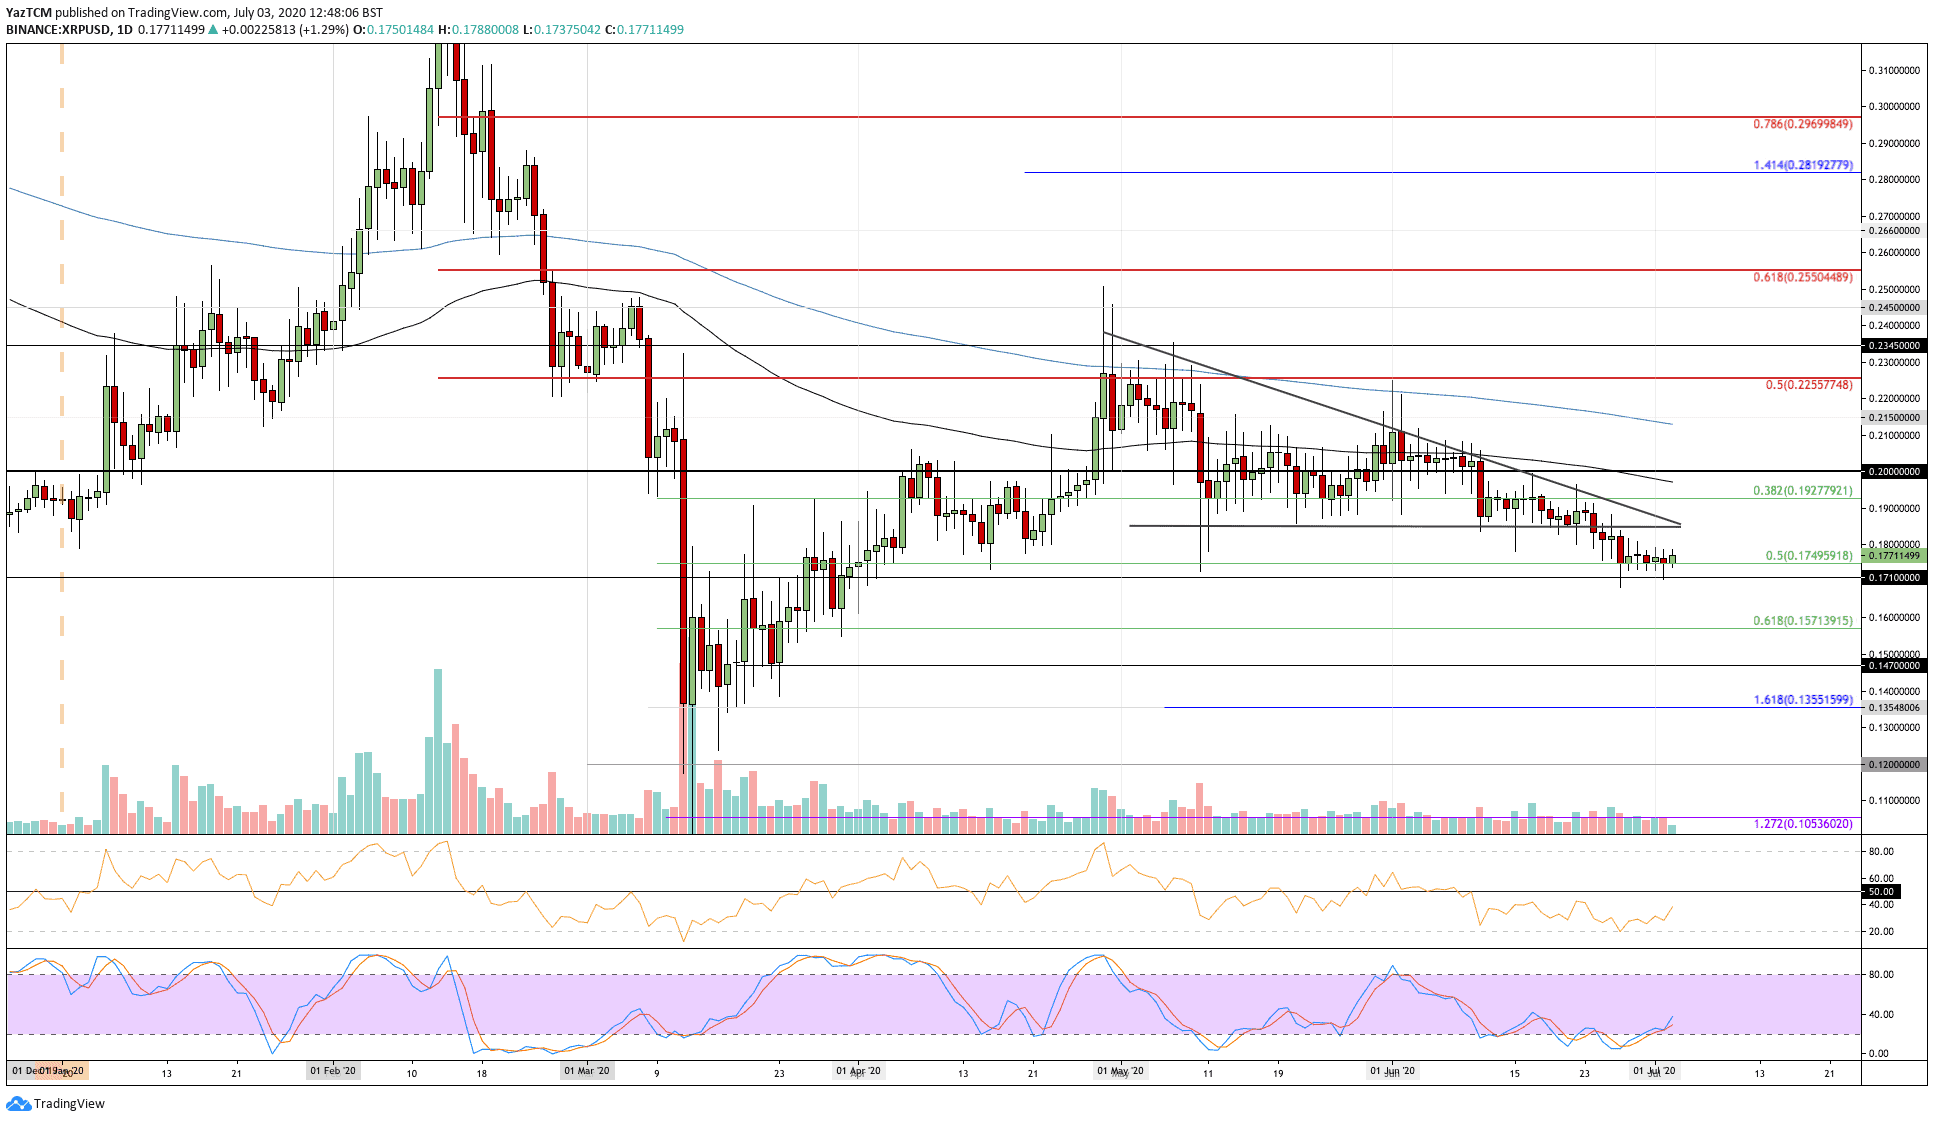
XRP saw a small 3% price decline for the past week as the coin drops into the $0.175 support, provided by a .5 Fib Retracement. The coin had fallen beneath a descending triangle formation last week, which caused XRP to head lower into the support at $0.175.
The bulls have been defending this support throughout the entire week as XRP manages to close above $0.175 every day.
Looking ahead, if the sellers push beneath $0.175, the first level of support lies at $0.171. Beneath this, added support is located at $0.157 (.618 Fib Retracement) and $0.15.
On the other side, if the bulls can rebound from $0.175, resistance is expected at $0.18, $0.19, and $0.20.
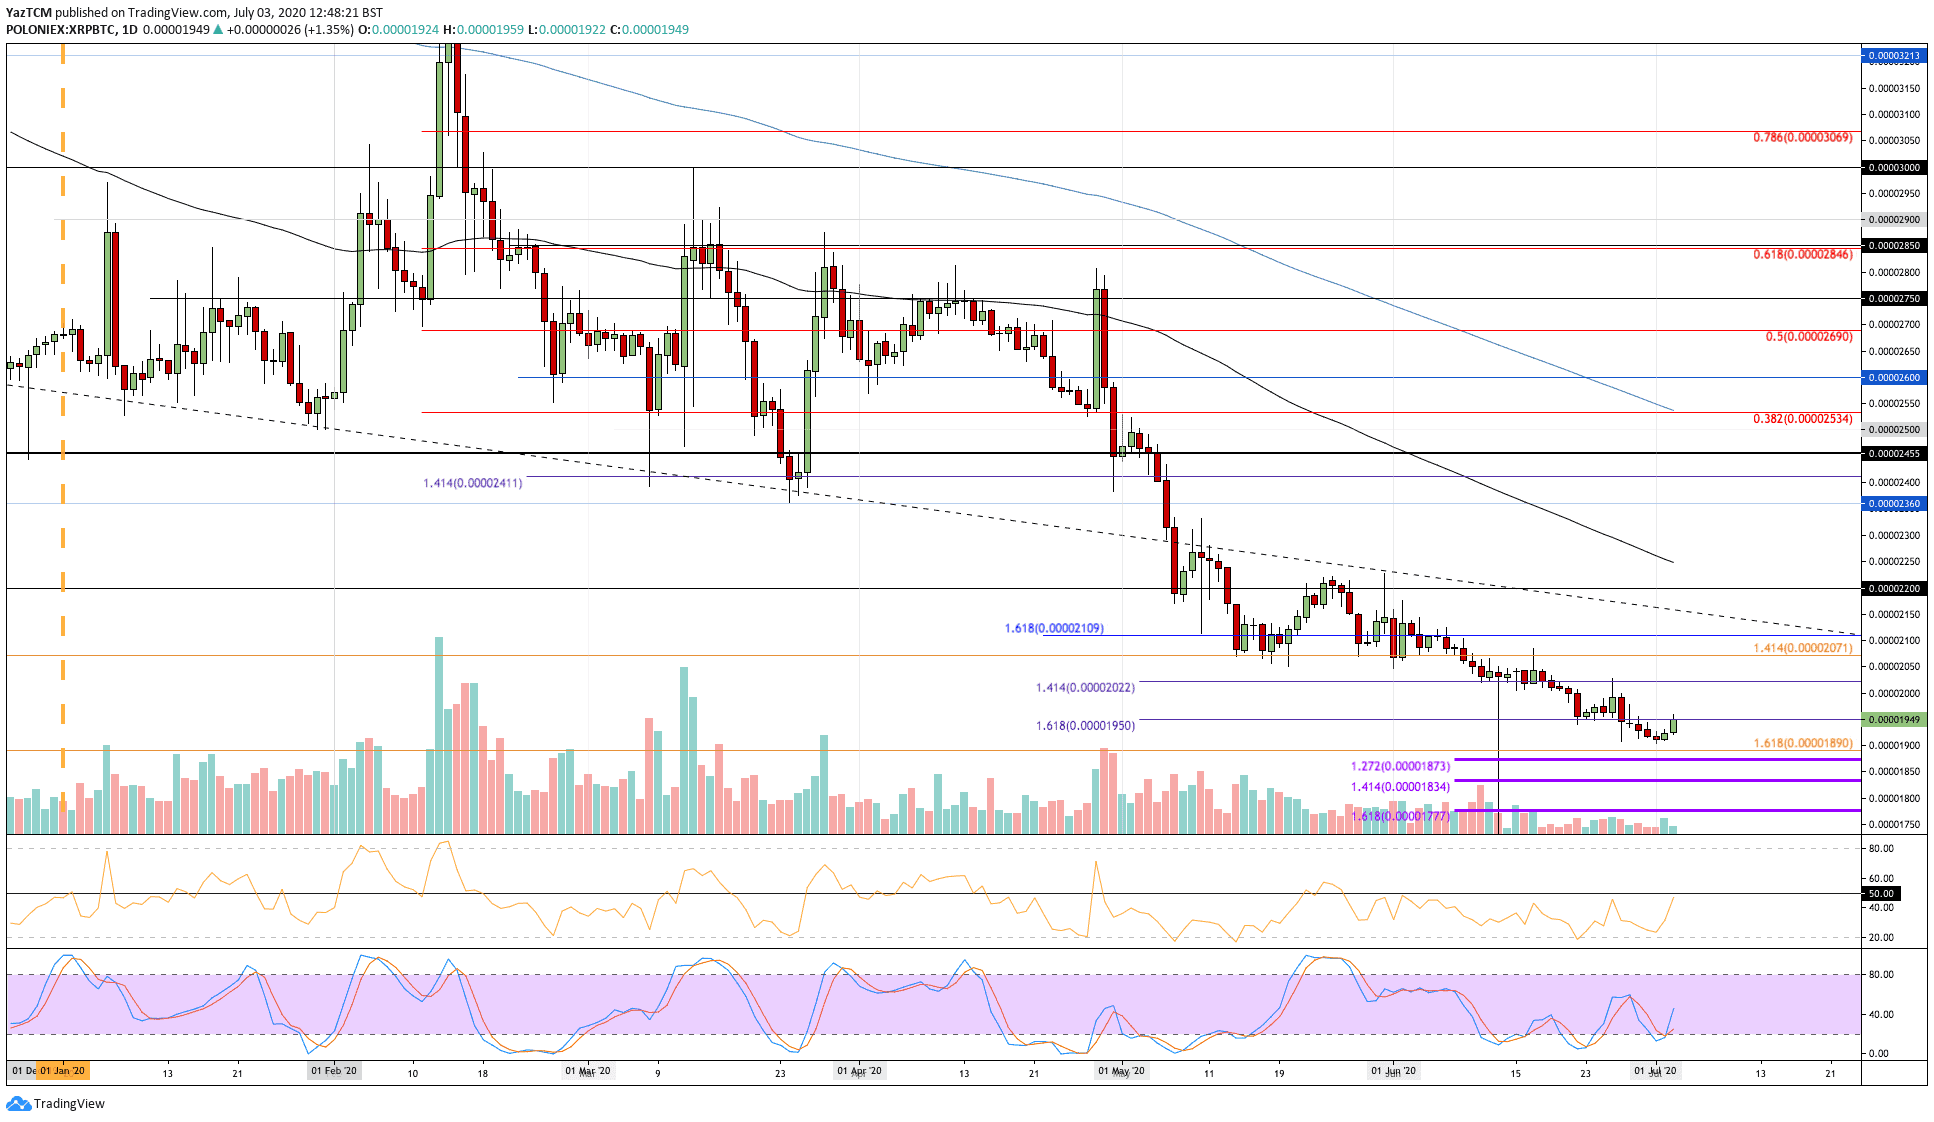
Against Bitcoin, the situation is extremely dire for XRP as it continued to make fresh 2-year price lows this week. The coin was trading at the 2000 SAT level at the start of the week, but it started to push lower.
It quickly broke the support at 1950 SAT and headed toward 1900 SAT. Luckily, it rebounded from here and has returned to 1950 SAT.
Looking ahead, if the sellers push lower again, the first level of support lies at 1900 SAT. Beneath this, added support is found at 1890 SAT, 1873 SAT, and 1843 SAT.
On the other side, if the buyers break above 1950 SAT, resistance lies at 2000 SAT, 2071 SAT, and 2100 SAT.
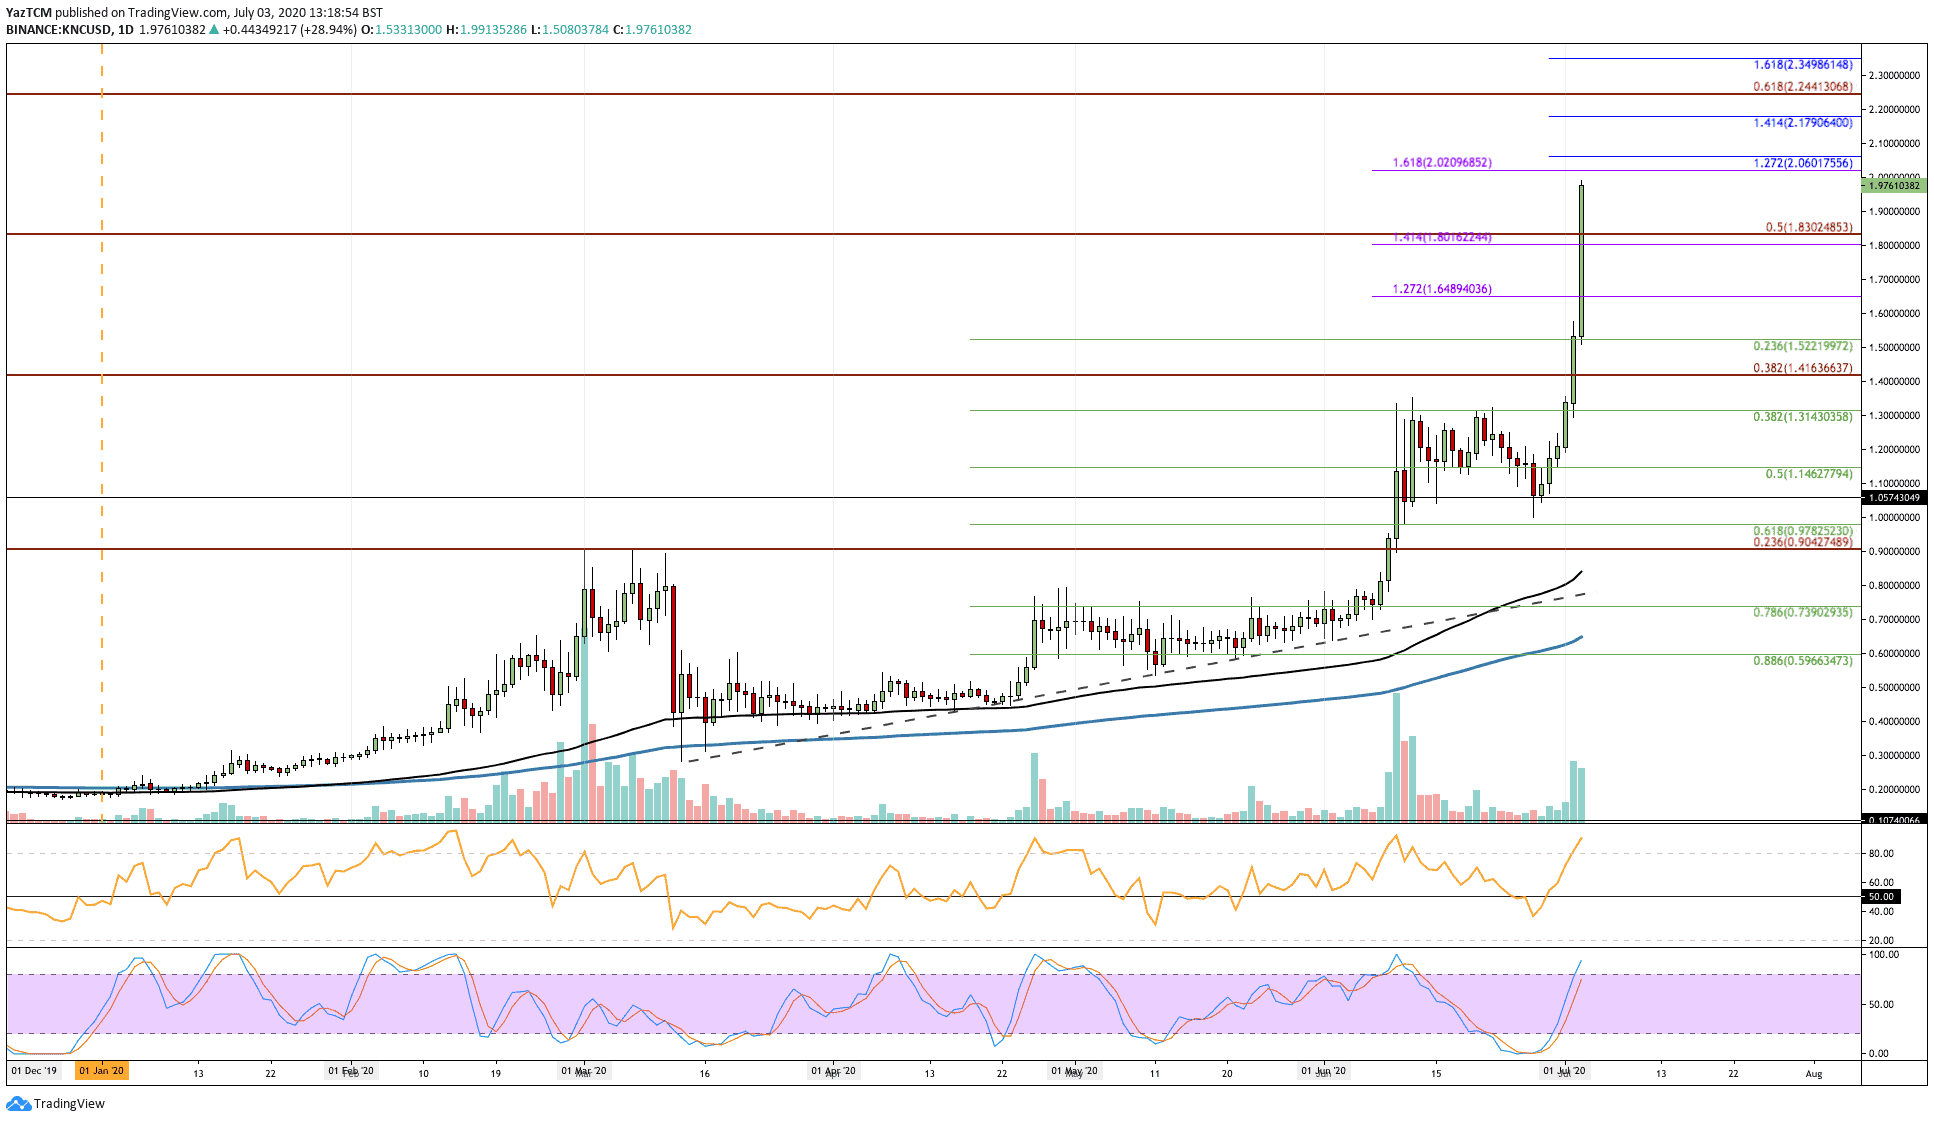
Kyber Network saw a price explosion of 62% this week, which allowed it to hit the $2.00 level. The cryptocurrency started the week off by trading at the $1.05 level as it pushed higher towards the end of June 2020.
The coin continued higher in July as it broke above resistance at $1.41 and continued higher above added resistance at $1.82 to reach the $2.00 level.
Looking ahead, if the buyers can head further above $2.00, resistance is expected at $2.06, $2.17, and $2.24 (bearish .618 Fib Retracement level).
On the other side, if the sellers push lower, the first level of support lies at $1.80. This is followed by support at $1.55 (.236 Fib Retracement), $1.40, and $1.31 (.382 Fib Retracement).
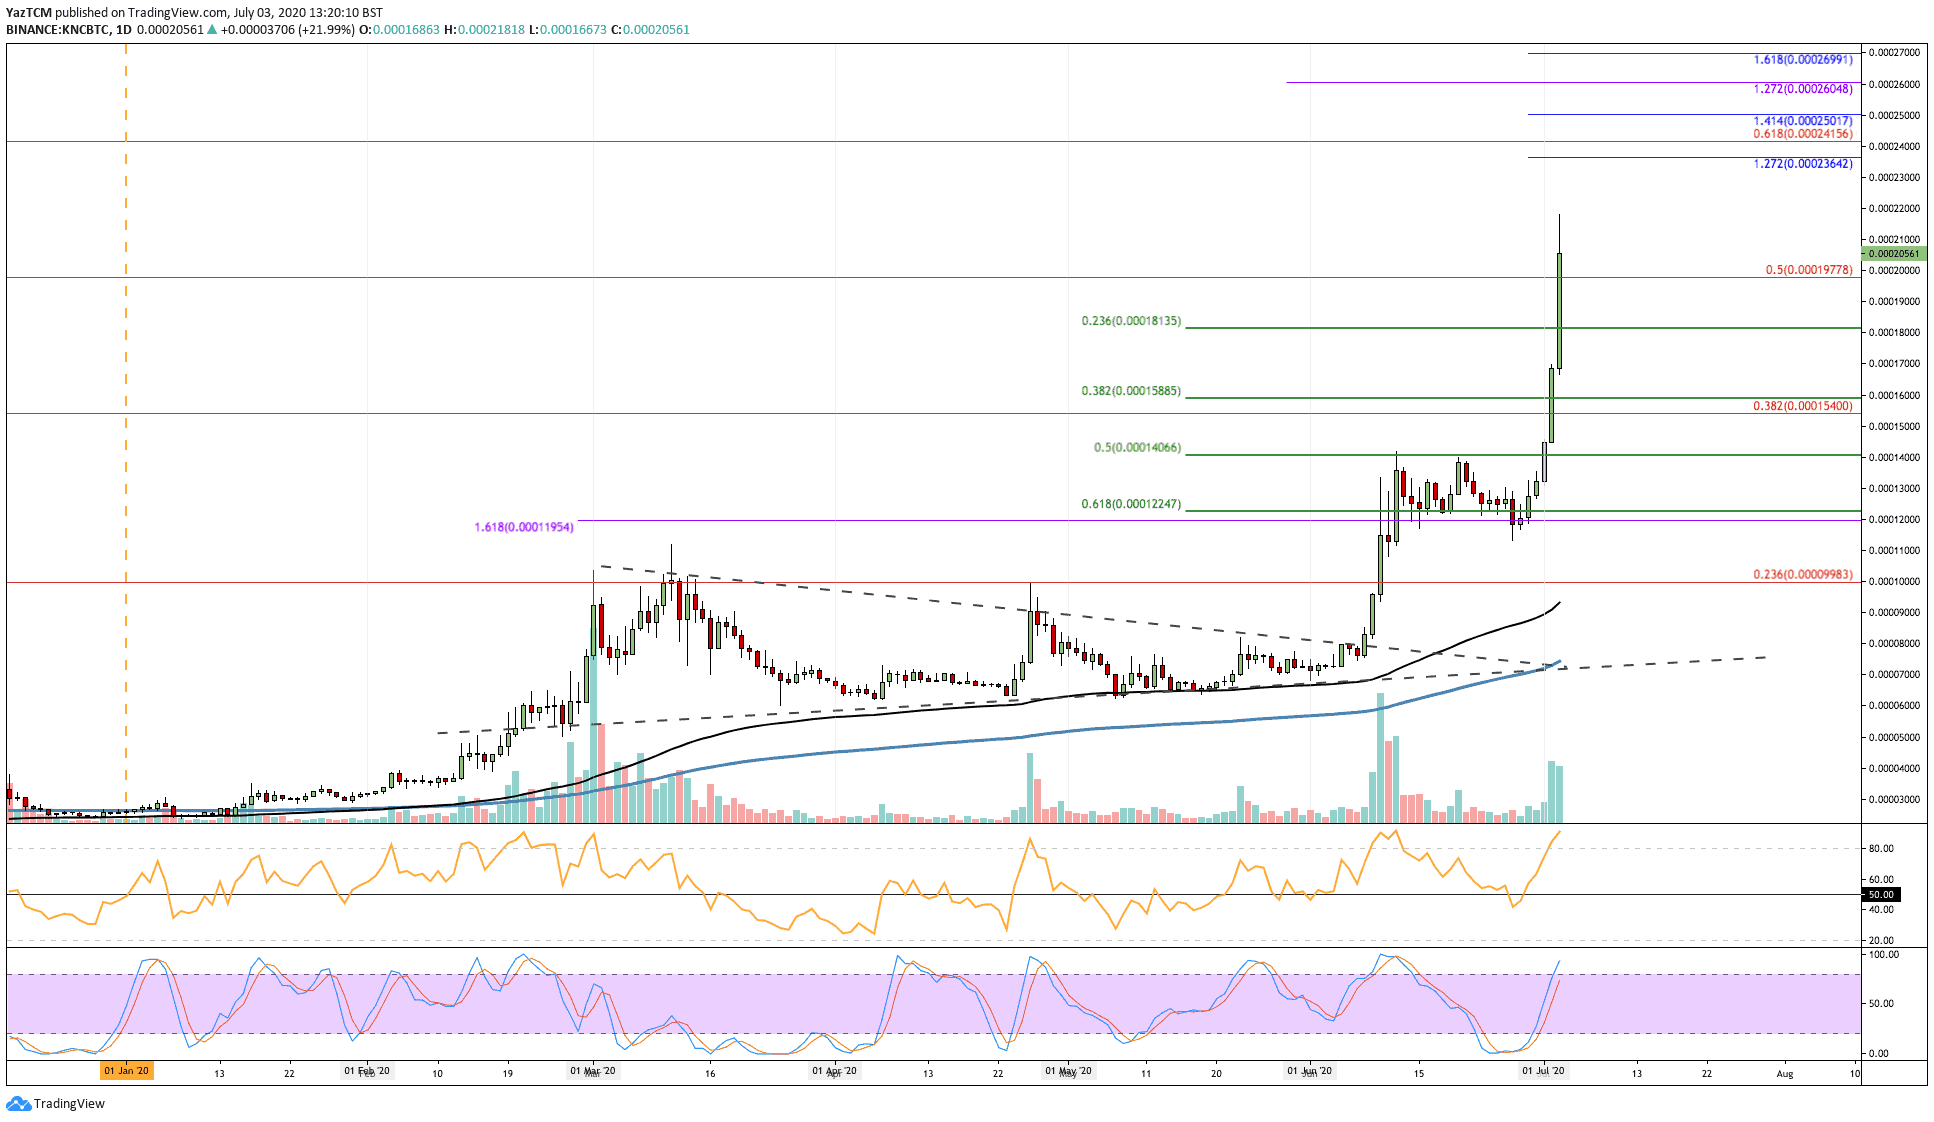
Against Bitcoin, KNC has also been surging higher. It reached 14,000 SAT by the end of June and continued above during the first three days of July as it pushed to the resistance at 15,400 SAT to reach the current 20,560 SAT level.
Looking ahead, if the buyers continue to drive higher, the first level of resistance lies at 22,000 SAT. Above this, resistance is expected at 24,150 SAT (bearish .618 Fib Retracement), 25,000 SAT, and 26,000 SAT.
On the other side, if the sellers push lower, support is found at 20,000 SAT, 18,130 SAT (.236 Fib Retracement), and 13,885 SAT (.382 Fib Retracement).
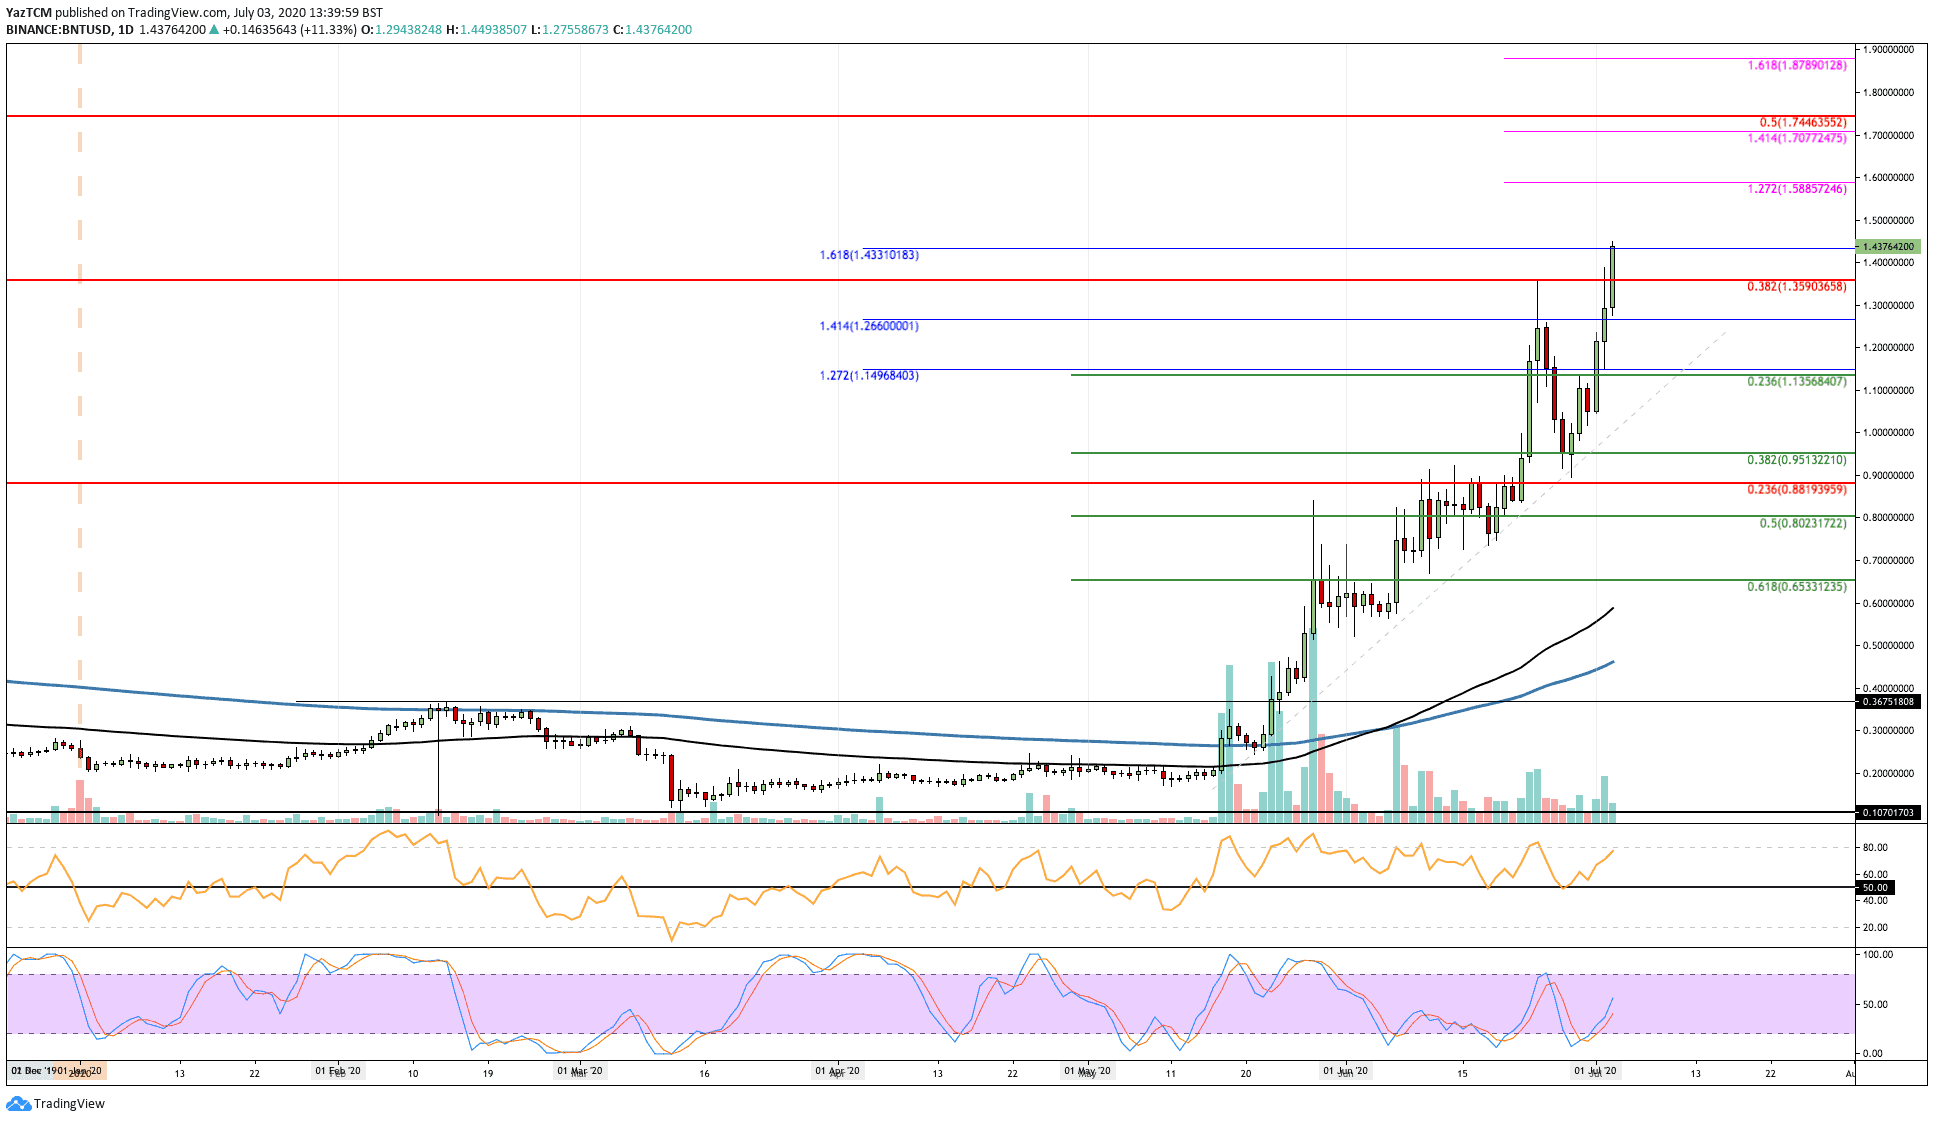
Bancor saw a 34% price hike this week as the cryptocurrency reached the $1.43 resistance level. The coin started the week at $0.95.
In July, BNT pushed further to break the June 2020 resistance at $1.35 (bearish .382 Fib Retracement) and reach the $1.43 level.
Moving forward, if the bulls break the $1.50 level, higher resistance lies at $1.58 (1.272 Fib Extension), $1.74 (bearish .5 Fib Retracement), and $1.87 (1.618 Fib Extension).
On the other hand, if the sellers push lower, support lies at $1.26, $1.13 (.236 Fib Retracement), $1.00, and $0.95 (.382 Fib Retracement).
Against Bitcoin, BNT has also been surging. The coin was trading at 10,500 SAT at the start of the week before it pushed higher. The coin broke the June 2020 resistance at 14,000 SAT, and it passed above 14,500 SAT (bearish .618 Fib Retracement) to reach the current 15,880 SAT level.
Looking ahead, if the bulls continue higher, the first level of resistance lies at 16,358 (1.272 Fib Extension). Above this, resistance lies at 18,000 SAT (bearish .786 Fib Retracement), 19,000 SAT, and 19,975 SAT (bearish .886 Fib Retracement).
Alternatively, if the sellers step in, support lies at 14,000 SAT, 12,500 SAT (.236 Fib Retracement), and 10,500 SAT (.382 Fib Retracement).