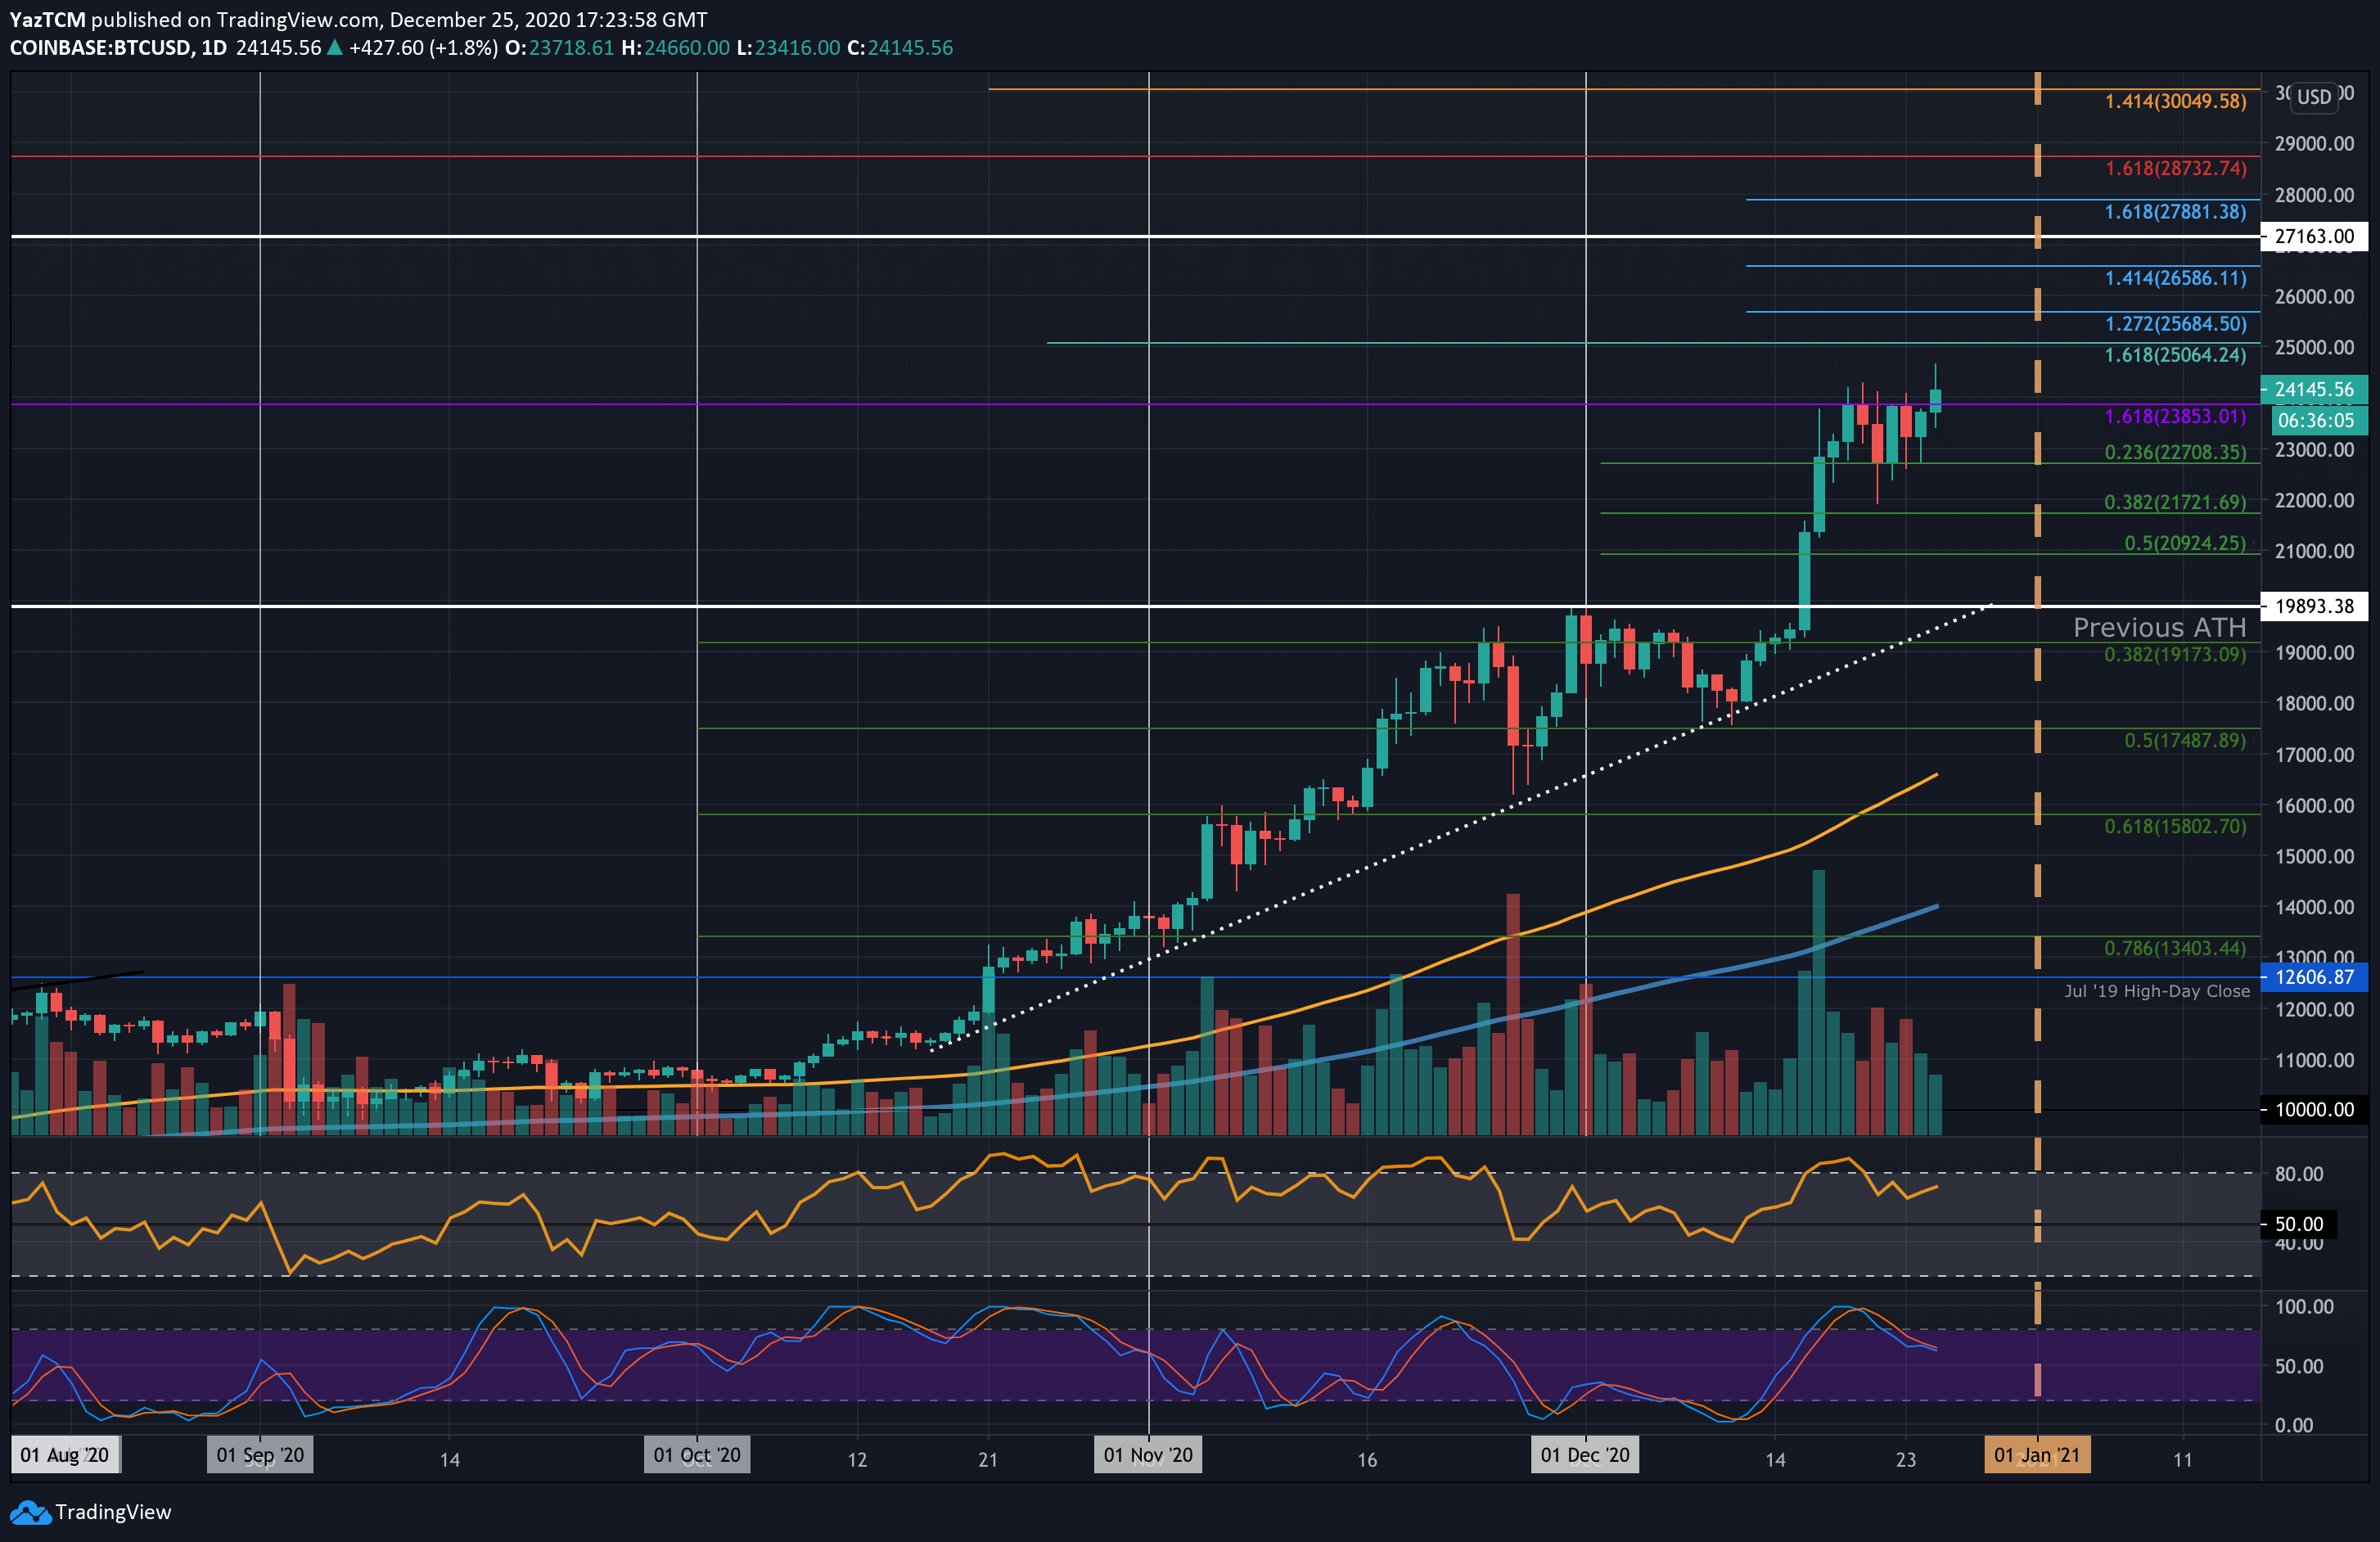
Bitcoin saw a further 7.5% price surge over the past week, with today’s 5% price hike putting it at a new ATH of $24,660. The cryptocurrency had penetrated above $20,000 on December 16th, and it continued to rise last week until it met resistance at $23,853 (1.618 Fib Extension – purple).
The buyers struggled to break this resistance over the last few days as it went on to trade sideways between $23,853 and the support at $22,708 (.236 Fib Retracement).
Bitcoin rebounded from the lower boundary of this range yesterday, and it pushed higher above the $23,853 resistance today to reach the newly created ATH. It has since dropped slightly as it trades at $24,145.
Looking ahead, if the buyers continue to drive higher, the first level of resistance lies at $26,064. This if followed by $25,684 (1.272 Fib Extension), $26,000, $26,568 (1.414 Fib Extension), $27,163, and $27,880 (1.618 Fib Extension).
On the other side, the first level of support now lies at $23,853. This is followed by support at $23,000, $22,708 (.236 Fib), $21,721 (.382 Fib), and $21,000. Added support is found at $20,000, $19,893 (Previous ATH), and $19,173 (long term .382 Fib).
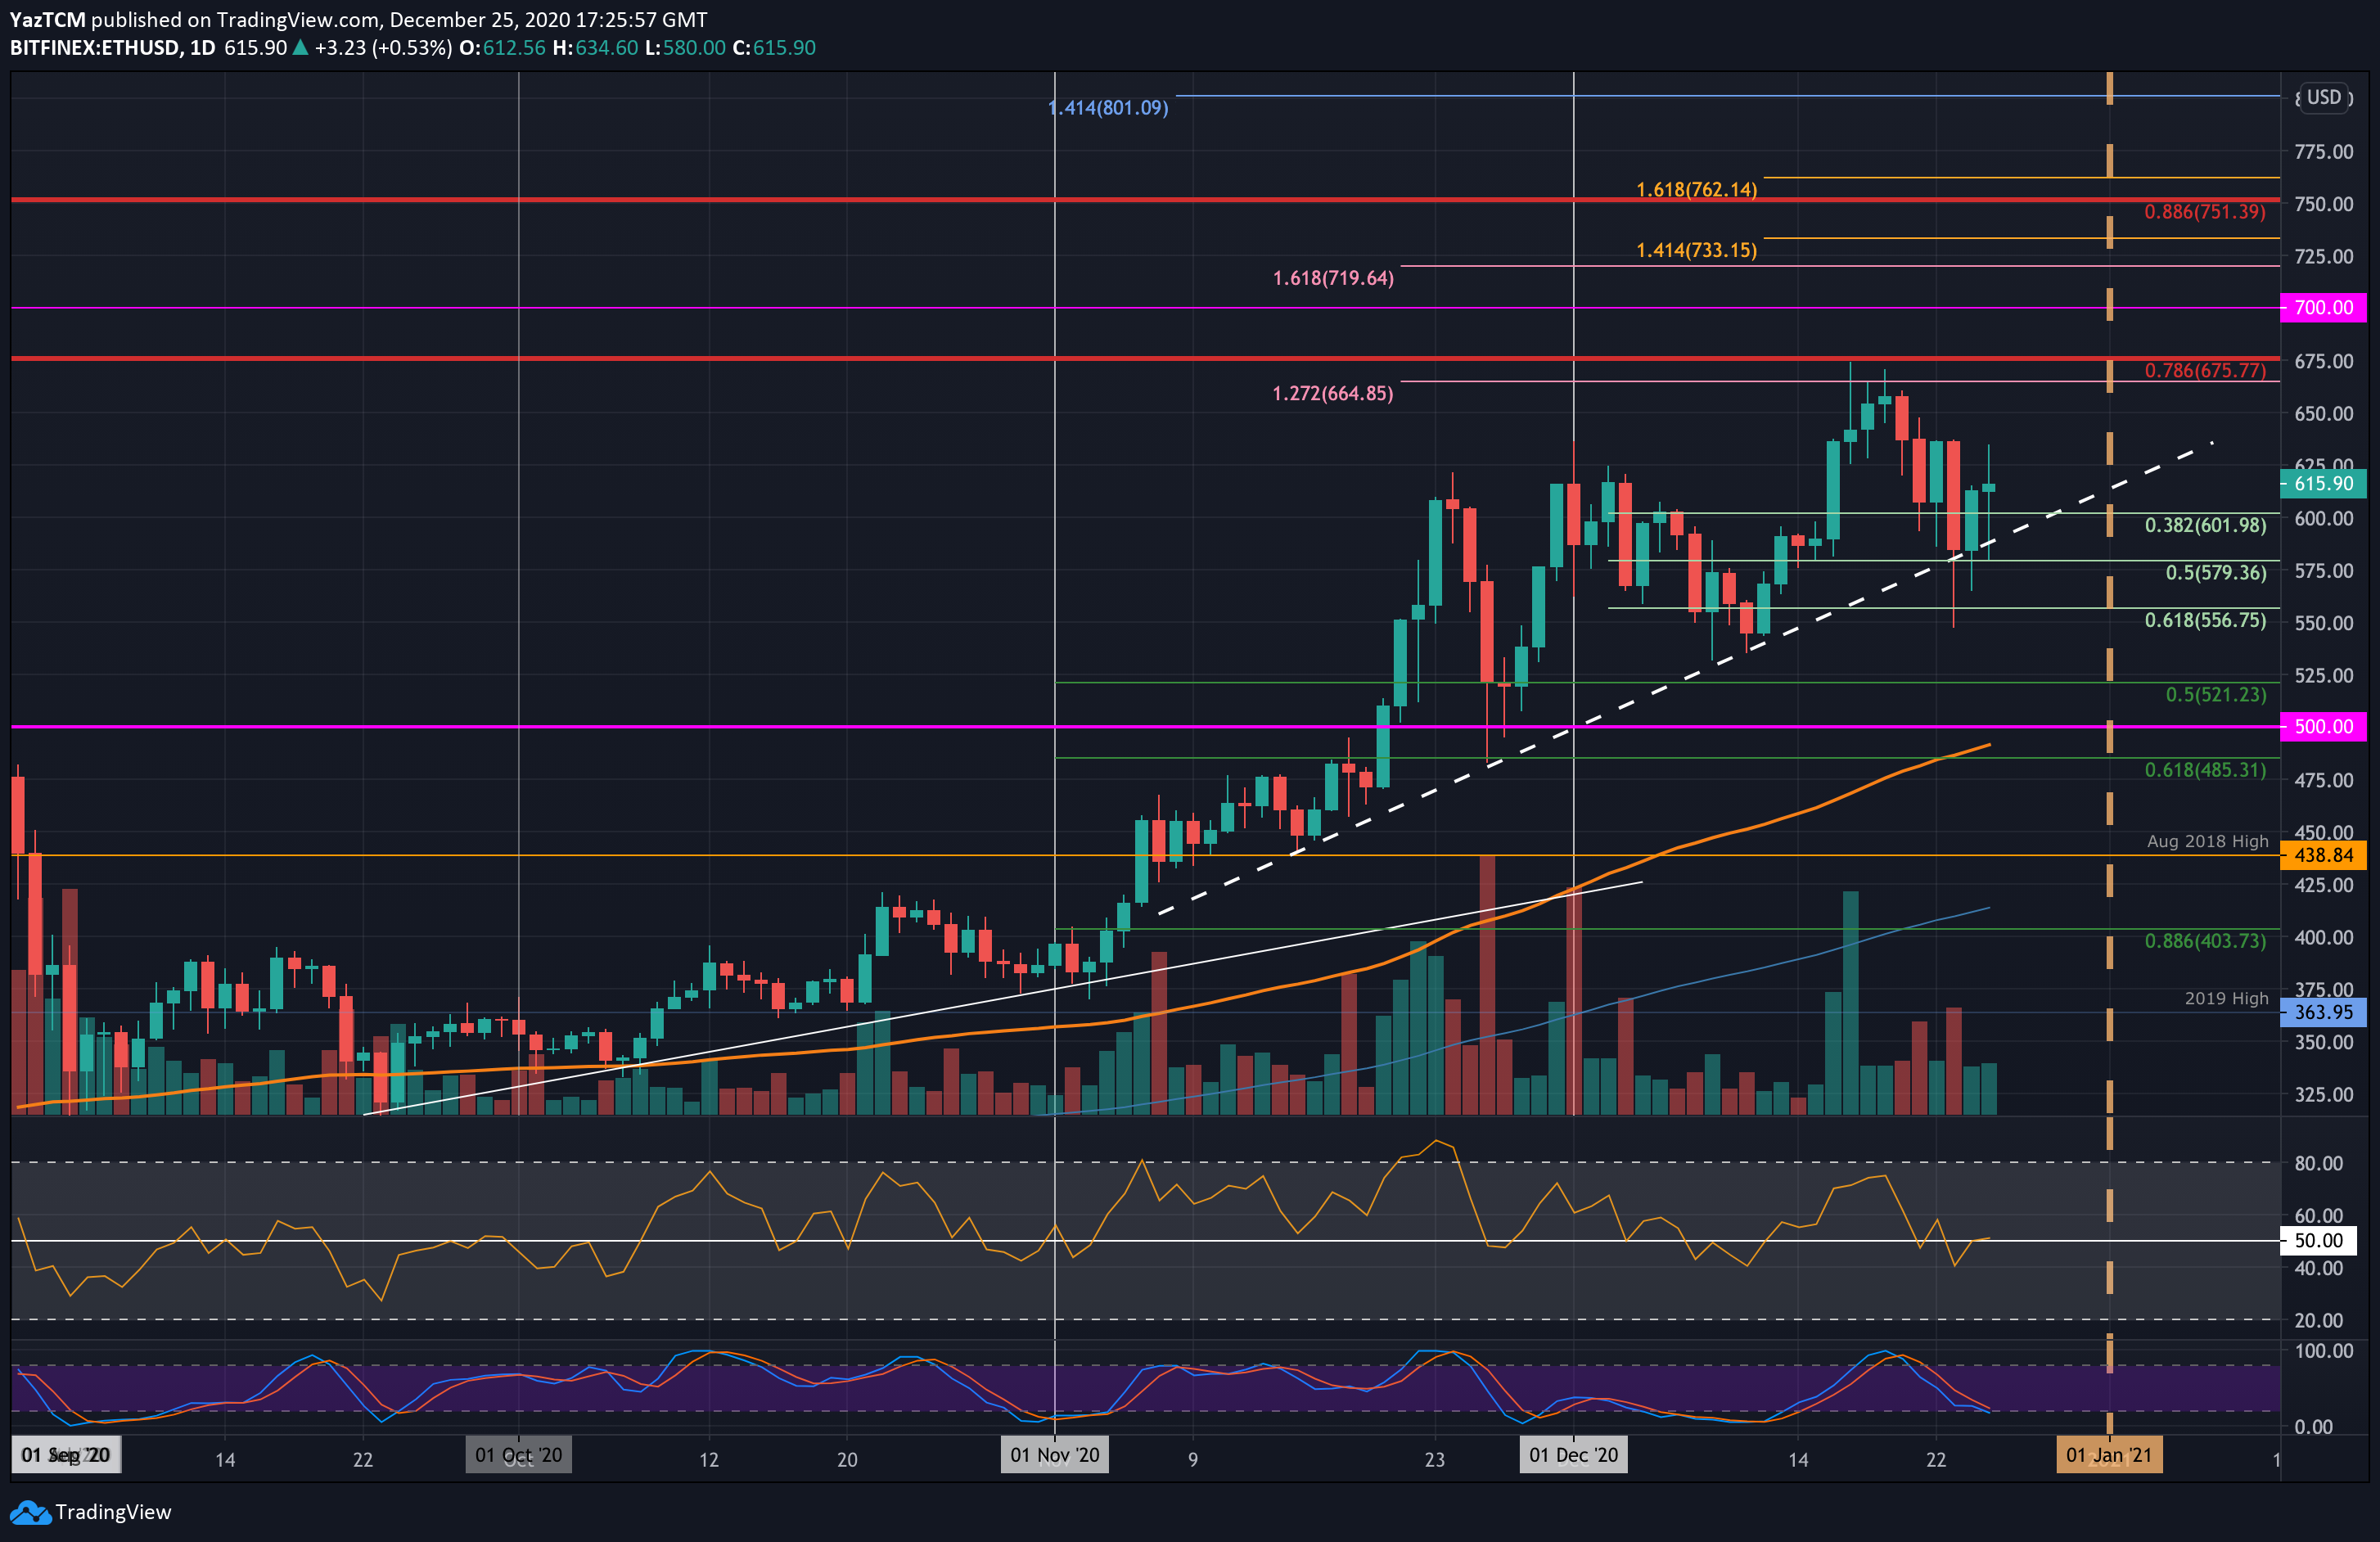
Ethereum is down by 42.5% over the past week but surged by 4% today, which allowed it to reach $615. Last Friday, the coin struggled to break beyond the $660 level, which caused the coin to roll over and head lower.
It continued to fall throughout the week and even spiked as low as $550 on Wednesday. Luckily, the buyers regrouped to allow Wednesday’s daily candle to close above $580, keeping it above a 2-month-old rising trend line.
From there, ETH continued to rebound as it broke back above $600 yesterday and continued to reach the current $626 level today, though it has decreased a bit after that.
Looking ahead, if the buyers continue to push higher, resistance lies at $650, $660, $675 (bearish .786 Fib Retracement), and $700. Beyond $700, resistance is found at $720, $733, and $751 (bearish .886 Fib).
On the other side, the first two support levels lie at $600 and the 2-month-old rising trend line. Beneath the trend line, support is found at $580 (.5 Fib), $556 (.618 Fib), and $530 (December lows).
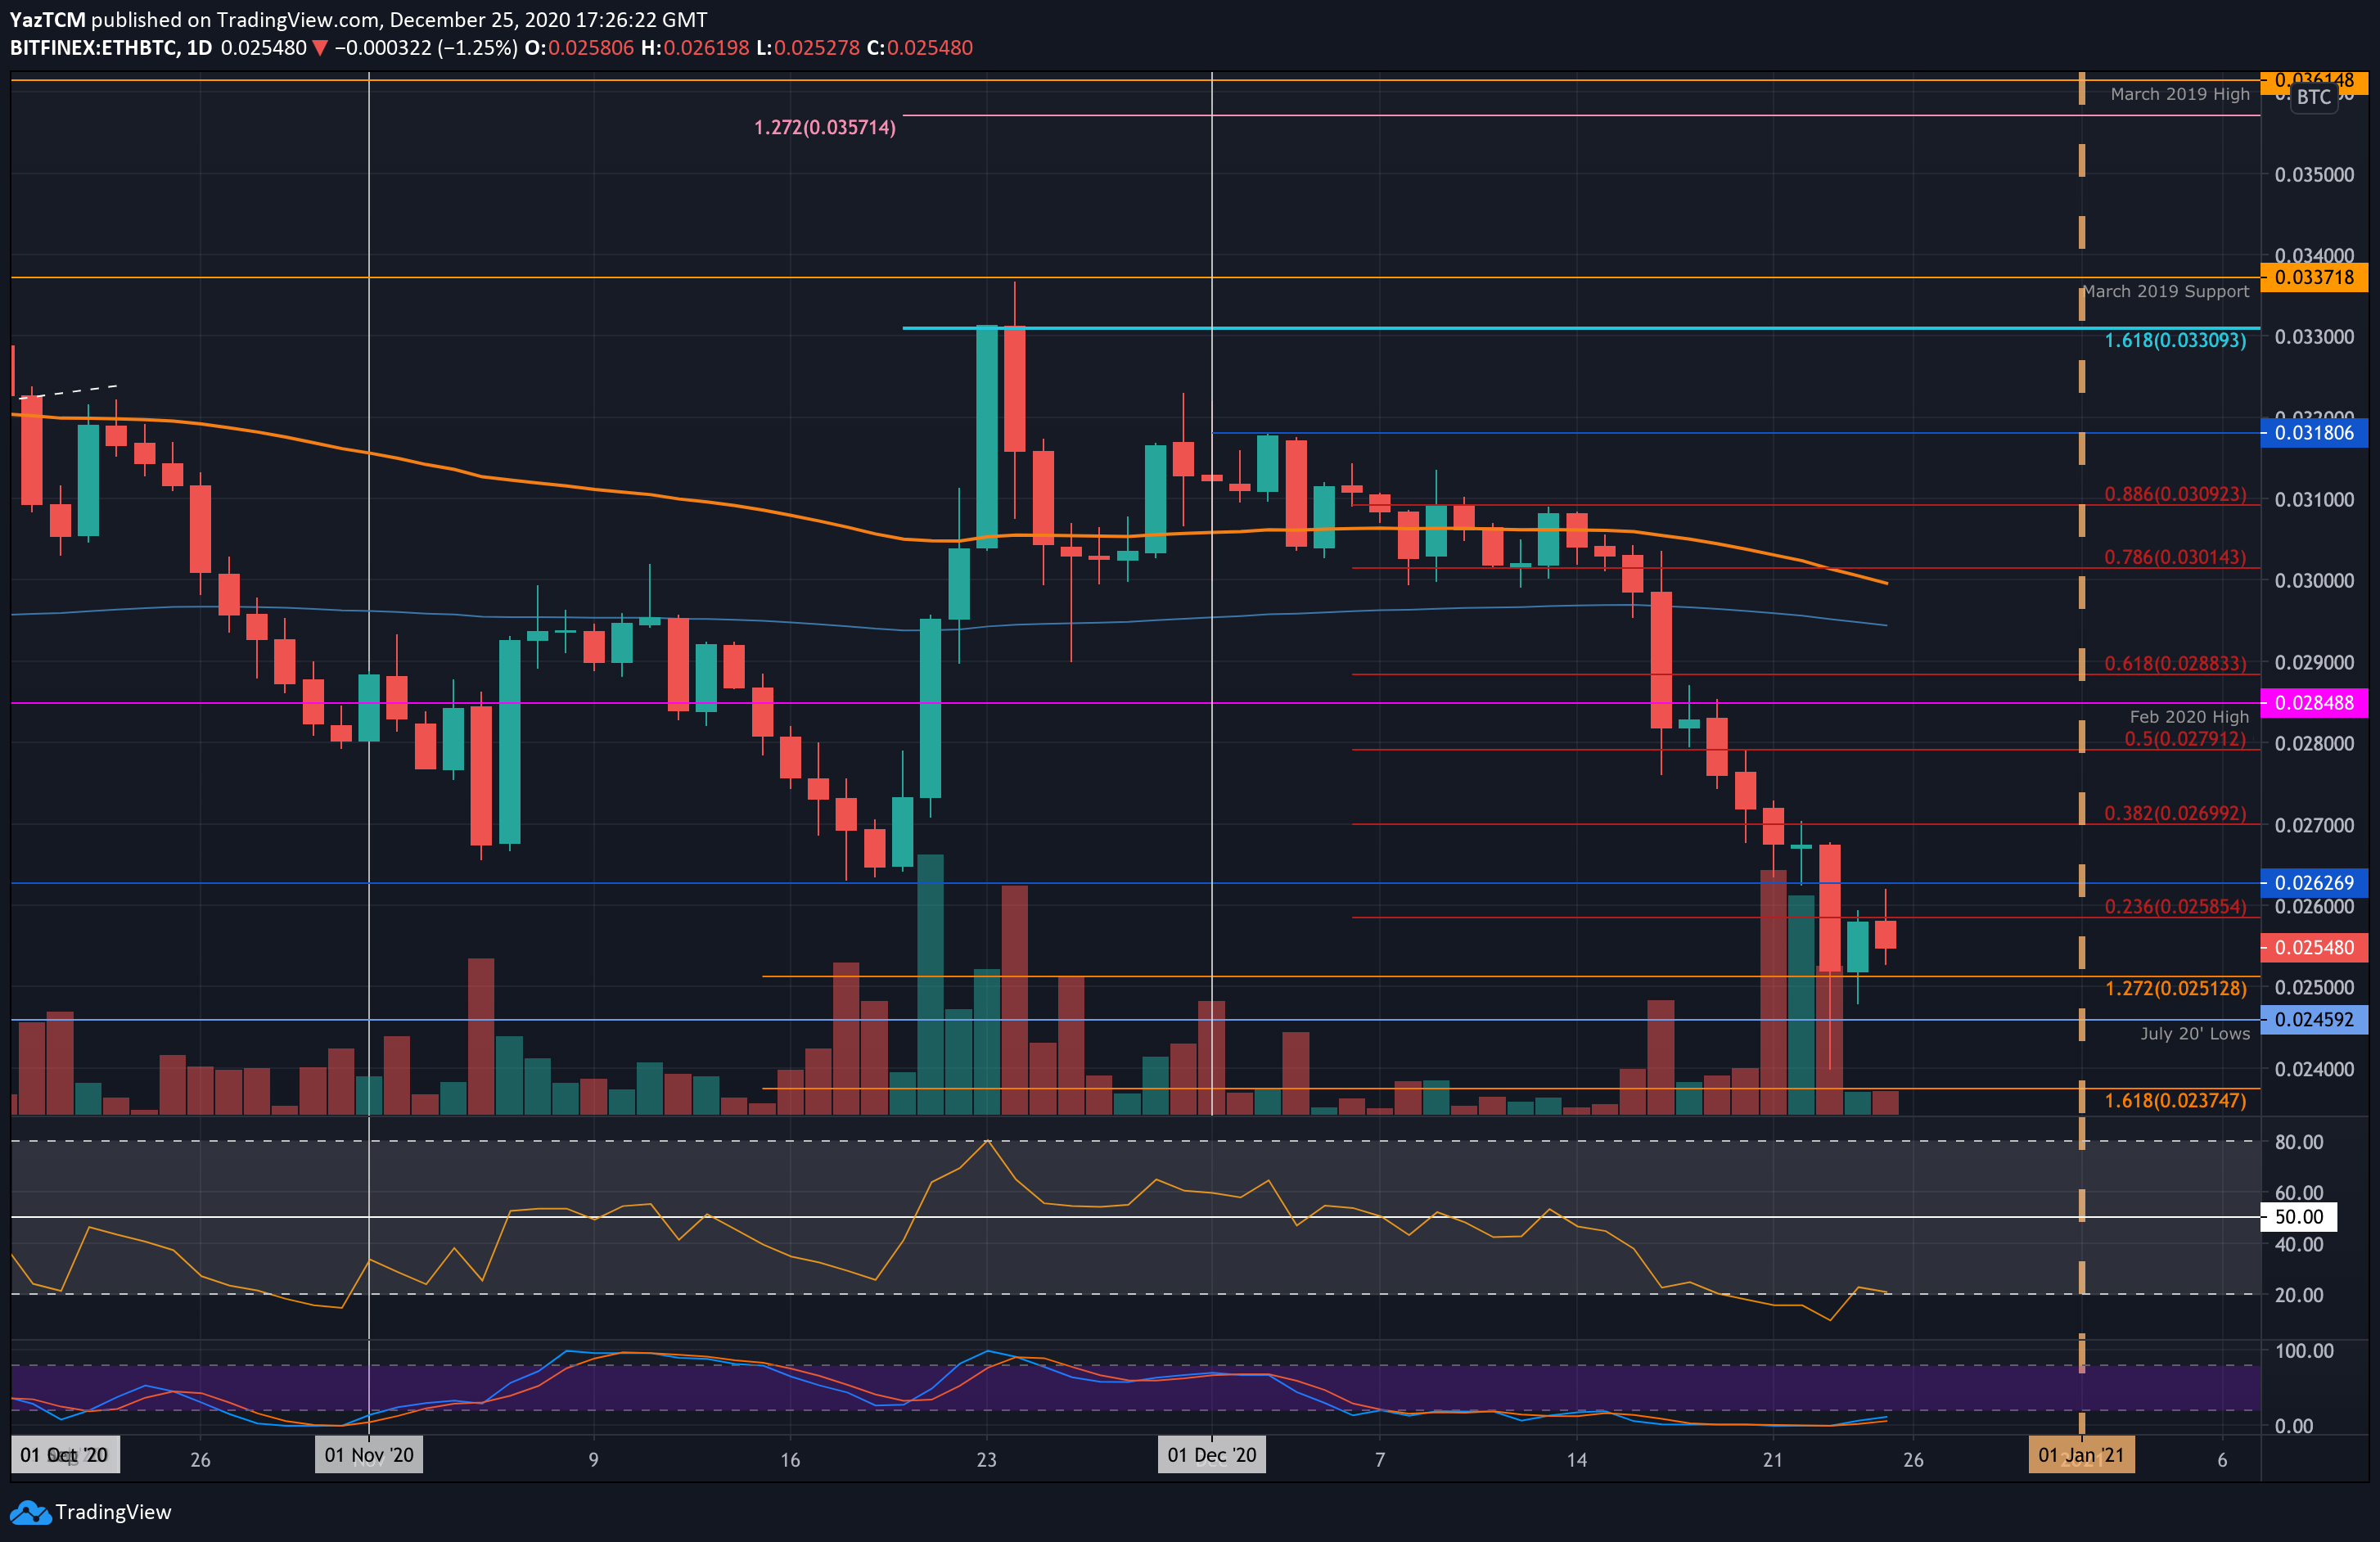
Against Bitcoin, Ethereum saw a troublesome week after poking into a new 7-month low earlier this week. The coin was trading above 0.028 BTC at the start of the week as it started to slide lower. On Wednesday, Ethereum penetrated beneath the November low at 0.0262 BTC and continued as low as 0.024 BTC – setting the fresh 7-month low.
Luckily, the buyers managed to recover on Wednesday to close the daily candle above 0.025 BTC. It has since bounced slightly higher to trade at 0.0254 BTC today.
Looking ahead, the first level of resistance lies at 0.0258 BTC (bearish .236 Fib). This is followed by 0.0262 BTC (November lows), 0.027 BTC (bearish .382 Fib), 0.0279 BTC (Bearish .5 Fib), and 0.0284 (Feb 2020 Highs).
On the other side, the first level of support lies at 0.025 BTC. This is followed by 0.0245 BTC (July 2020 lows), 0.024 BTC, and 0.0237 BTC (downside 1.618 Fib Extension).
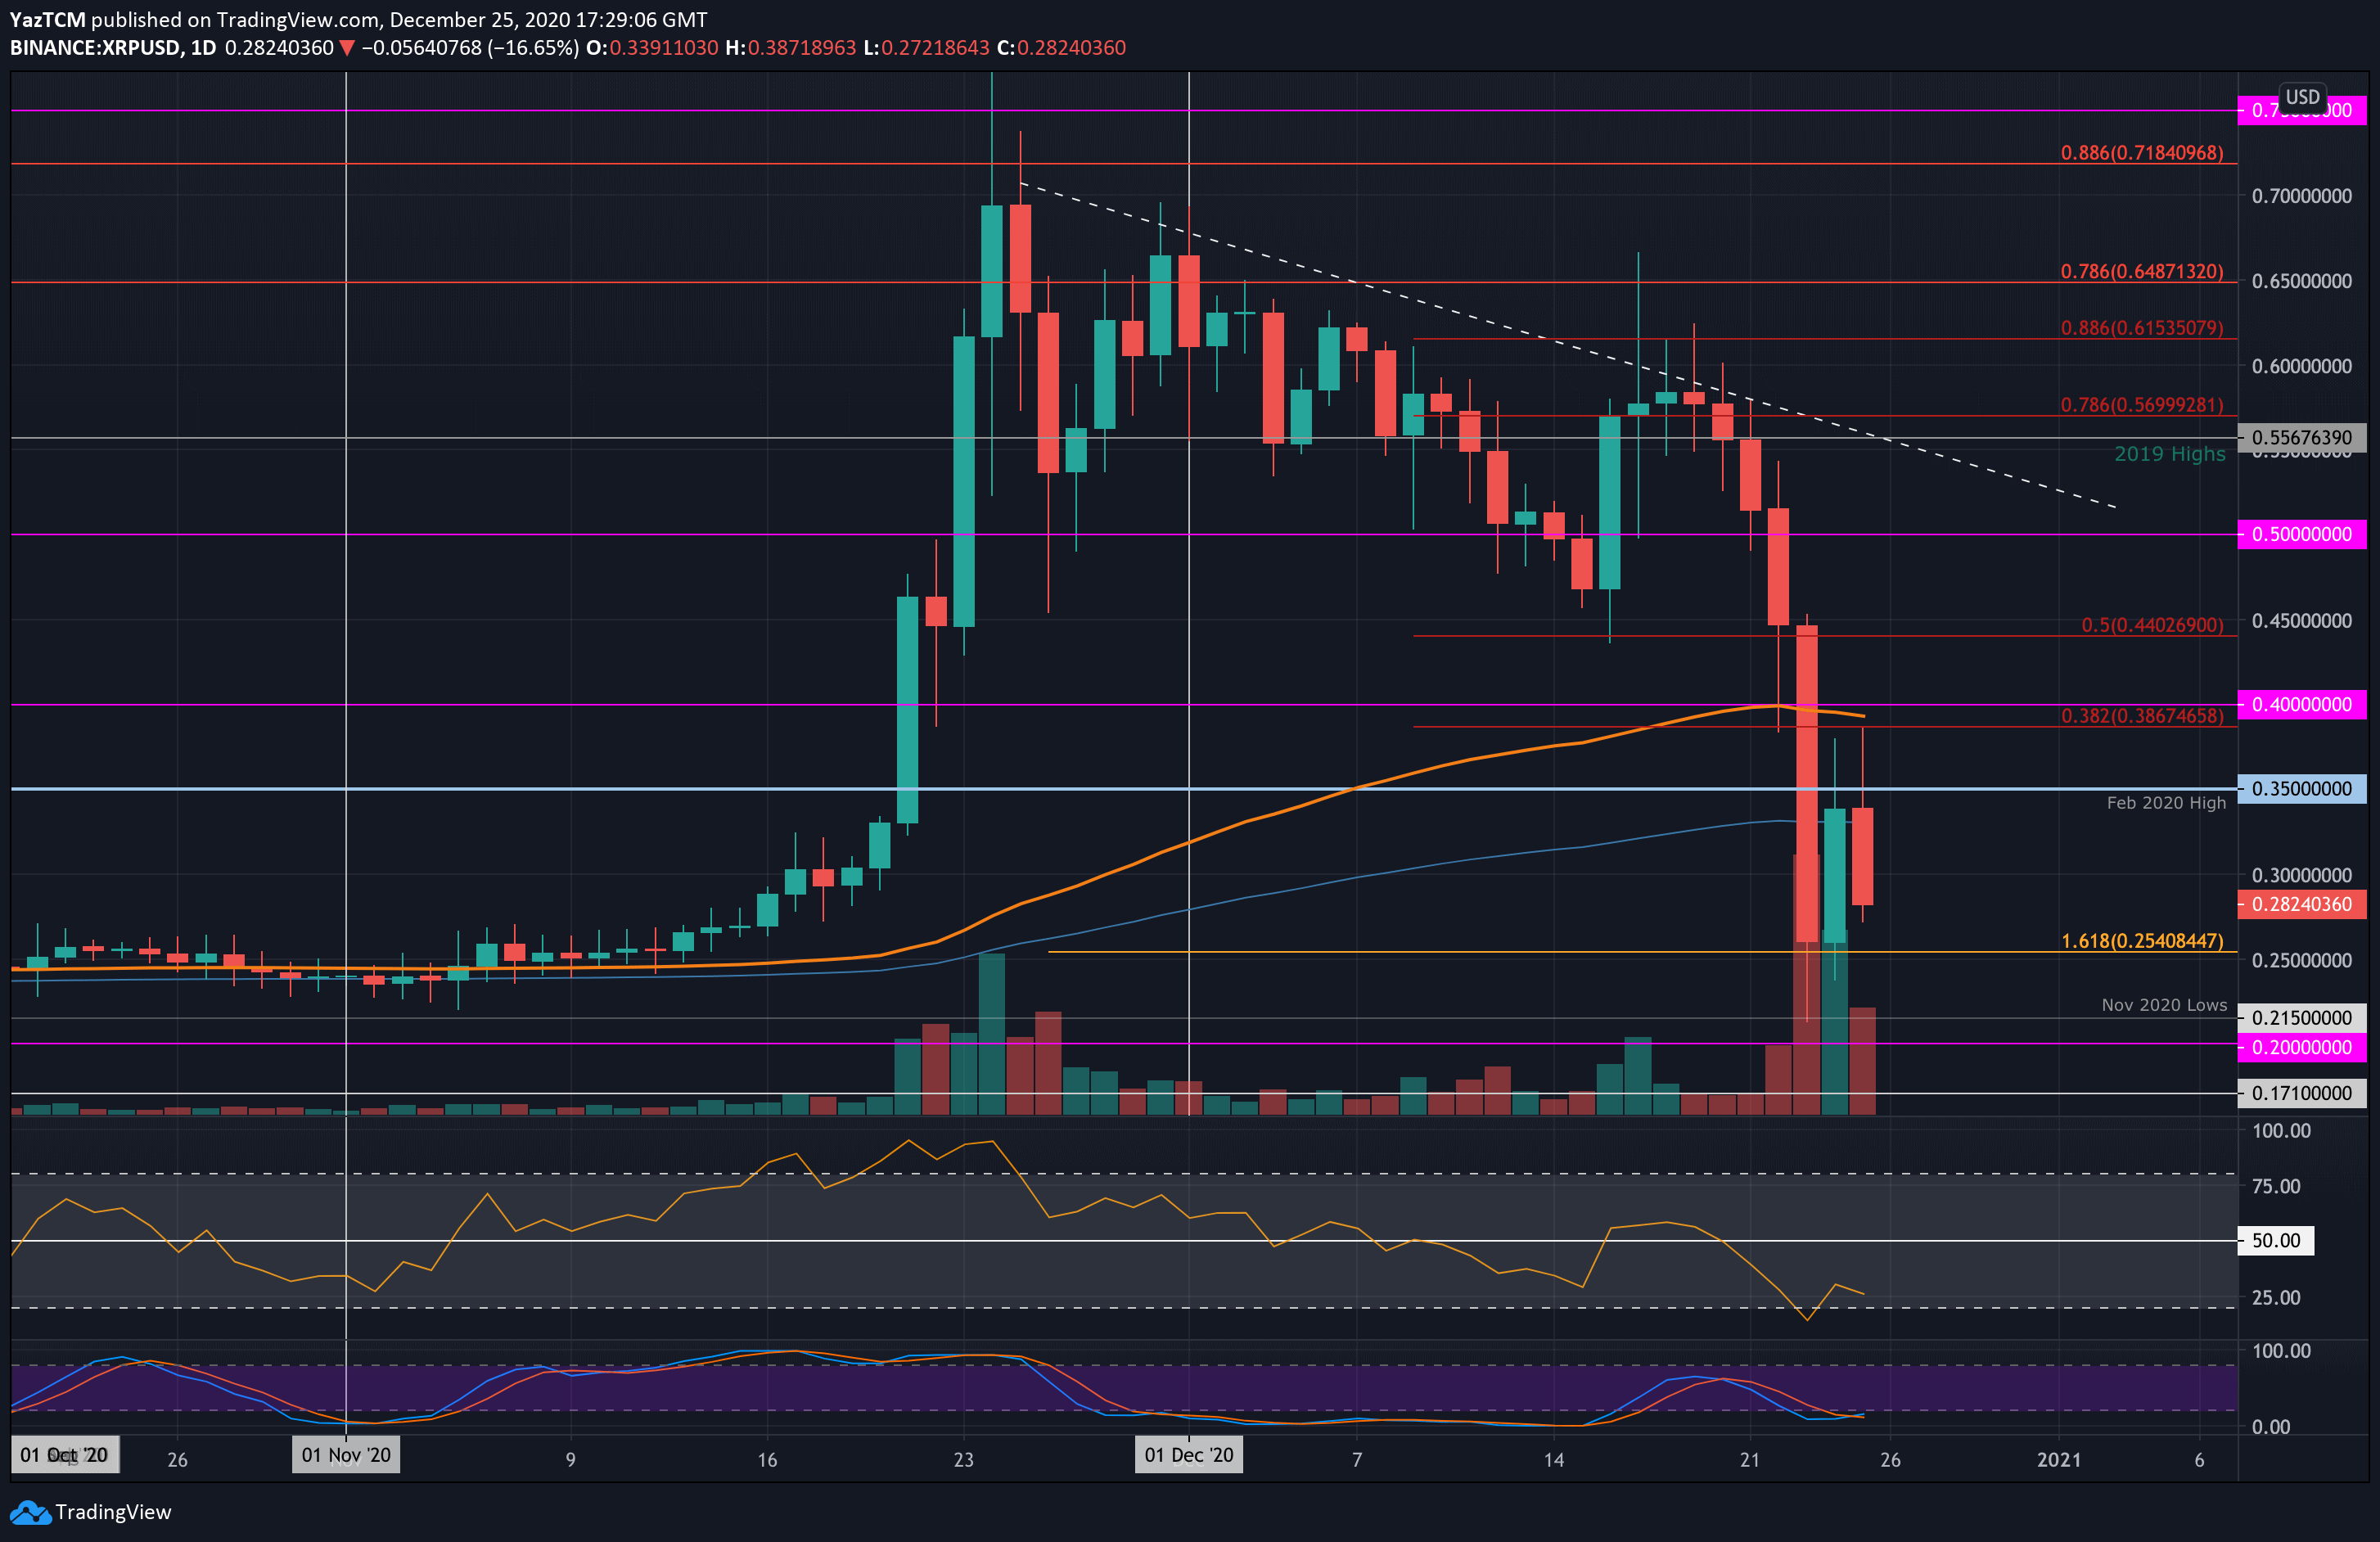
Ripple saw a disastrous week after suffering a 50% price fall on Wednesday. It recovered by 16.2% today, putting the 7-day price fall to -35%. The cryptocurrency was trading at $0.6 last Friday as it started to fall lower. On Tuesday, it sank beneath the $0.5 level and continued much lower on Wednesday when the news was announced that they would be sued by the SEC. This caused XRP to dip as low as $0.215.
It recovered from there slightly as the daily candle closed above $0.25. Over the past two days, XRP attempted to push higher but was unable to overcome the $0,386 resistance. It has since dropped back beneath $0.3 to trade at $0.282.
Moving forward, the first level of resistance lies at $0.386 (bearish .382 Fib). This is followed by $0.4 (100-days EMA), $0.44 (bearish .5 Fib), and $0.5.
On the other side, the first level of support lies at $0.254. This is followed by support at $0.25, $0.215, $0.2, and $0.171.
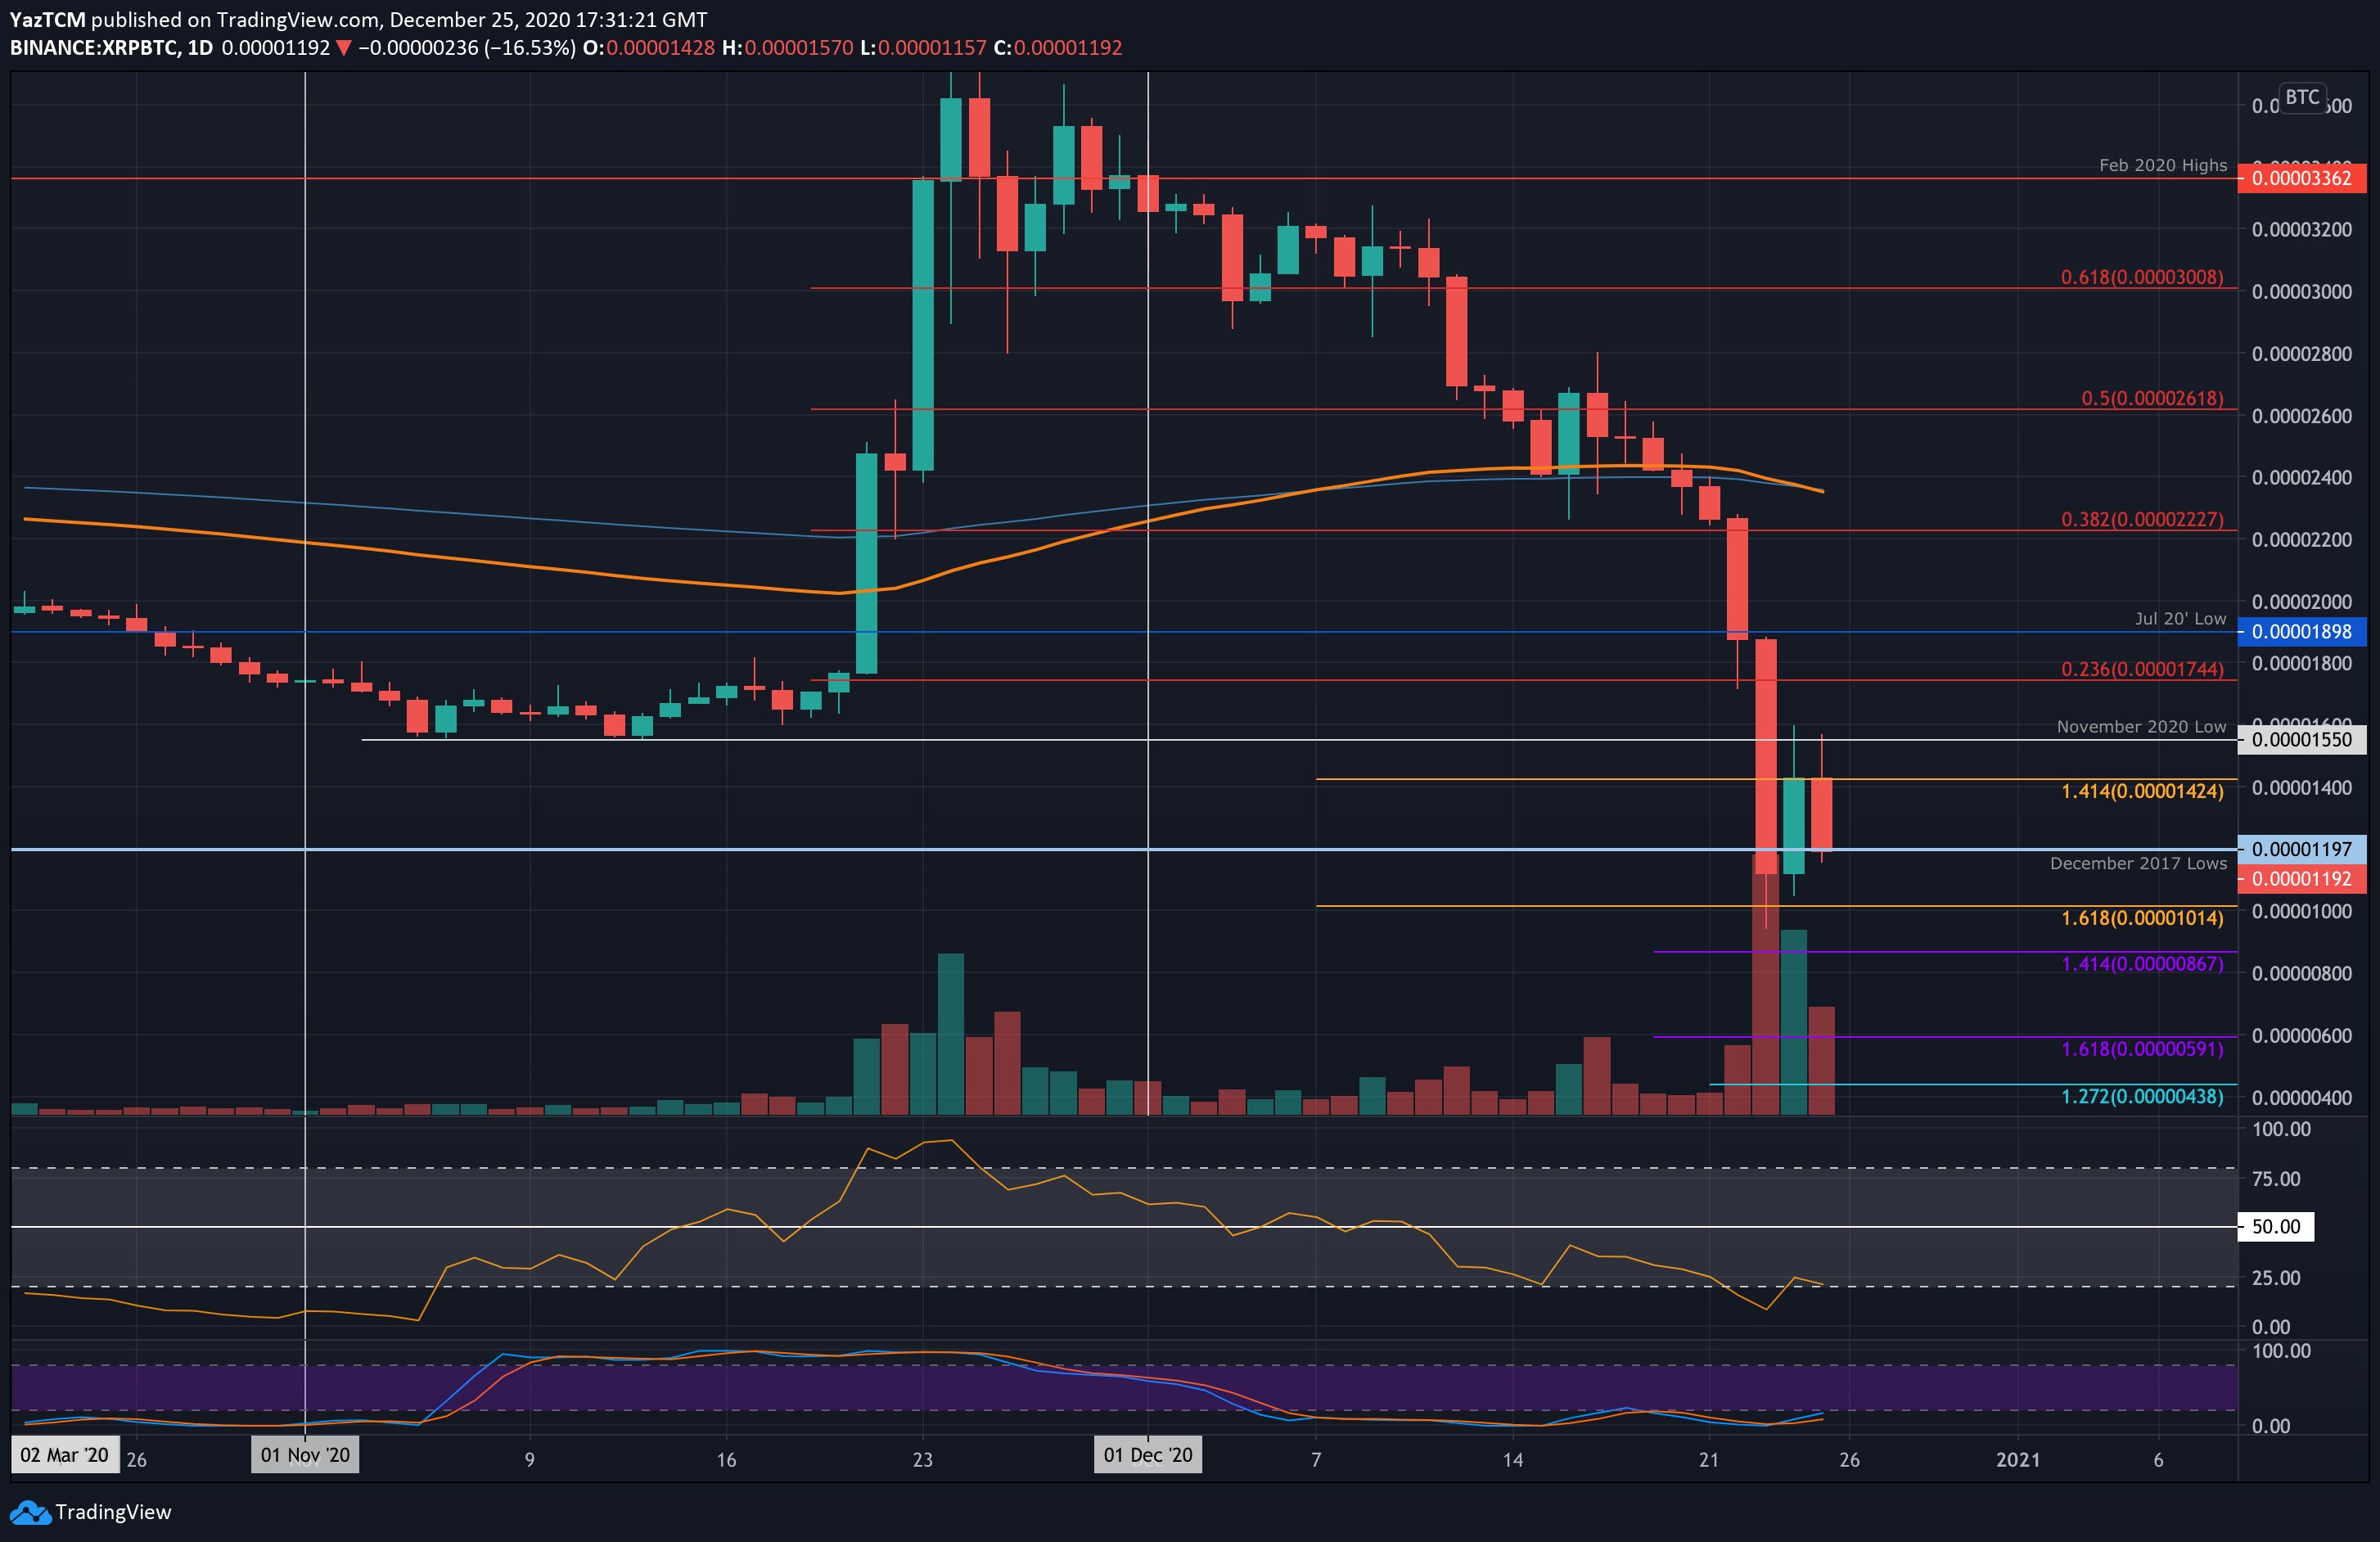
XRP also suffered majorly against Bitcoin as it dropped to 3-year lows this week. The cryptocurrency fell from above 1800 SAT on Wednesday to spike beneath the 1000 SAT level. It recovered slightly as the daily candle closed at 1100 SAT. Since then, XRP attempted to rebound but could not pass the 1550 SAT level (Nov 2020 low). It now trades at 1190 SAT.
Looking ahead, if the buyers push higher, the first level of resistance lies at 1550 SAT (November 2020 low). Above this, resistance lies at 1745 SAT (bearish .236 Fib), 1900 SAT (July 2020 lows), and 2000 SAT.
On the other side, the first level of support lies at 1190 SAT. This is followed by support at 1100 SAT, 10015 SAT, 1000 SAT, and 867 SAT.
Binance Coin saw a strong 9.4% price hike this week, outperforming all the coins on this list. IT was trading at around $31 last Friday as it pushed higher over the weekend. Unfortunately, it was unable to overcome the resistance at $34.35 (July 2019 highs), which caused it to roll over and head lower during the week.
Luckily, BNB managed to fund strong support at $30.10 (.618 Fib) yesterday, which saw the coin rebounding to reach the current $32.15 level today.
Moving forward, if the buyers continue to drive higher, the first level of strong resistance is located at $34.35 (July 2019 Highs). Above this, resistance lies at $35.83 (bearish .886 Fib), $37, and $38.13. Added resistance is found at $39.61 (2019 Highs) and $40.
On the other side, support is found at $32, $31.17 (.5 Fib), $30.10 (.618 Fib), and $28.58 (.786 Fib).
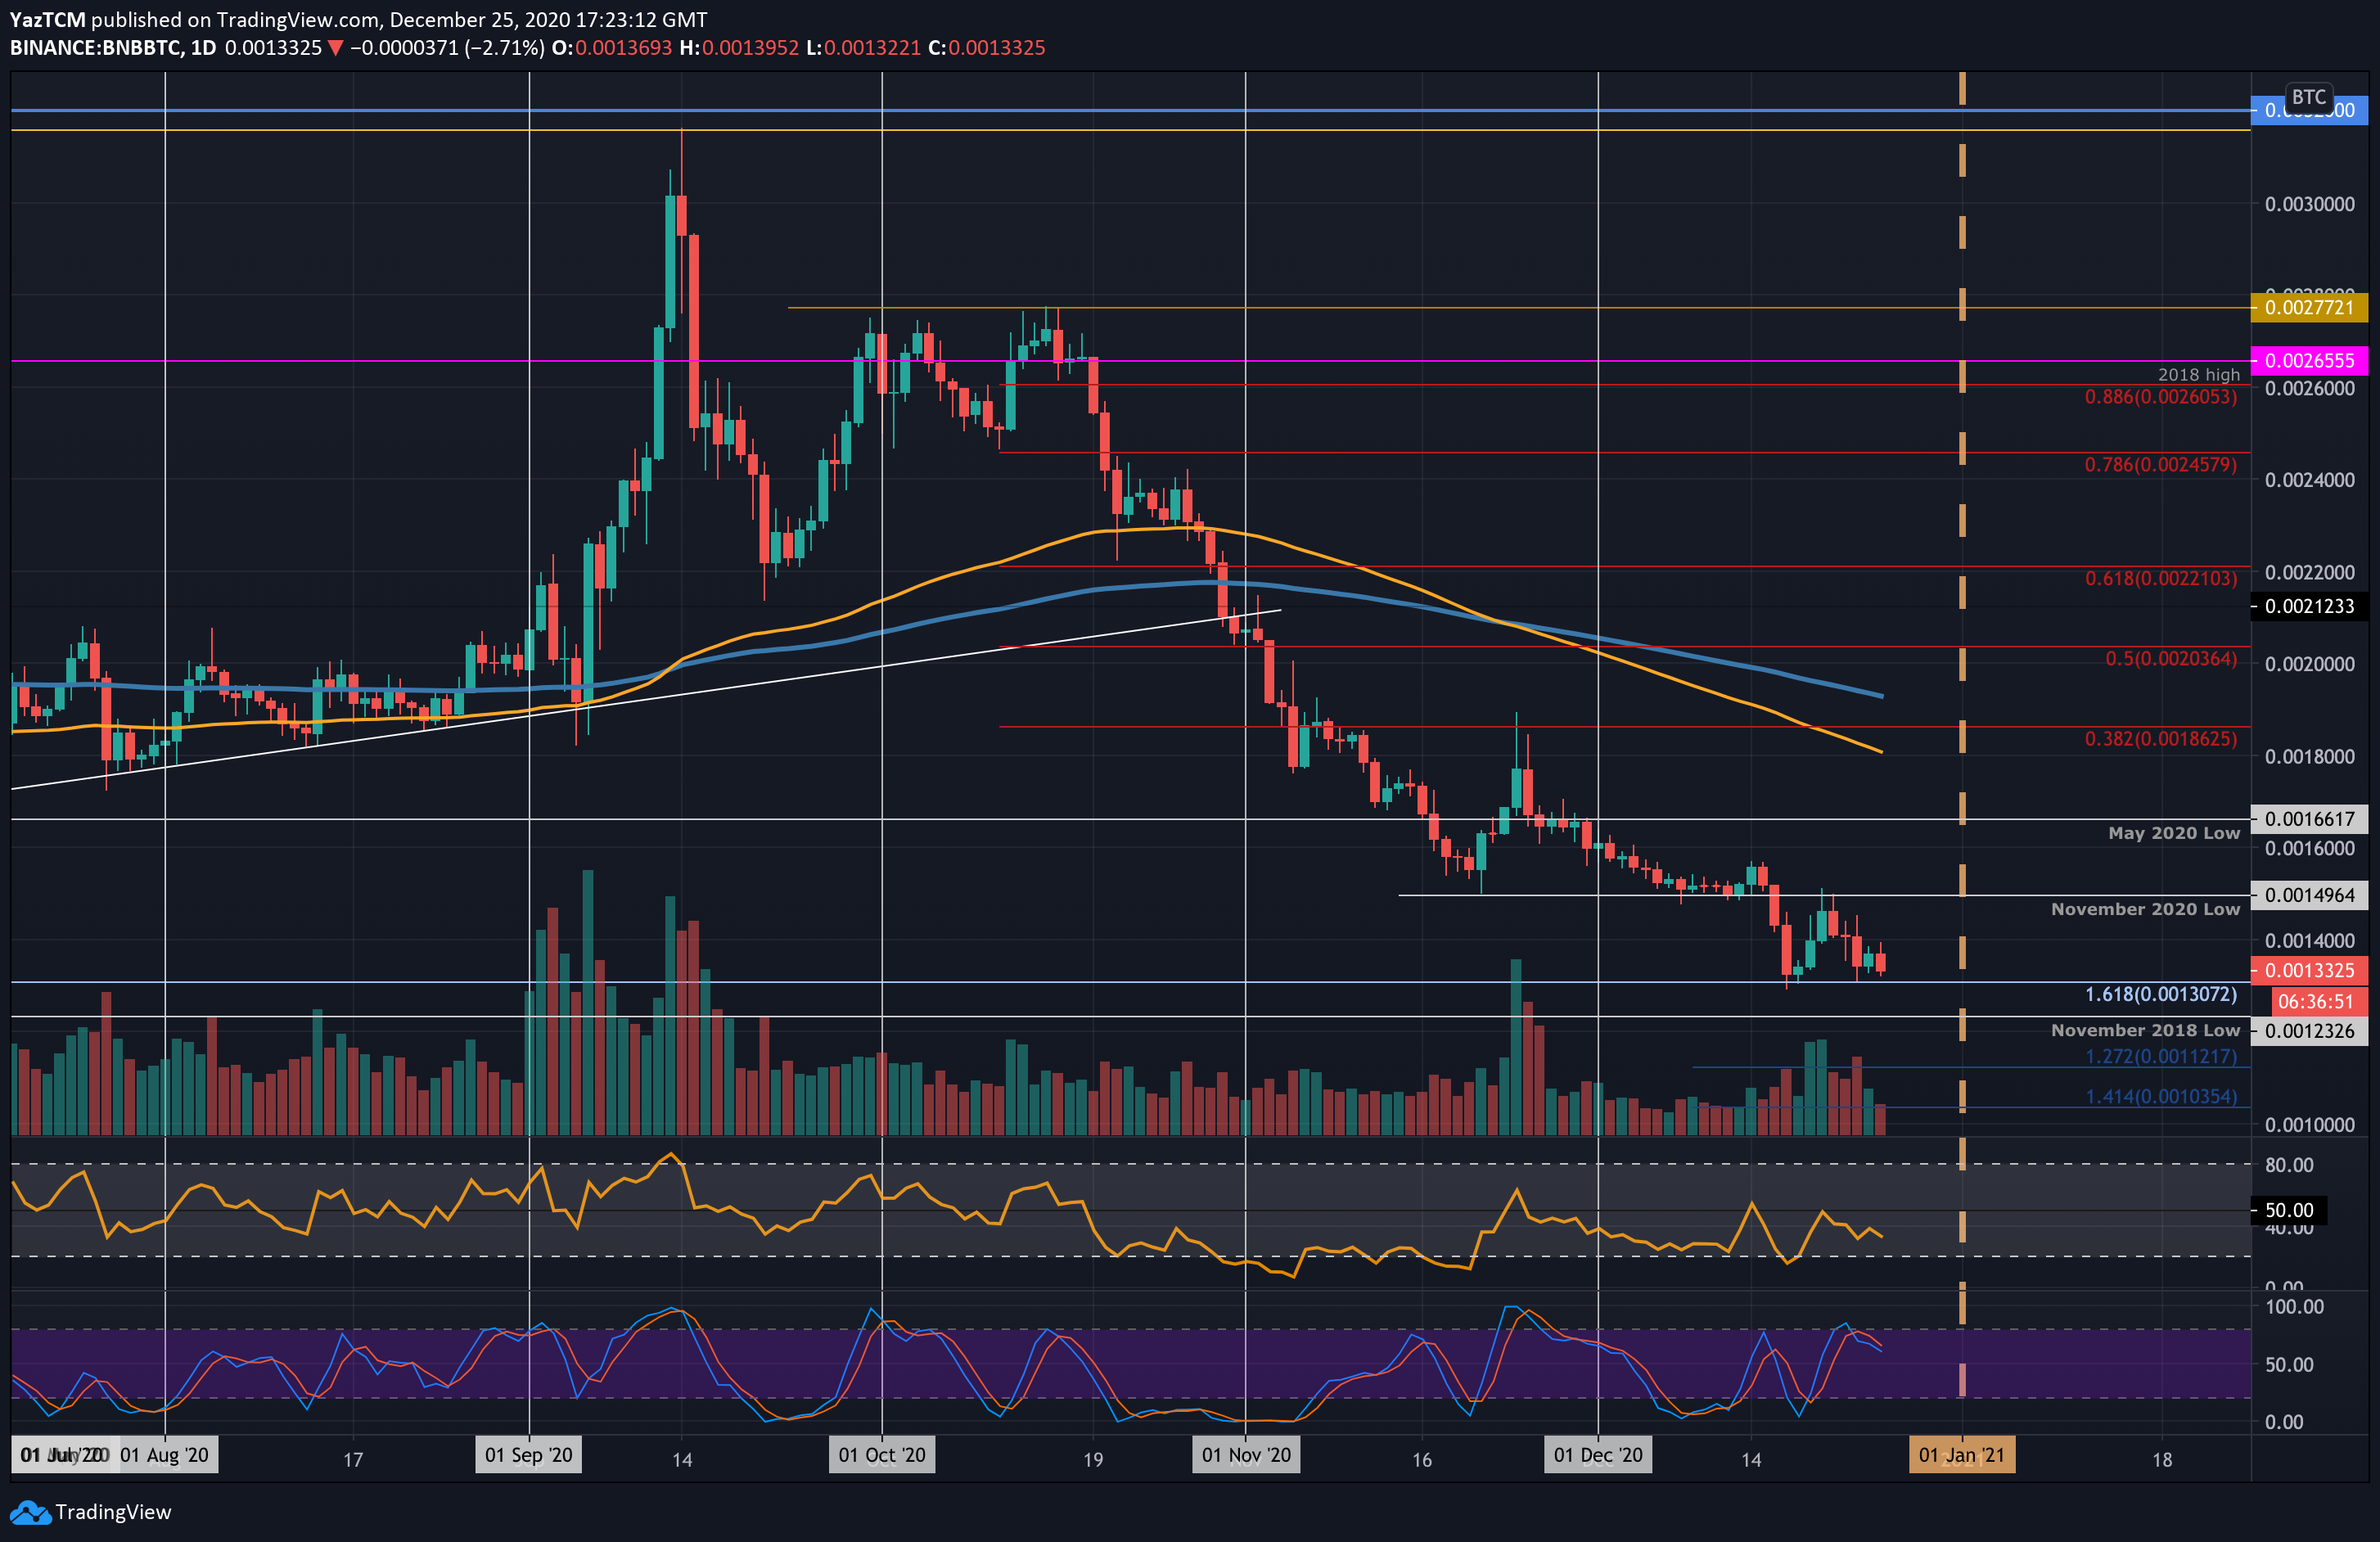
Against Bitcoin, BNB actually returned to the 2-year low this week as it fell back into the low of 0.0013 BTC. It had attempted to push higher but was unable to break back above the November 2020 low at 0.00149 BTC. It is now trading at 0.00133 BTC.
Moving forward, the first level of support lies at 0.0013 BTC. This is followed by 0.00123 BTC (November 2018 low), 0.0012 BTC, and 0.00112 BTC.
On the other side, the first level of resistance lies at 0.0014 BTC. This is followed by 0.00149 BTC (Nov 20 lows), 0.0016 BTC, and 0.00166 BTC (May 2020 lows). Added resistance lies at 0.0018 BTC (100-days EMA).
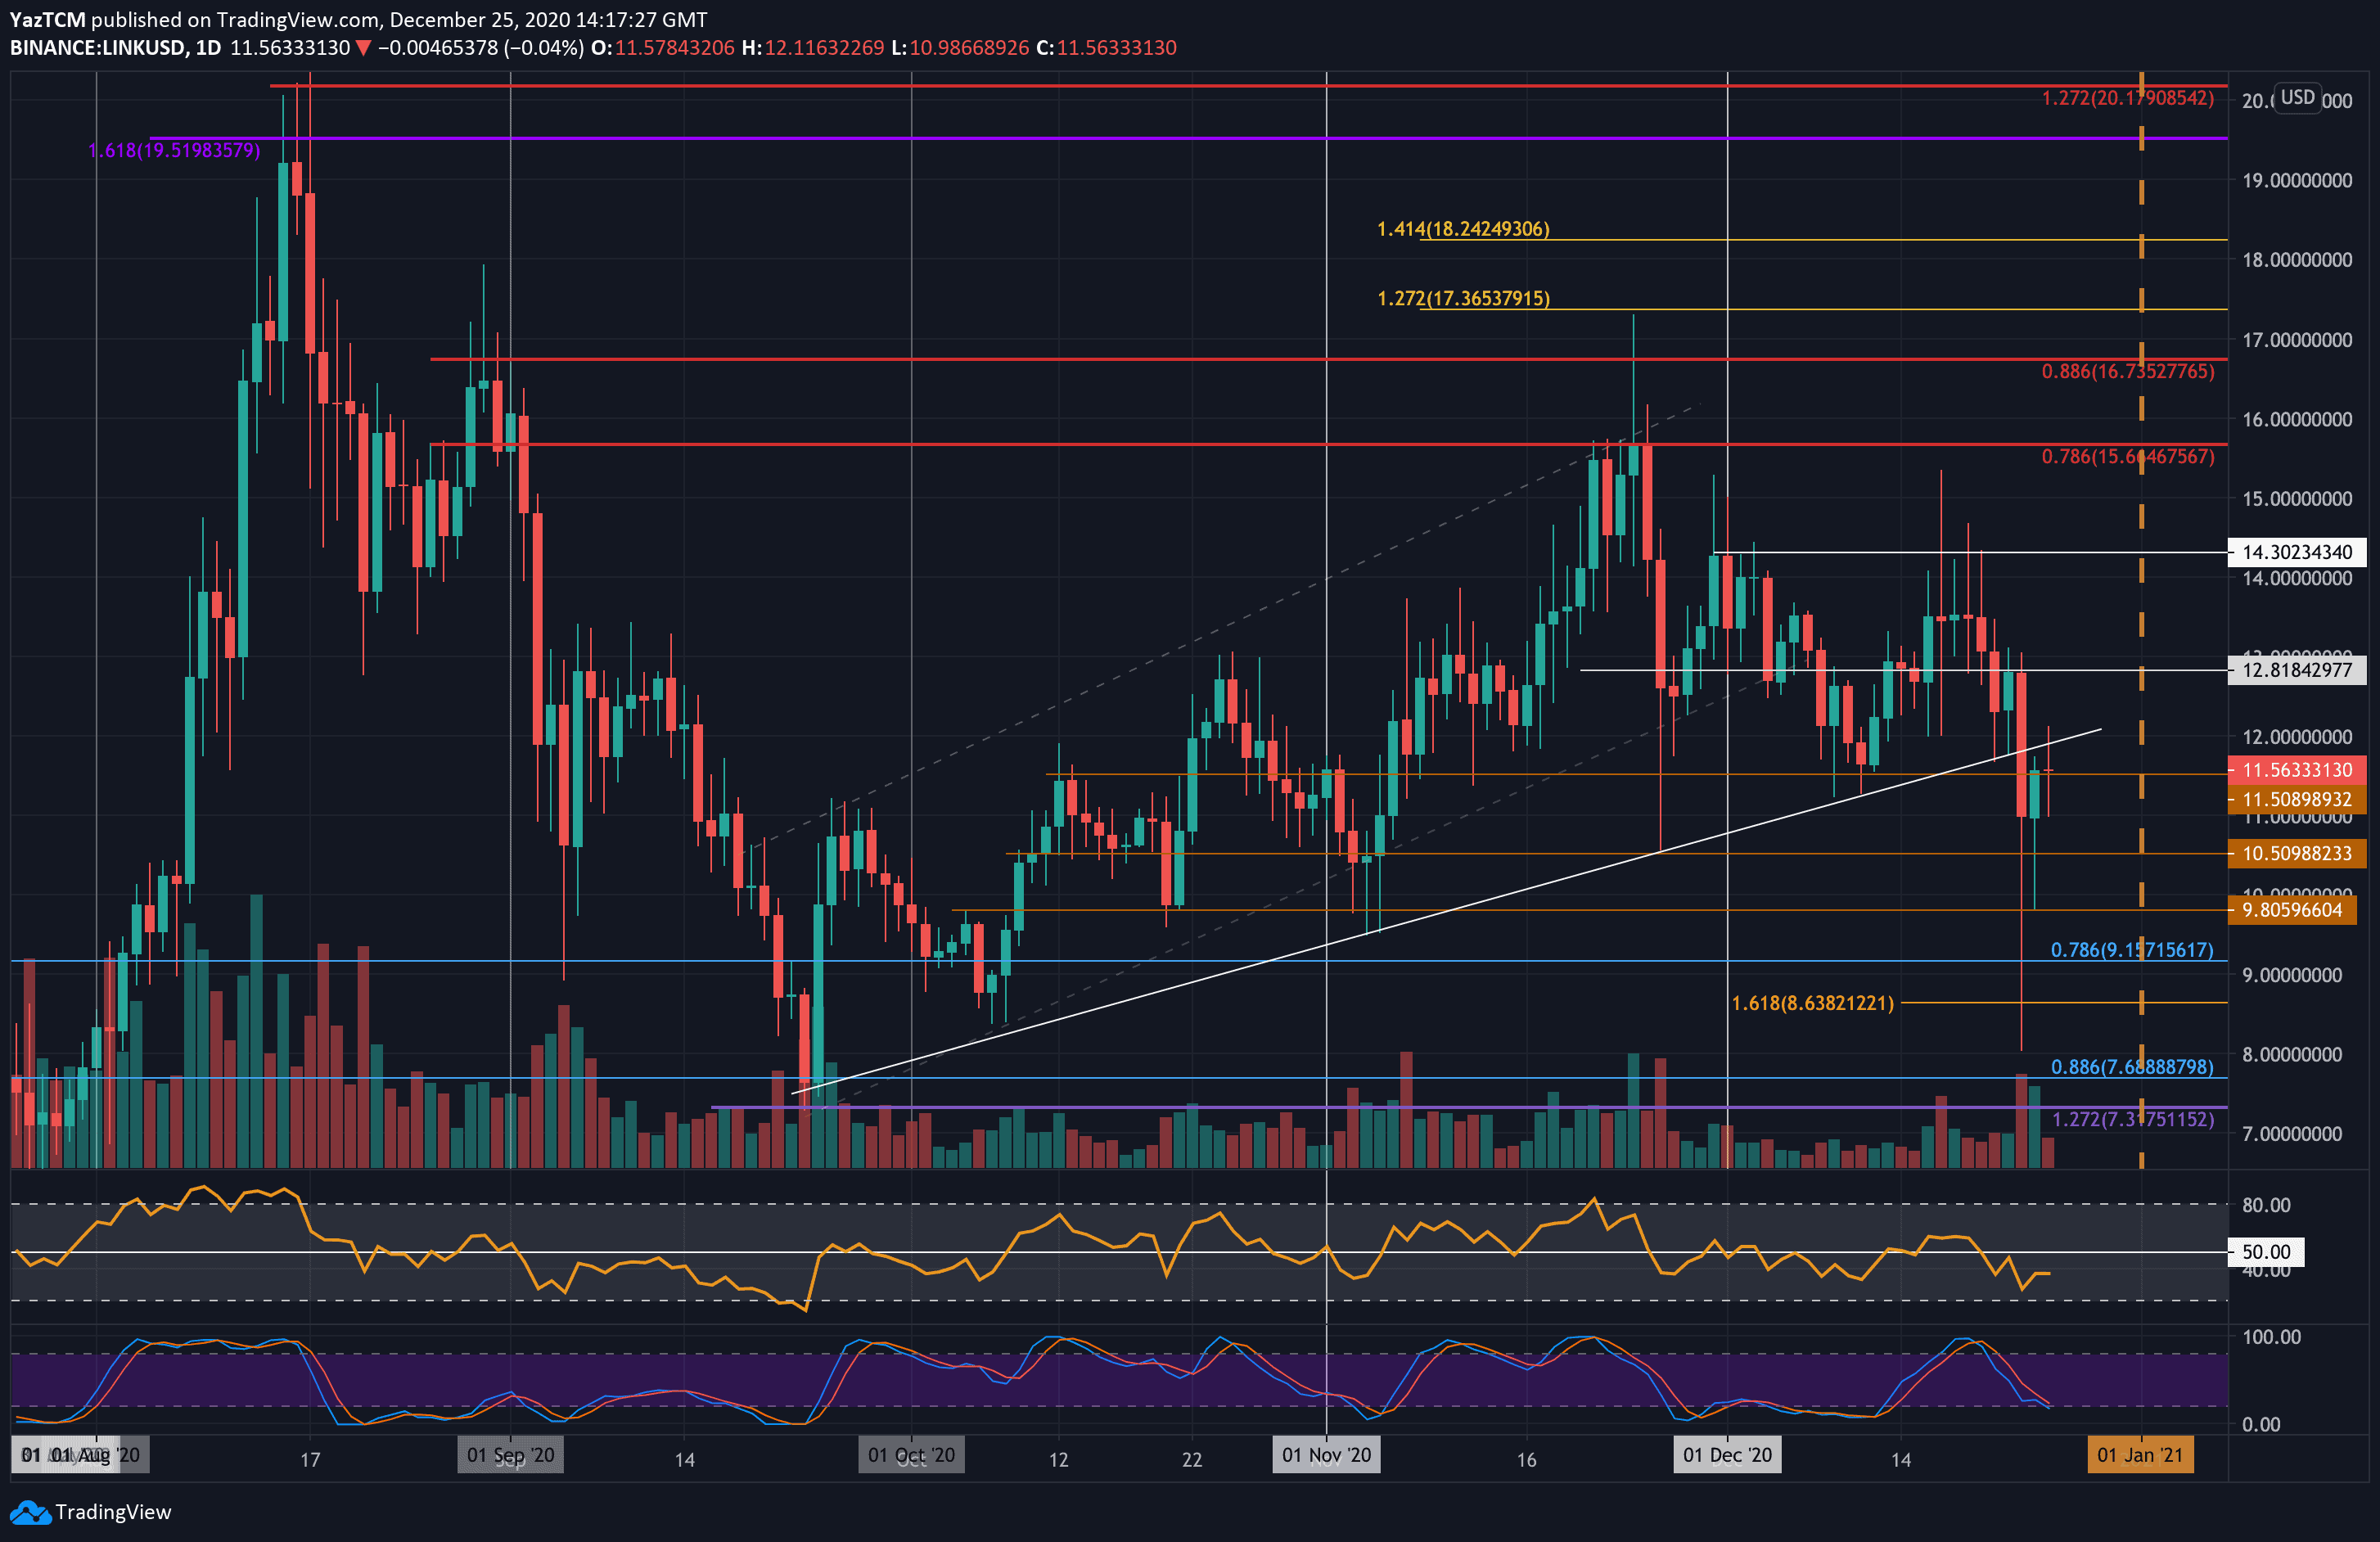
Chainlink suffered an enormous 14% price fall over the past week as it currently trades at $11.56. It was trading around $14 last Friday as it started to fall. Like most coins, it saw a disastrous spike lower on Wednesday as the sellers pushed the coin as low as $8.00. The bulls quickly responded to allow LINK to close the daily candle at $11.
From there, LINK has pushed slightly higher to trade at $11.45.
Moving forward, if the buyers continue upward, the first level of resistance lies at $12. This is followed by $12.81, $13, $13.80, and $14. Added resistance is found at $14.30 and $15.
Alternatively, the first level of support lies at $11.40. This is followed by $11, $10.50, $10, and $9.80.
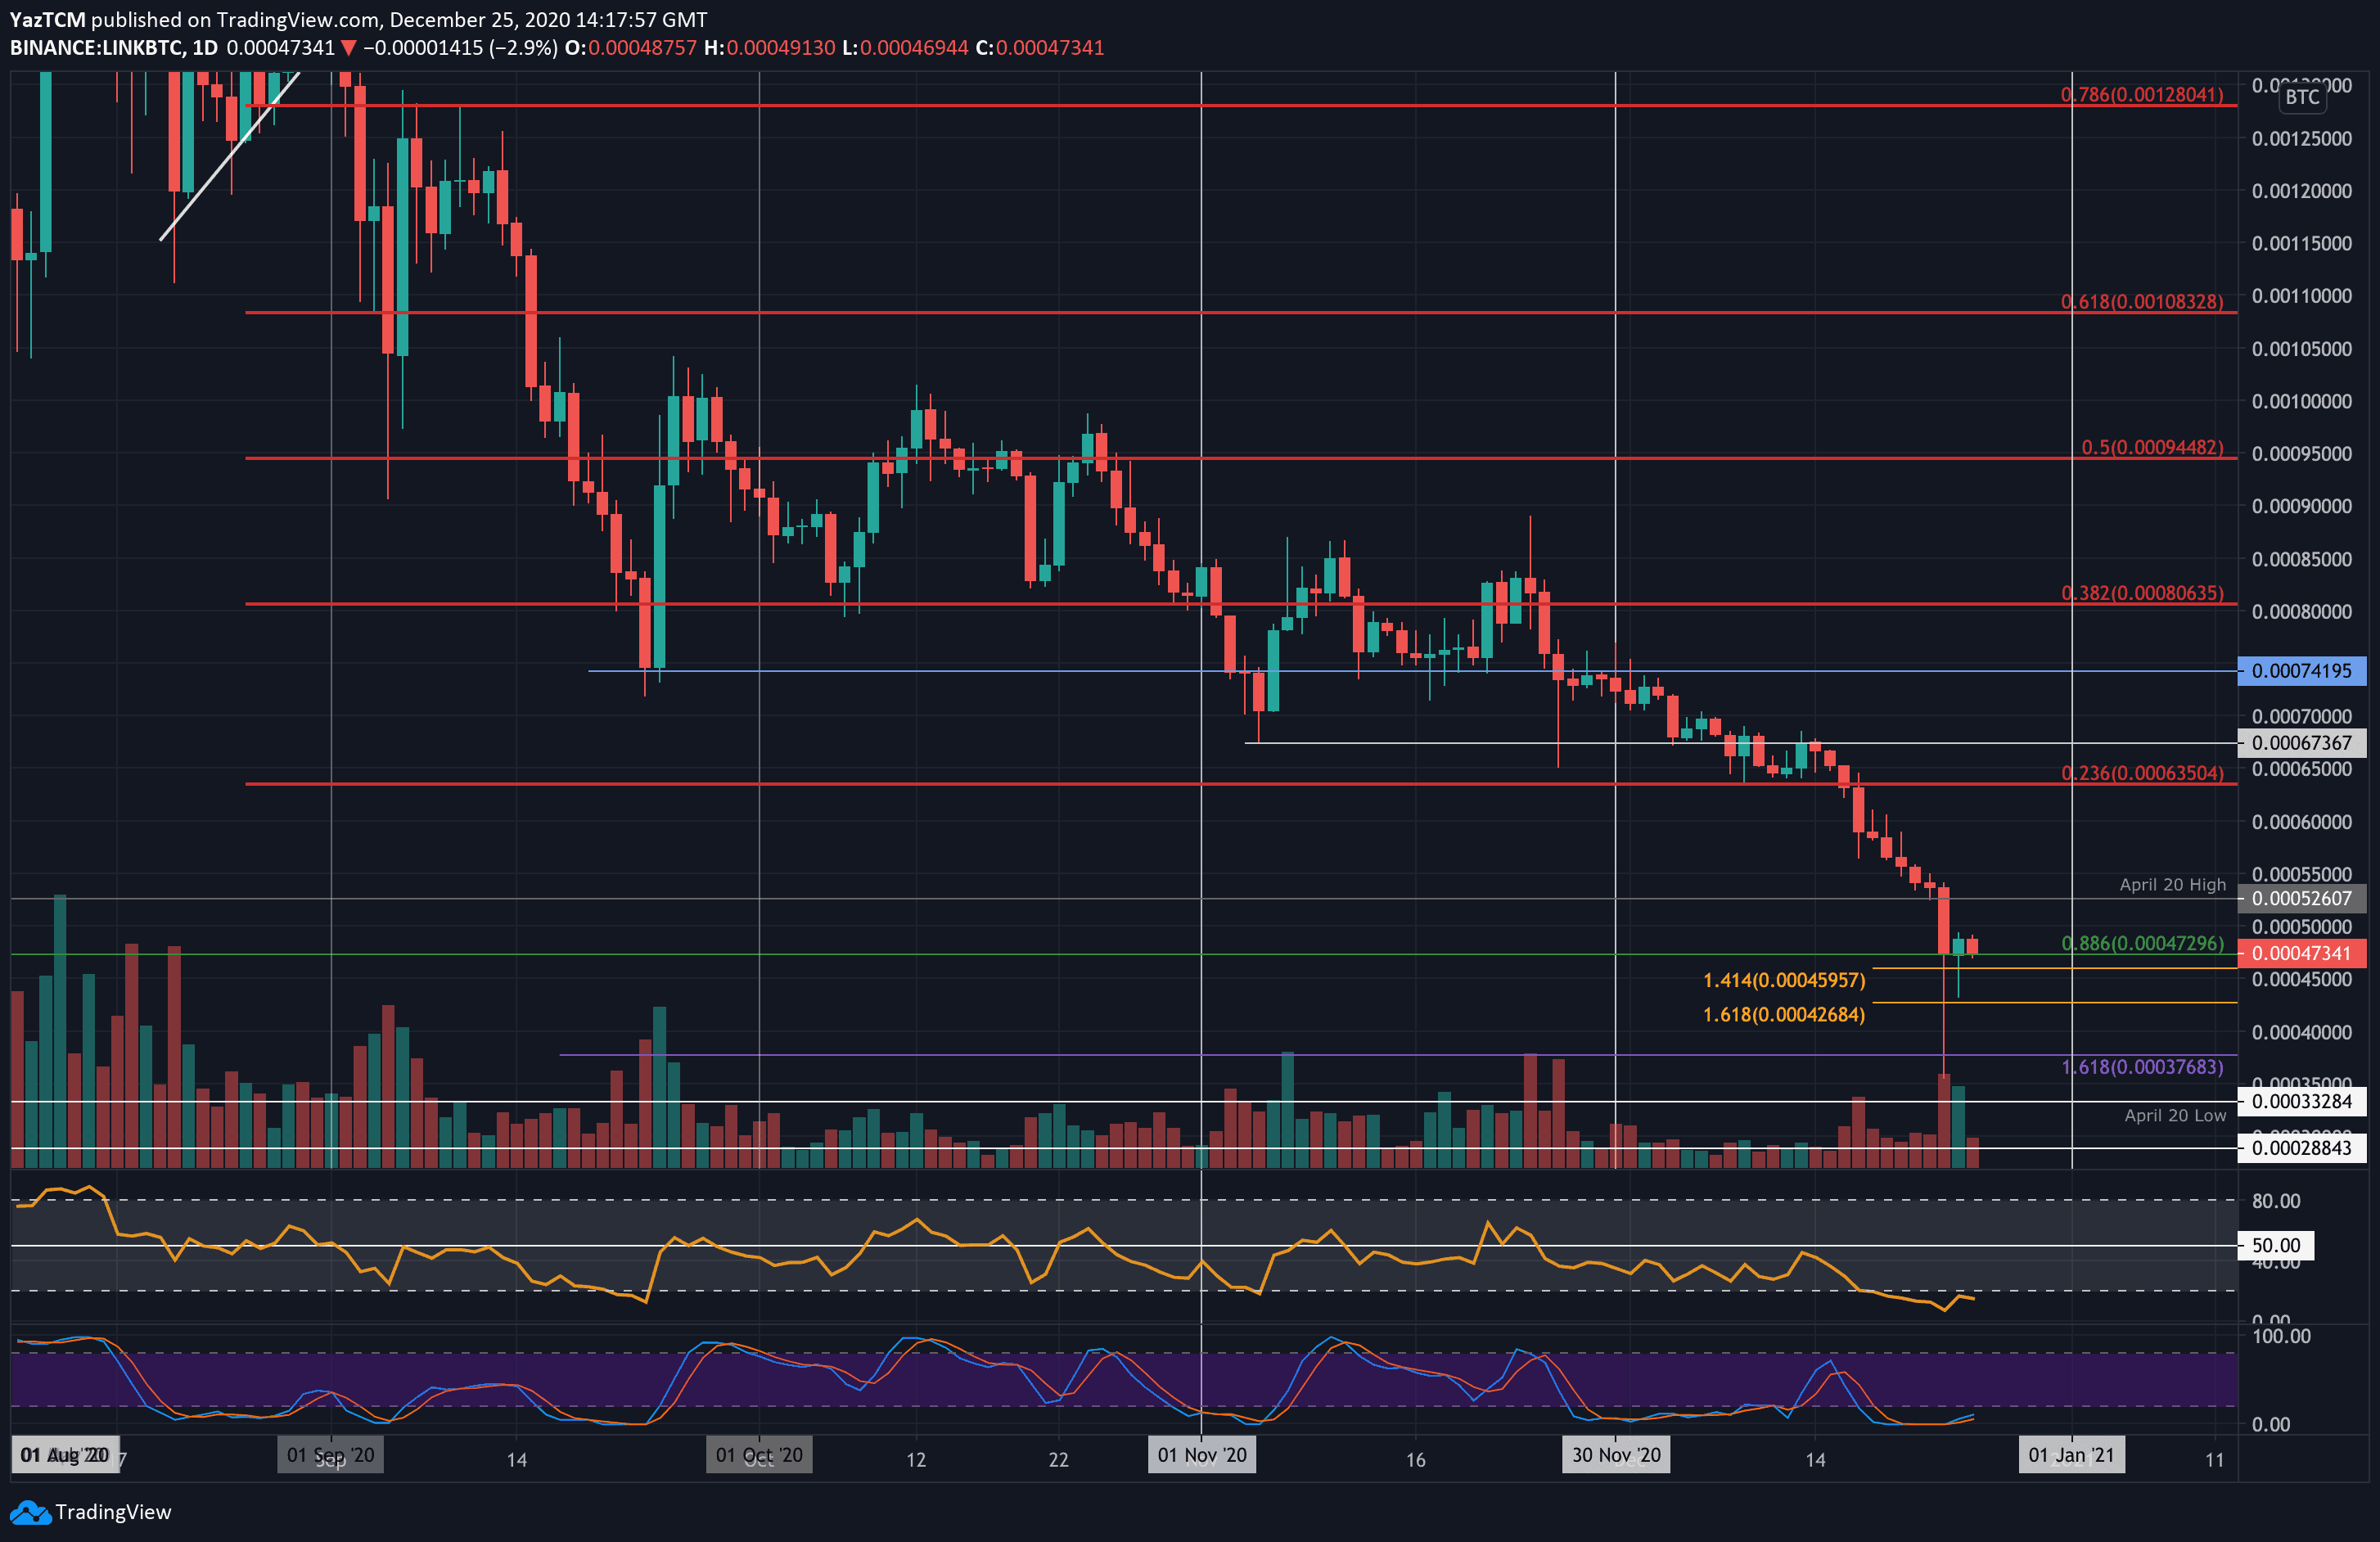
Against Bitcoin, LINK spiked into a fresh 9-month low this week as it dropped as low as 35,800 SAT on Wednesday. By the end of the day, the buyers managed to push LINK higher to close the candle at 47,300 SAT (.886 Fib Retracement). LINK since moved sideways from here.
Looking ahead, if the sellers break beneath 47,300 SAT, the first level of support lies at 46,000 SAT. This is followed by 42,680 SAT, 40,000 SAT, and 37,683 SAT. Added support lies at 35,000 SAT and 33,285 SAT (August 2020 lows).
On the other side, the first level of resistance lies at 50,000 SAT. This is followed by 52,600 SAT, 55,000 SAT, and 60,000 SAT.