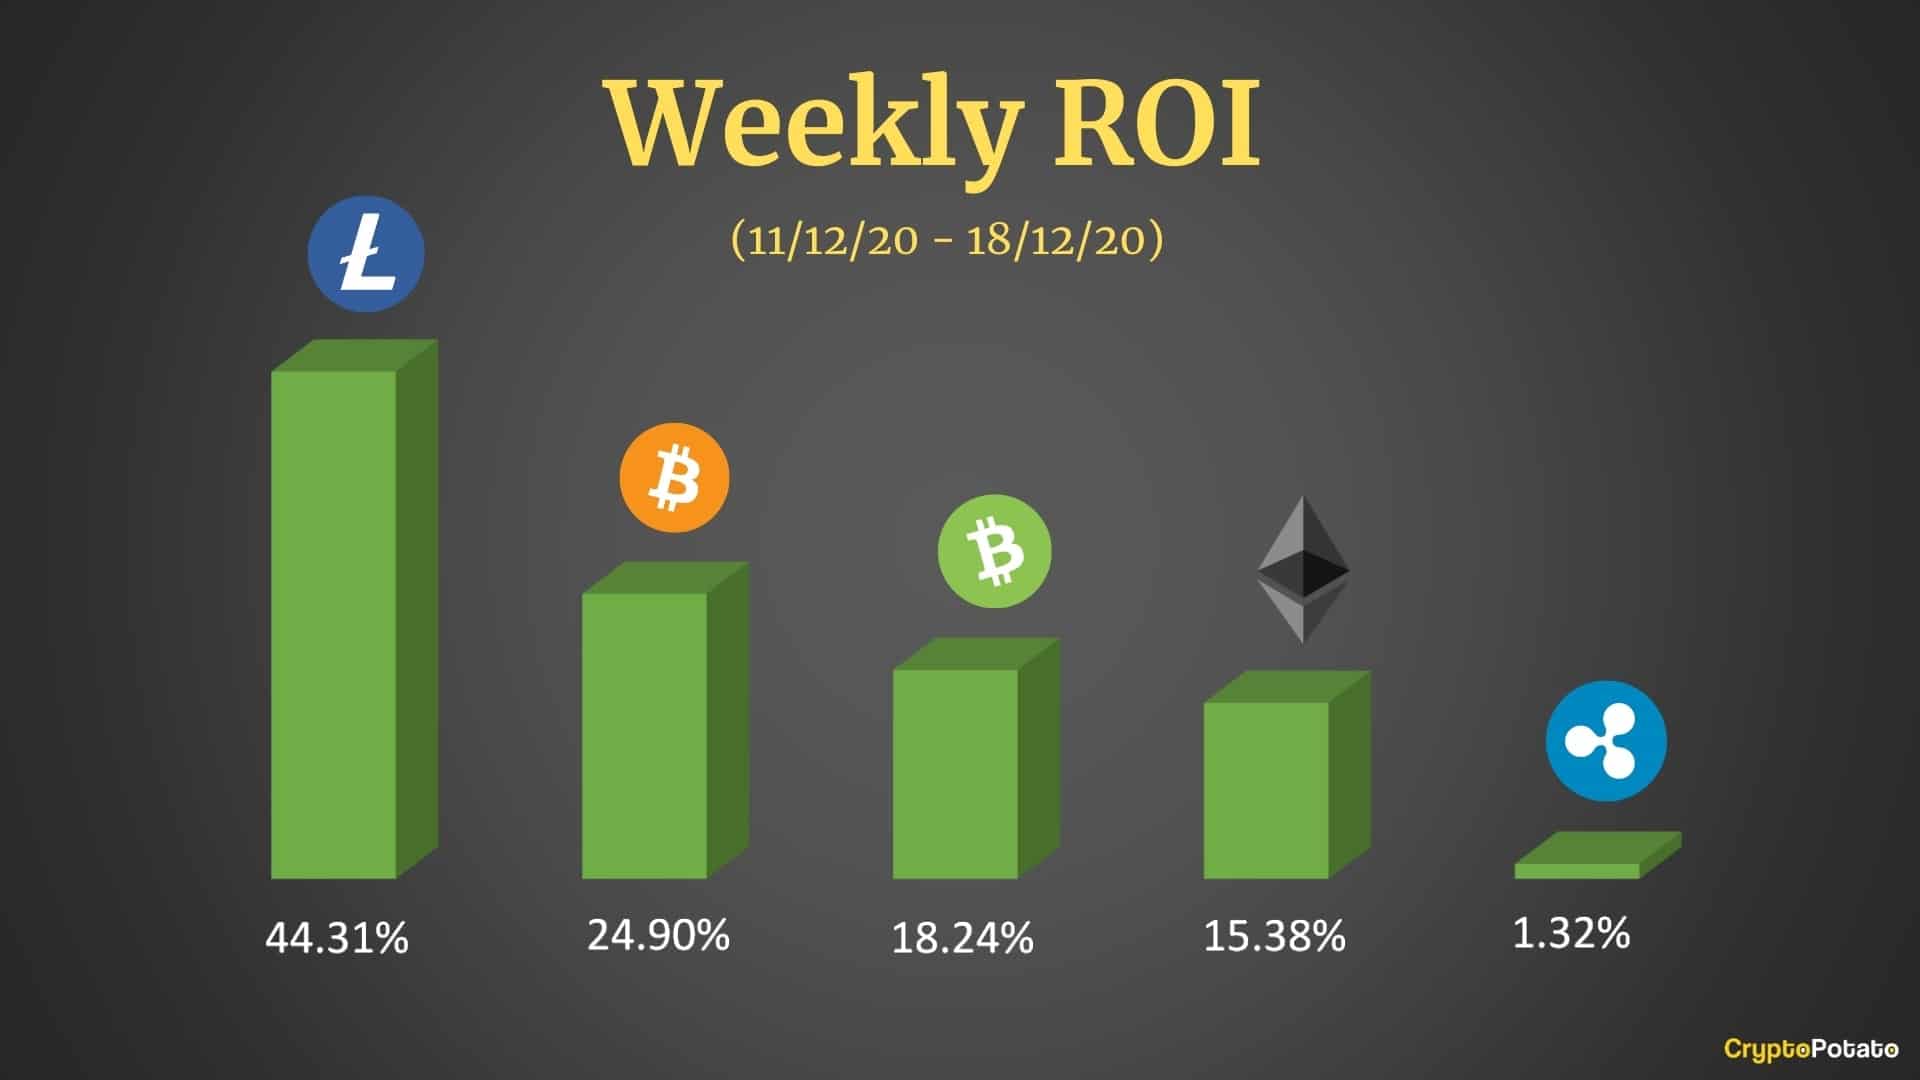
The last week saw the entire cryptocurrency market painted in green. Interestingly enough, Litecoin is the major altcoin that gained the most, with BTC following in second place. Unfortunately for XRP bulls, it failed to realize any substantial profits over the past seven days.
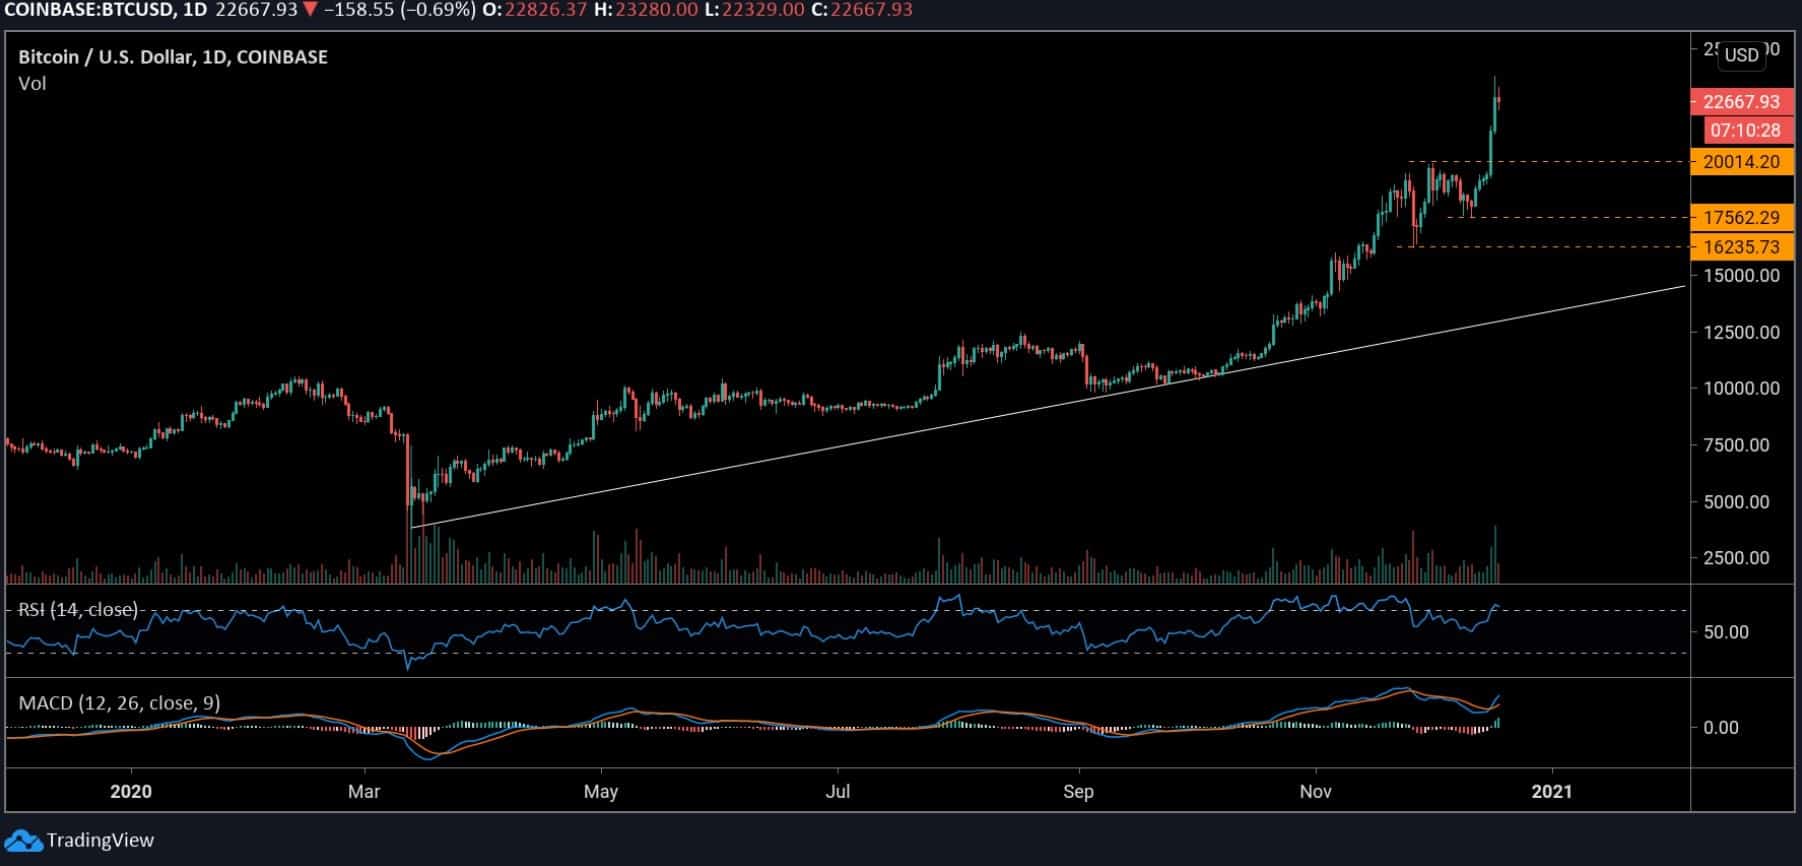
Bitcoin saw an impressive growth over the past few days, resuming its long-term bullish trend with full speed. From around the $17,100 correction level, the leading cryptocurrency bounced back with roughly 25% gains to break above the $20,000 mark. It later registered a new ATH around $23800 yesterday, but the price has dropped to $22,690 at the time of this writing.
Since Bitcoin registered a new high, it has managed to hold the $22,200 level as support. The trend is still looking strong on the daily chart. The buyers would need to retake $23,000 once again to confirm more positive actions.
The resistance to watch above this is $23,200. This is followed by $23,500 and the $23,880 (current ATH level) before advancing higher. On the hourly, Bitcoin held support at $22,660, $22,200, and $21800. If all these support levels fail to hold, then we can anticipate more pullbacks.
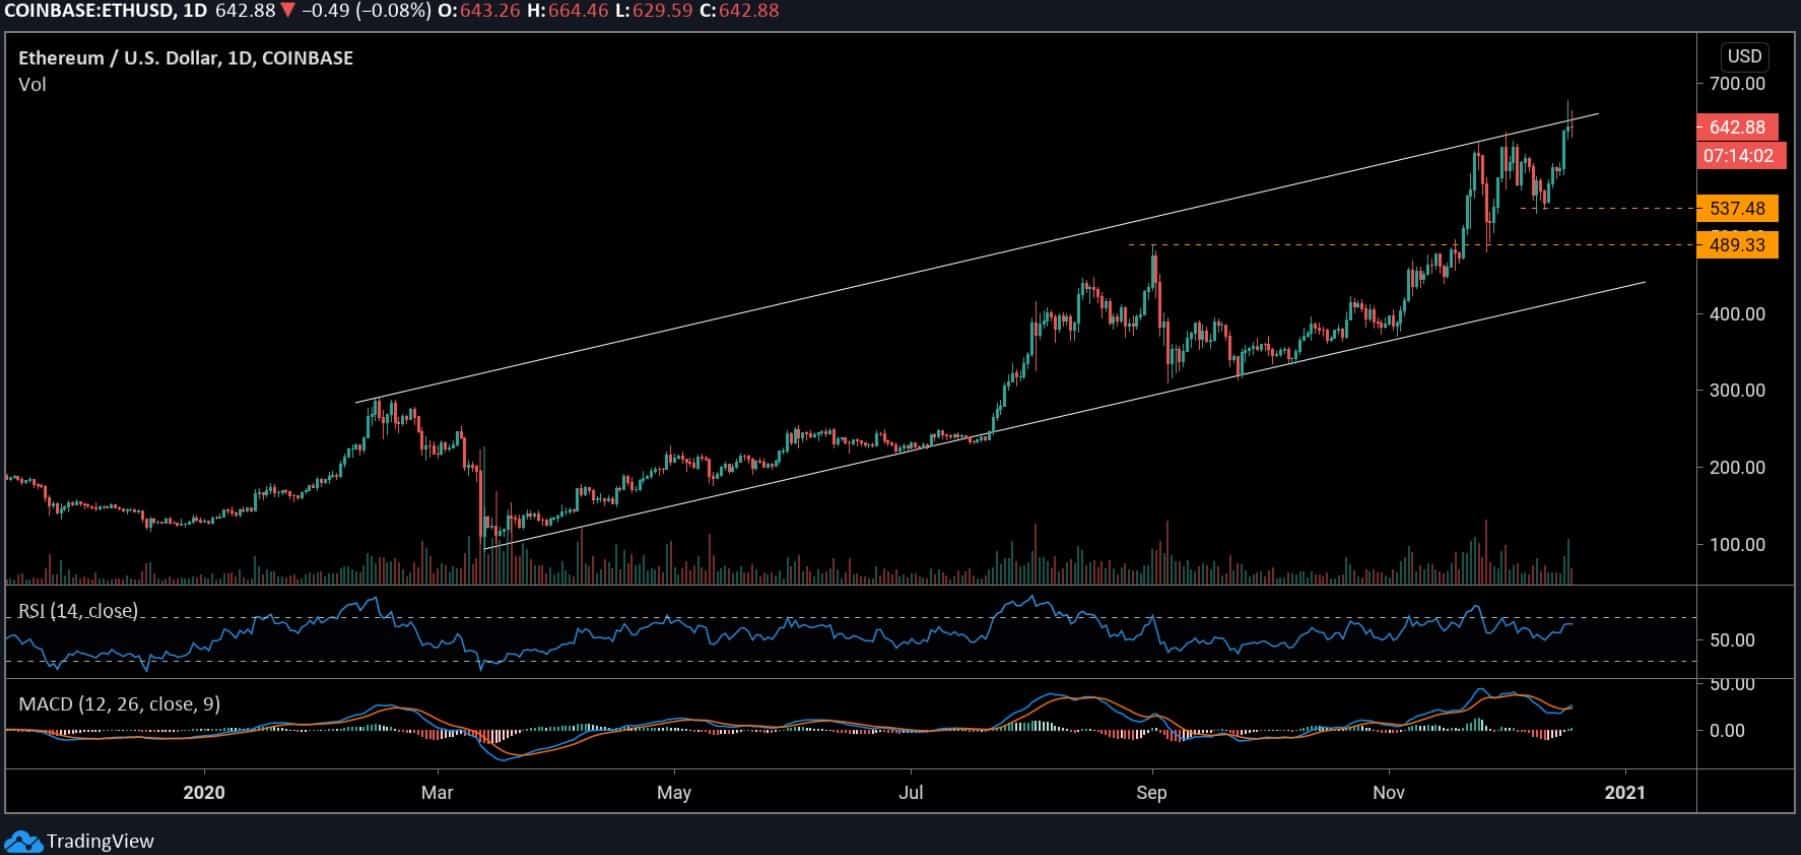
Ethereum increased by a total of 5% today after breaking above the yearly resistance of $636 to a new high ($668) yesterday. But looking at the price actions, it seems the bulls are taking a break at the moment. Yesterday’s channel’s breakout appears faked as price faces rejection around the upper boundary.
Due to this, ETH dropped slightly to where it’s trading at $642. It’s holding support above the yearly level of $636. Further support can be found at $600, $537, and $489.
If the price continues to increase, the $668 level may be retested. The next resistance is likely around $680, $700, $720, and $750. However, the bullish trend remains valid on the daily chart.
Against Bitcoin, Ethereum recently dropped to 0.027 BTC where it saw a slight bounce on a long-term ascending line yesterday. But there’s no sign of a strong bullish presence at the moment. The volume is still insignificant. Looking at the recent price actions, the market is still in favor of the bears from a short-term perspective.
The price is currently stable around 0.0284 BTC. If the sellers resume pressure again, the ETH could collapse beneath the trend line. Support levels to watch are 0.0263 BTC, 0.023 BTC, and 0.020 BTC. Towards the upside, the first important level to watch is 0.030 BTC followed by 0.0337 BTC and 0.037 BTC.
After a three-week correction, XRP found support around $0.47 and bounced back to $0.65 – above the crucial resistance line. The price dropped and it is now looking for a retest around the same line. This recovery was characterized by a daily bullish engulfing candle to indicate that bulls are back in the market.
It is currently trading at $0.568 after seeing daily 8% gains. XRP could retest the $0.5 level before it resumes buying pressure. Supports below this level are $0.47 and $0.395. But if the price increases, it could retake $0.65 before targeting $0.71 and $0.77. Still, from a weekly perspective, XRP is lagging behind with insignificant gains over the past seven days.
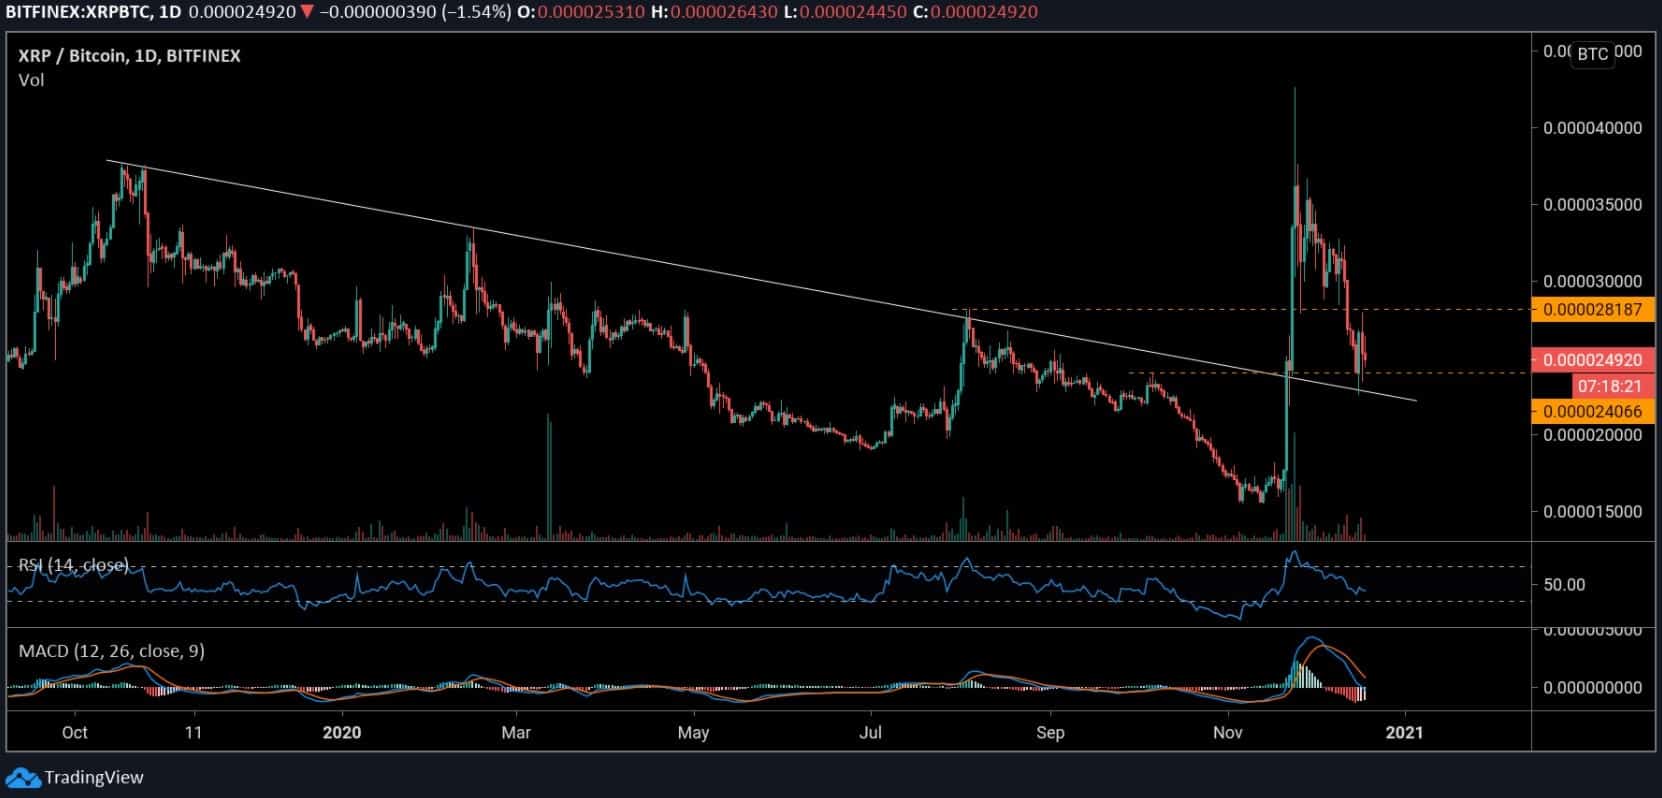
XRP saw a mild recovery after retesting key resistance-turned-support on Wednesday. It is now consolidating above the 2400 SAT level. While the trend remains neutral-bearish from a short-term perspective, a major recovery could set a fresh increase for the third largest coin by market cap.
For now, the levels to watch on the upside are 2800 SAT and 3000 SAT, followed by 3300 SAT. The next resistance is found at 3600 SAT and 4000 SAT. On the downside, weekly support is pinned at 2200 SAT. If this level fails to hold, the price could further slip to 2000 SAT and 1700 SAT.
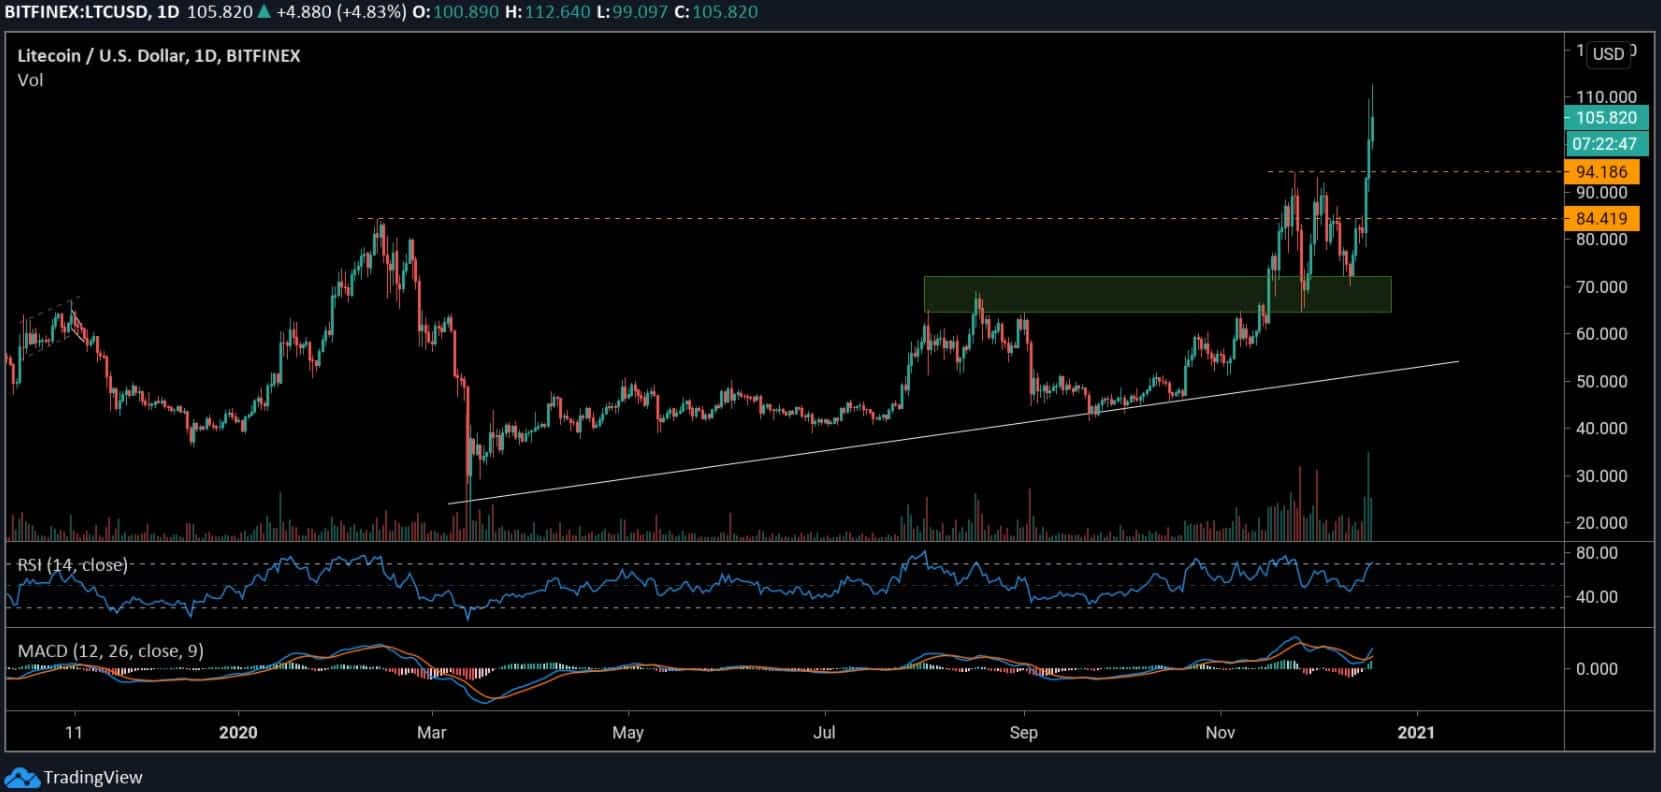
Litecoin recorded 44% gains in the past week after it found support at $70. Today, the price hit a new yearly high of $112.9 following yesterday’s surge above $94 – now acting as support. LTC has dropped a bit to $108 at the moment but a continuation seems likely.
In this case, it would need to reclaim the $112.9 daily resistance before we can anticipate a new high around $117 and $120. However, if the buying volume fails to increase, a small pullback could slip the price to $105, 103, and $100. Below this, the key levels are $97 and $94.
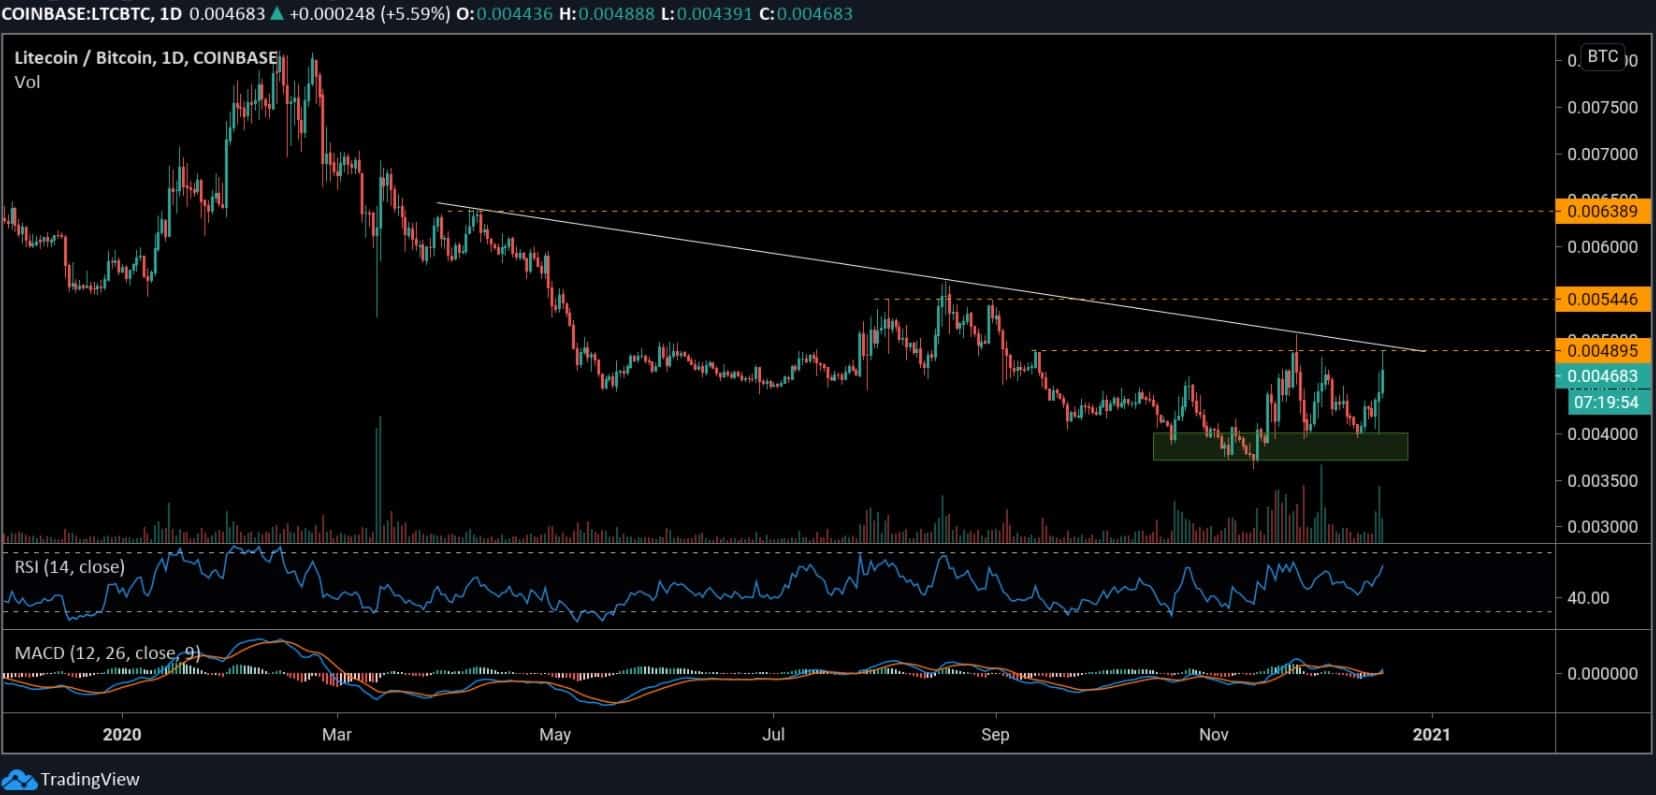
Litecoin managed to establish support above the 0.0035 BTC level. Following the last 7-days increase, the price is now trading around 0.0047 BTC as more positive actions seem underway. The double-bottom formation on the daily chart also indicates an imminent bullish reversal pattern.
However, it may fail if the descending trend line continues to act as a resistance. A significant break above this line (0.00489 BTC) would confirm a reversal pattern. The following resistance levels are 0.005446 BTC and 0.00689 BTC. As of now, the 0.0040 BTC level is serving as monthly support.
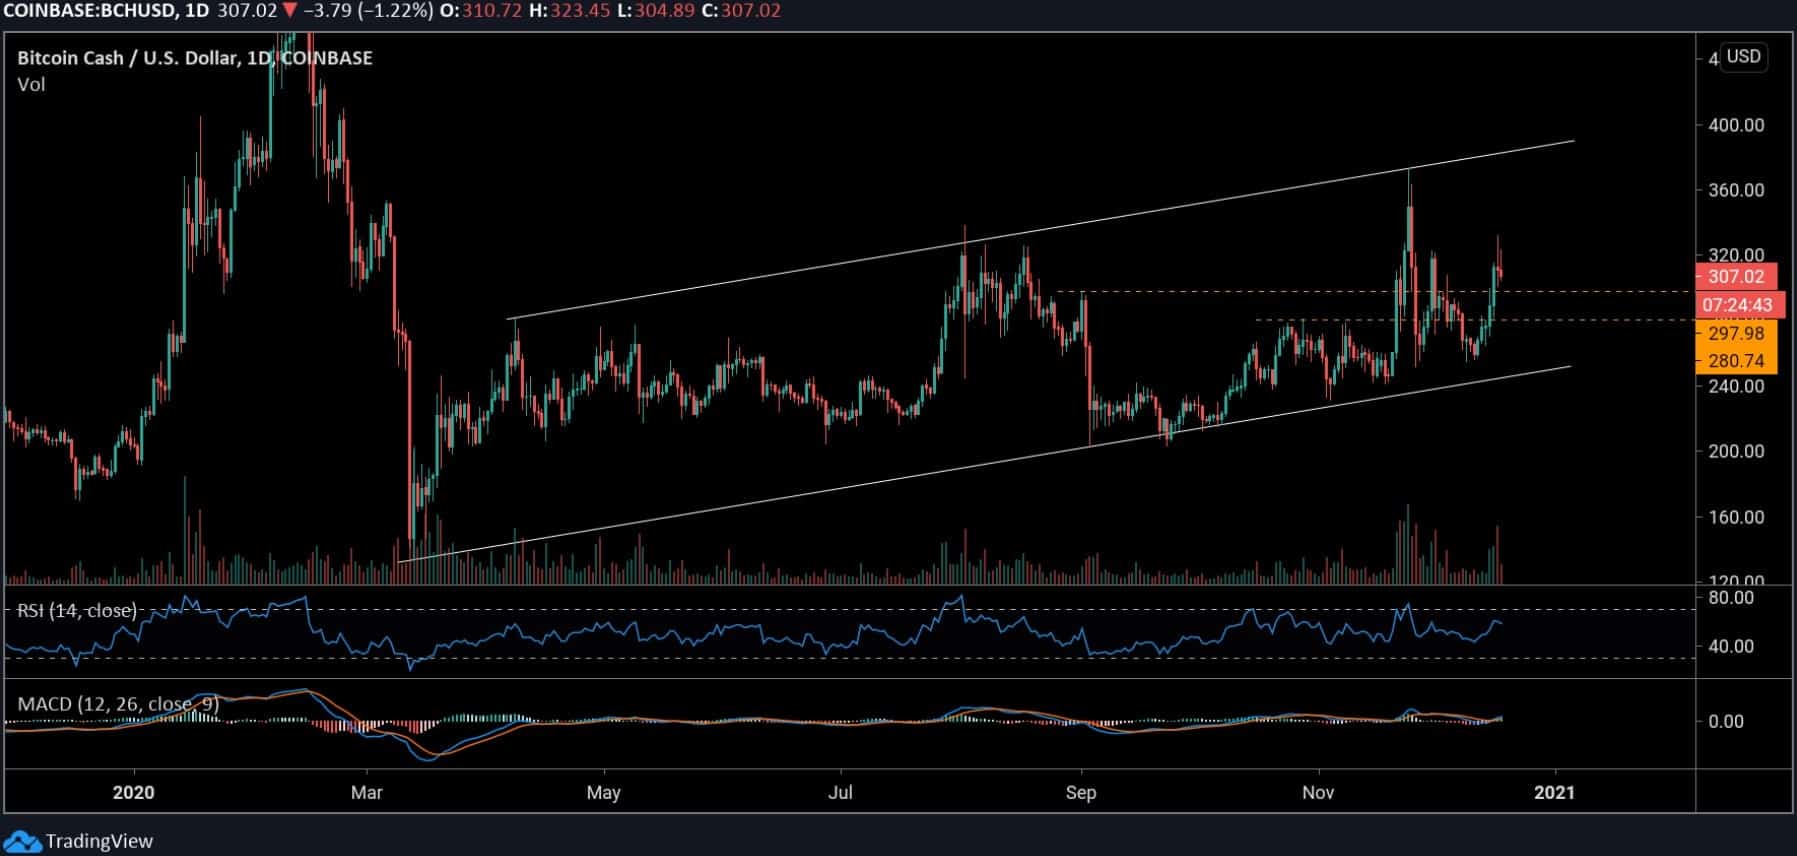
This week, Bitcoin Cash increased by almost 20%. The price touched $330 yesterday but it dropped to $307 at the time of writing. However, more bullish momentum seems likely in the next few days.
While the price remains trapped in an ascending channel, the next push can be anticipated to retake $330 and potentially $345, $360, and $370 around the channel’s upper boundary. In case of a decline, there’s support at $297 and $280.
Against BTC, Bitcoin Cash continued to lose momentum on a long-term perspective. As suggested by the technical MACD indicator, the cryptocurrency has been trading in a bearish zone for a while now. There’s no sign of bulls in the market.
Currently, BCH is holding 0.01359 BTC as yearly support. If it breaks down, a new low may be established around 0.01 BTC. In the opposite direction, a strong bounce on the RSI 30 could initiate a push to 0.015 BTC. More positive actions can be expected at 0.020 BTC and 0.025 BTC if the price breaks above the resistance line.