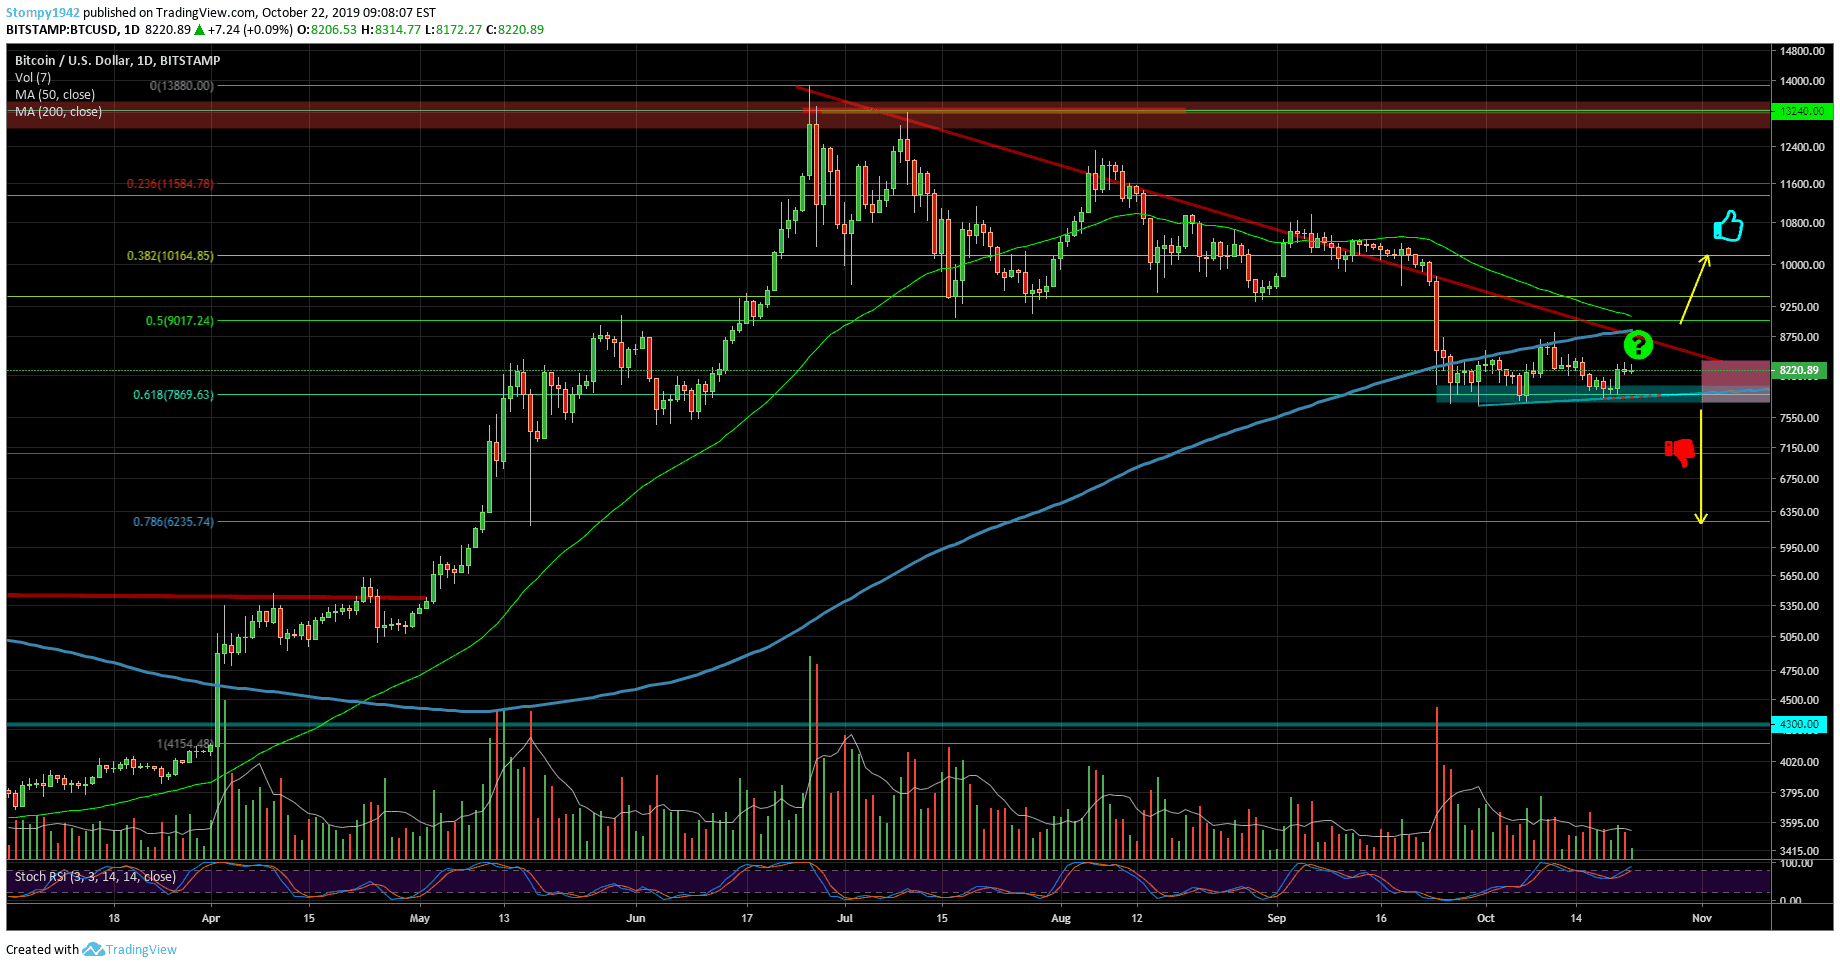
The price was supported on critical levels as indicated in the chart. Meanwhile, it holds positively and produces higher lows that are technically healthy. However, it should be considered that a potential correction could set us back as far as $6,000. Support in the $8,000 range held this week. We saw a failed attempt to break above the 200MA and the upward trend stopped at $8,350.
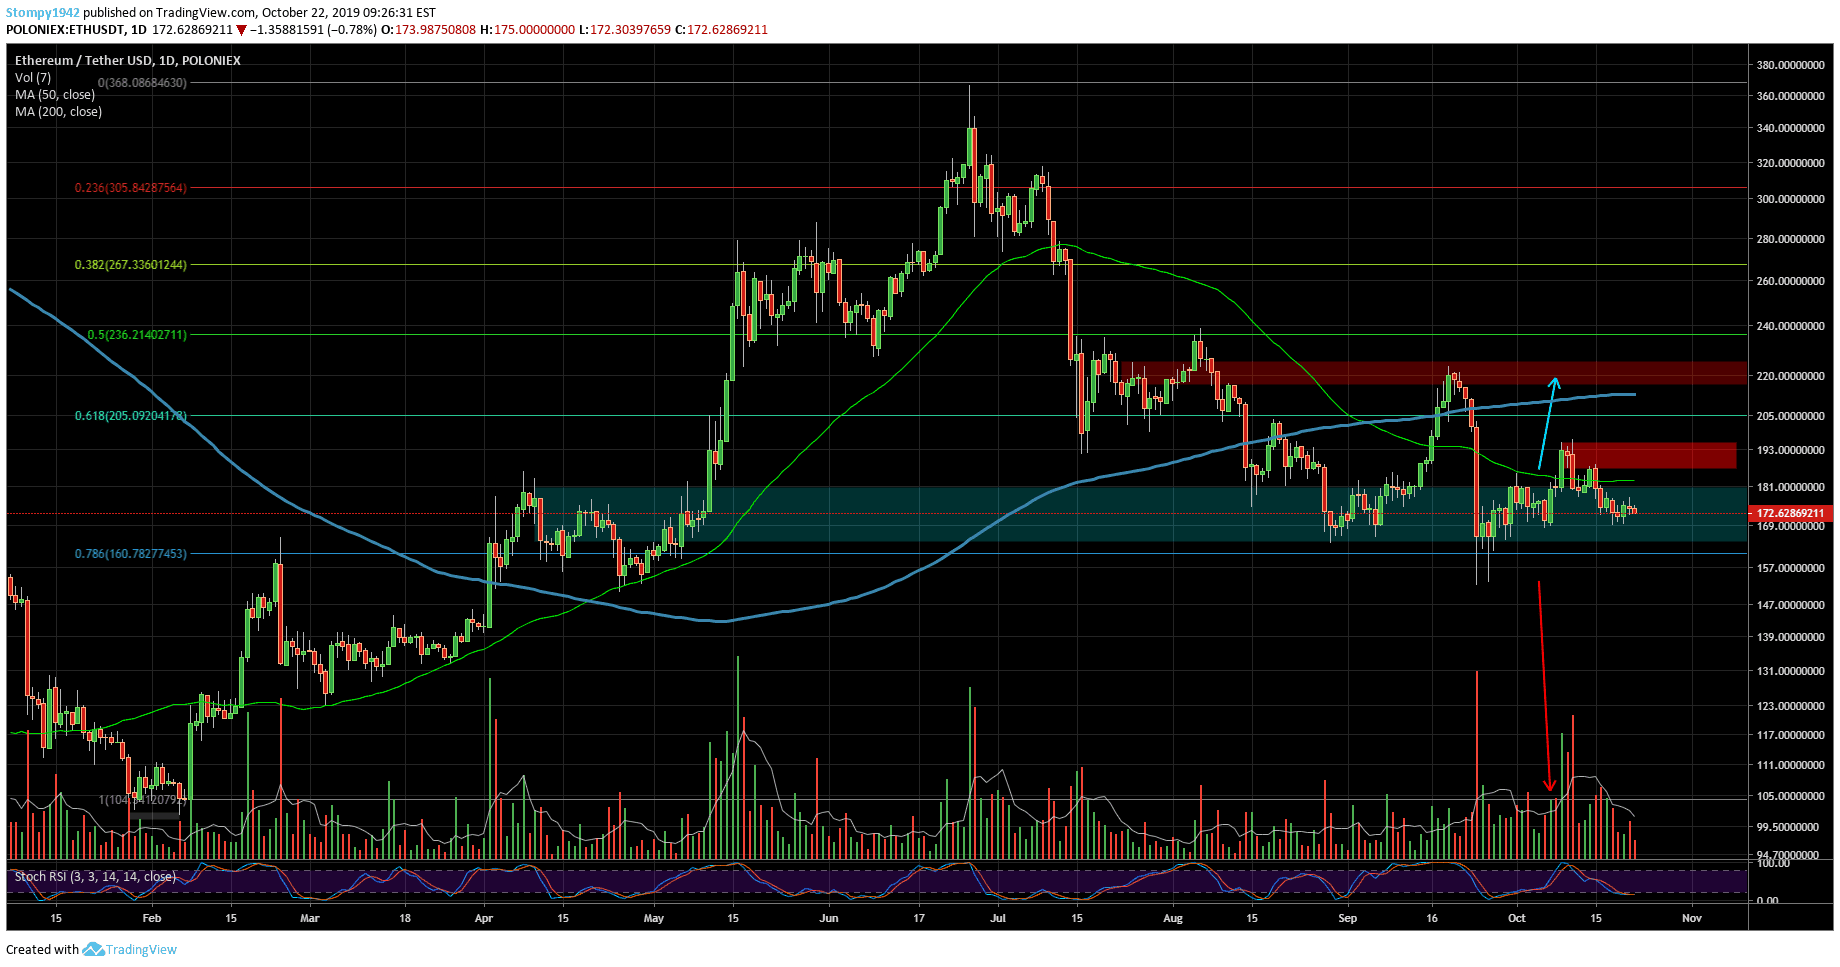
Against the USD, the price has been relatively stable since the last correction. Resistance is at $195. Support in this range is at around $170. The RSI is low and despite the increase in sellers, the price hasn’t been affected.
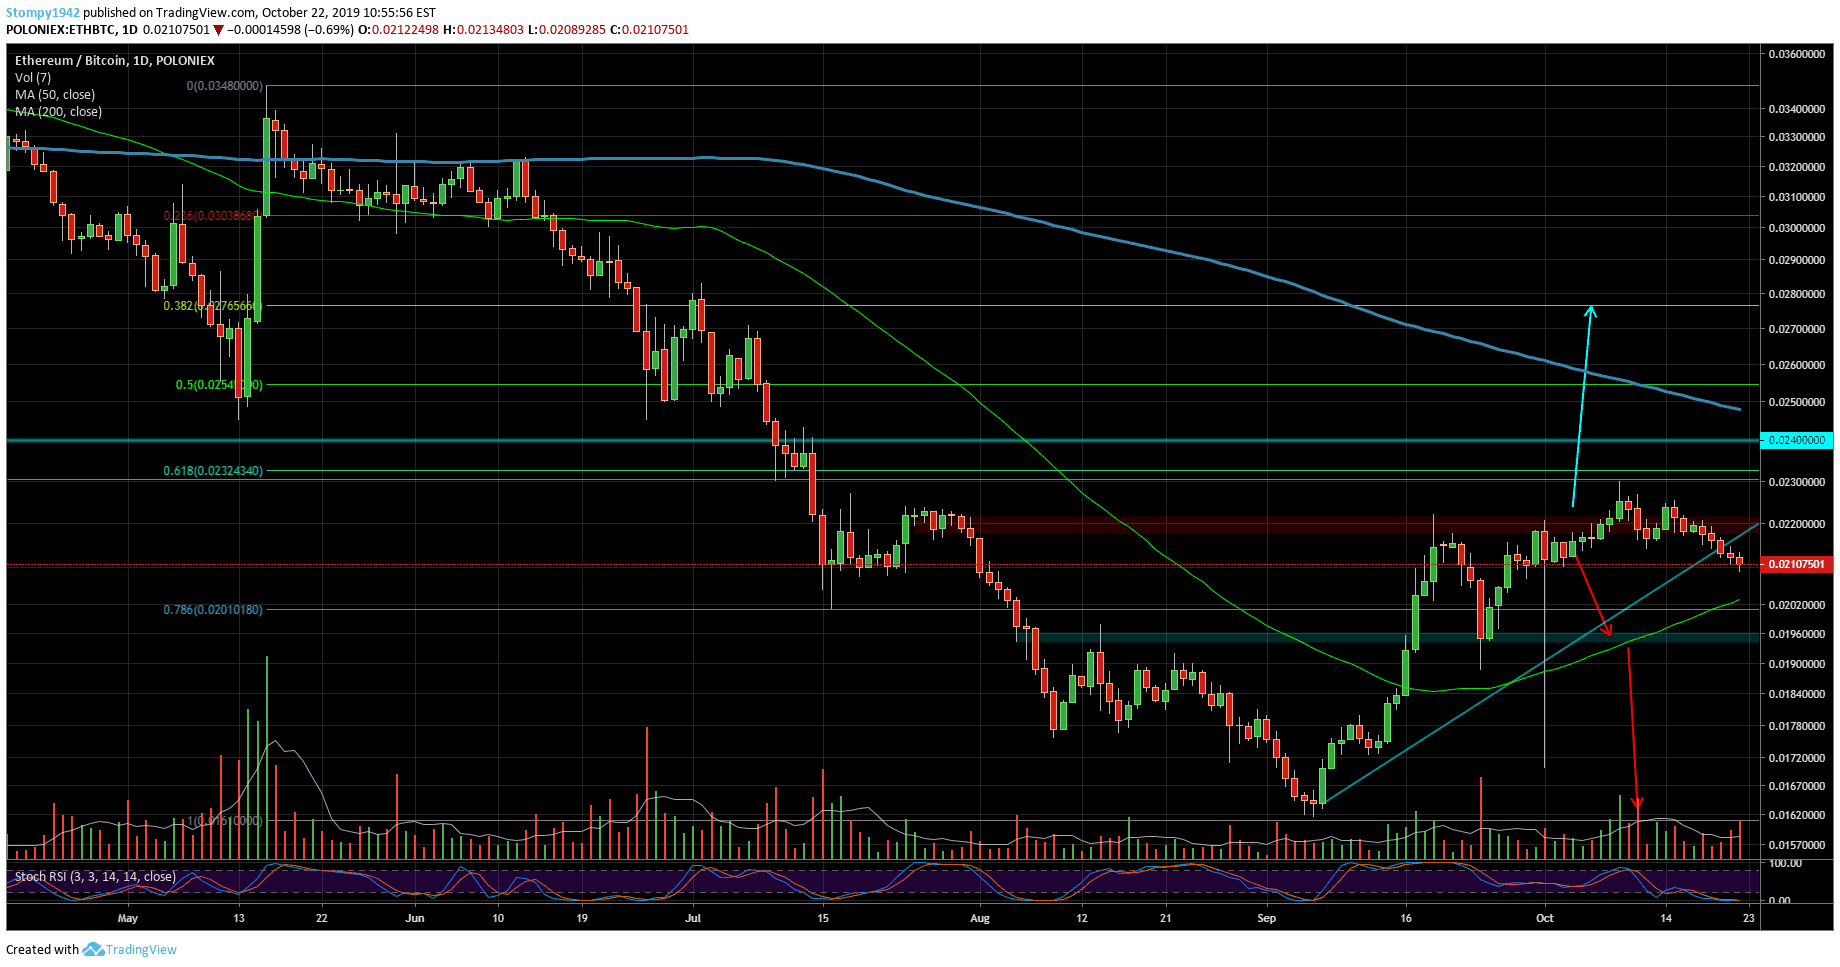
Against BTC, the trend was broke and we’re looking for support. Meanwhile, it’s in the 0.021BTC range. The next level of support is expected at 0.02BTC. Resistance in this range is at 0.022BTC. While the upward trend is falling apart, price is still above the 50MA which is a positive sign. The RSI is very low.
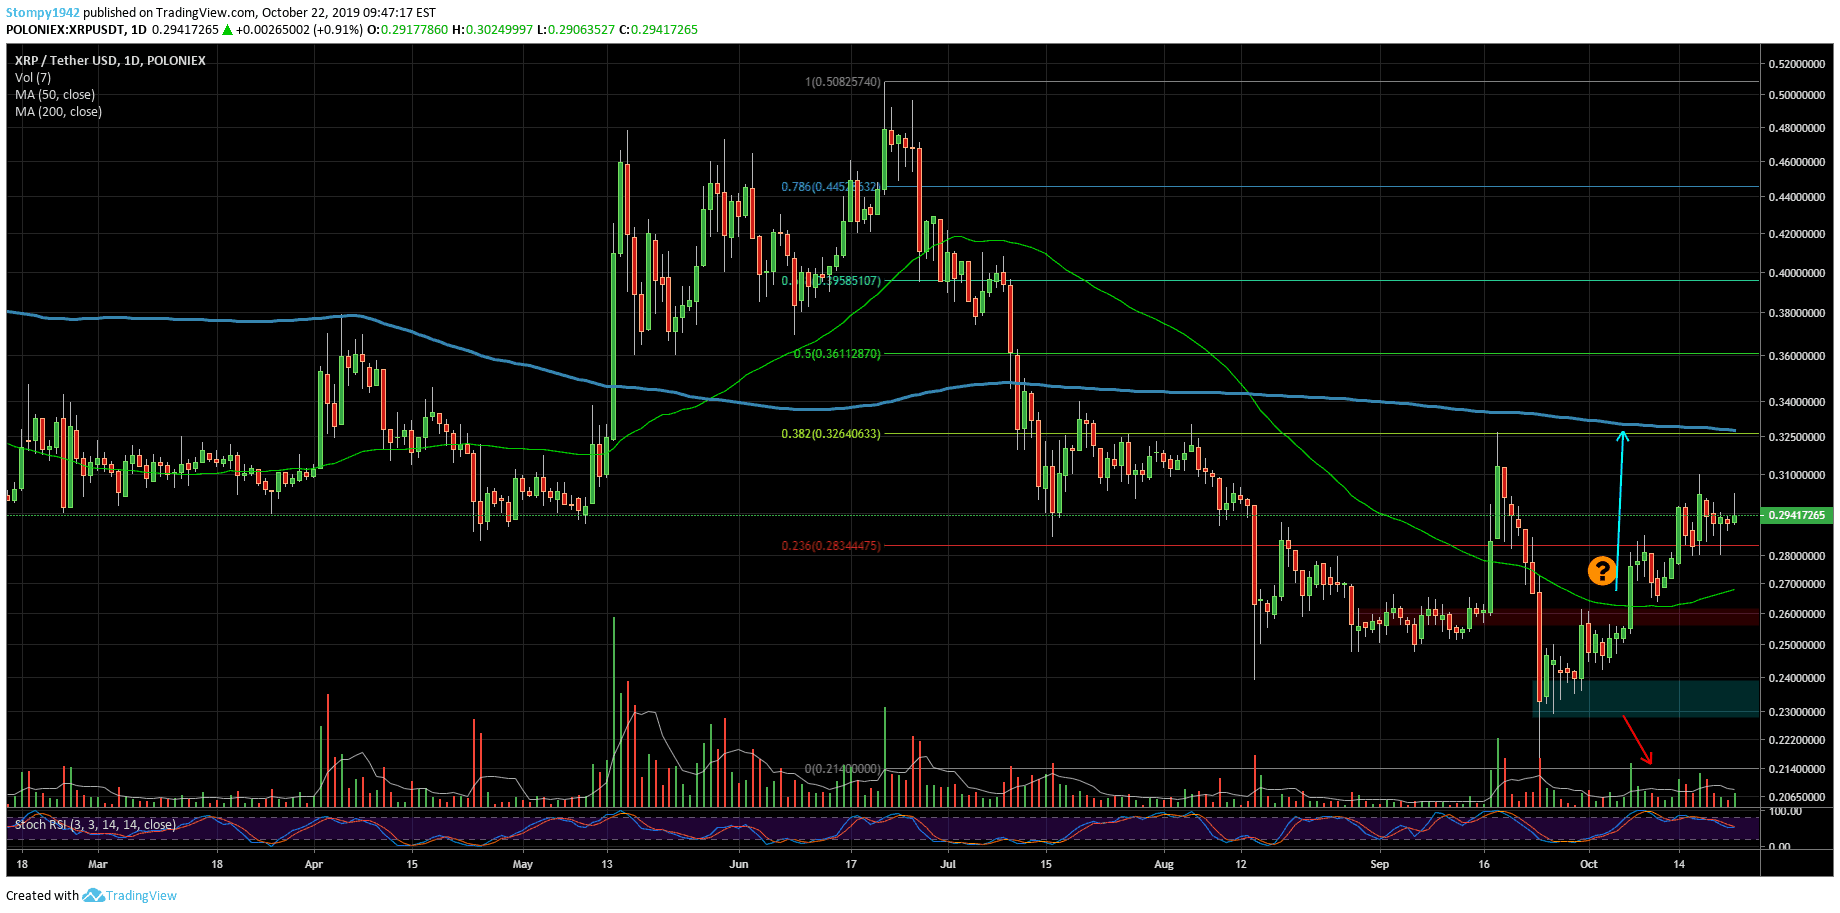
Against the USD, the trend continues to rise towards the 200MA as we have indicated. This seems to be the target and there is resistance at 32 cents. Support is around 28 cents. However, is it a positive trend or is it a double top here and it’s a trap?
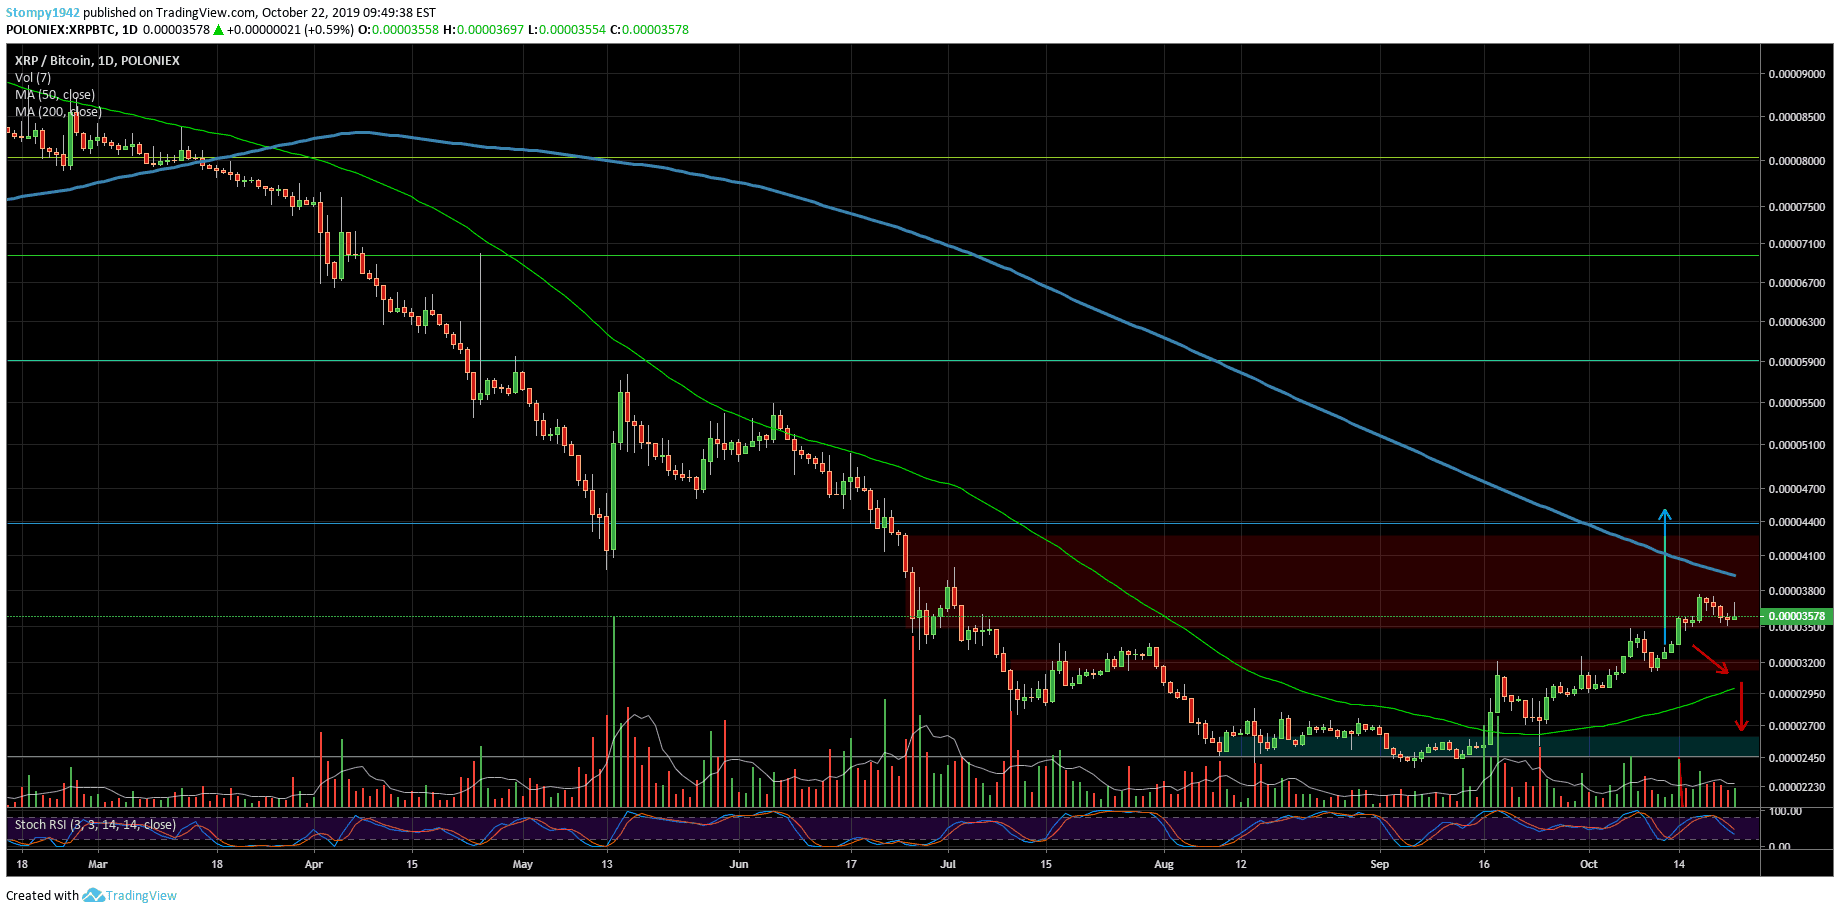
Against Bitcoin, the upward trend hasn’t been tested at the 200MA at 3900 SAT. If this resistance breaks, the next one is expected at 4400 SAT. Support is seen at 3300 SAT.
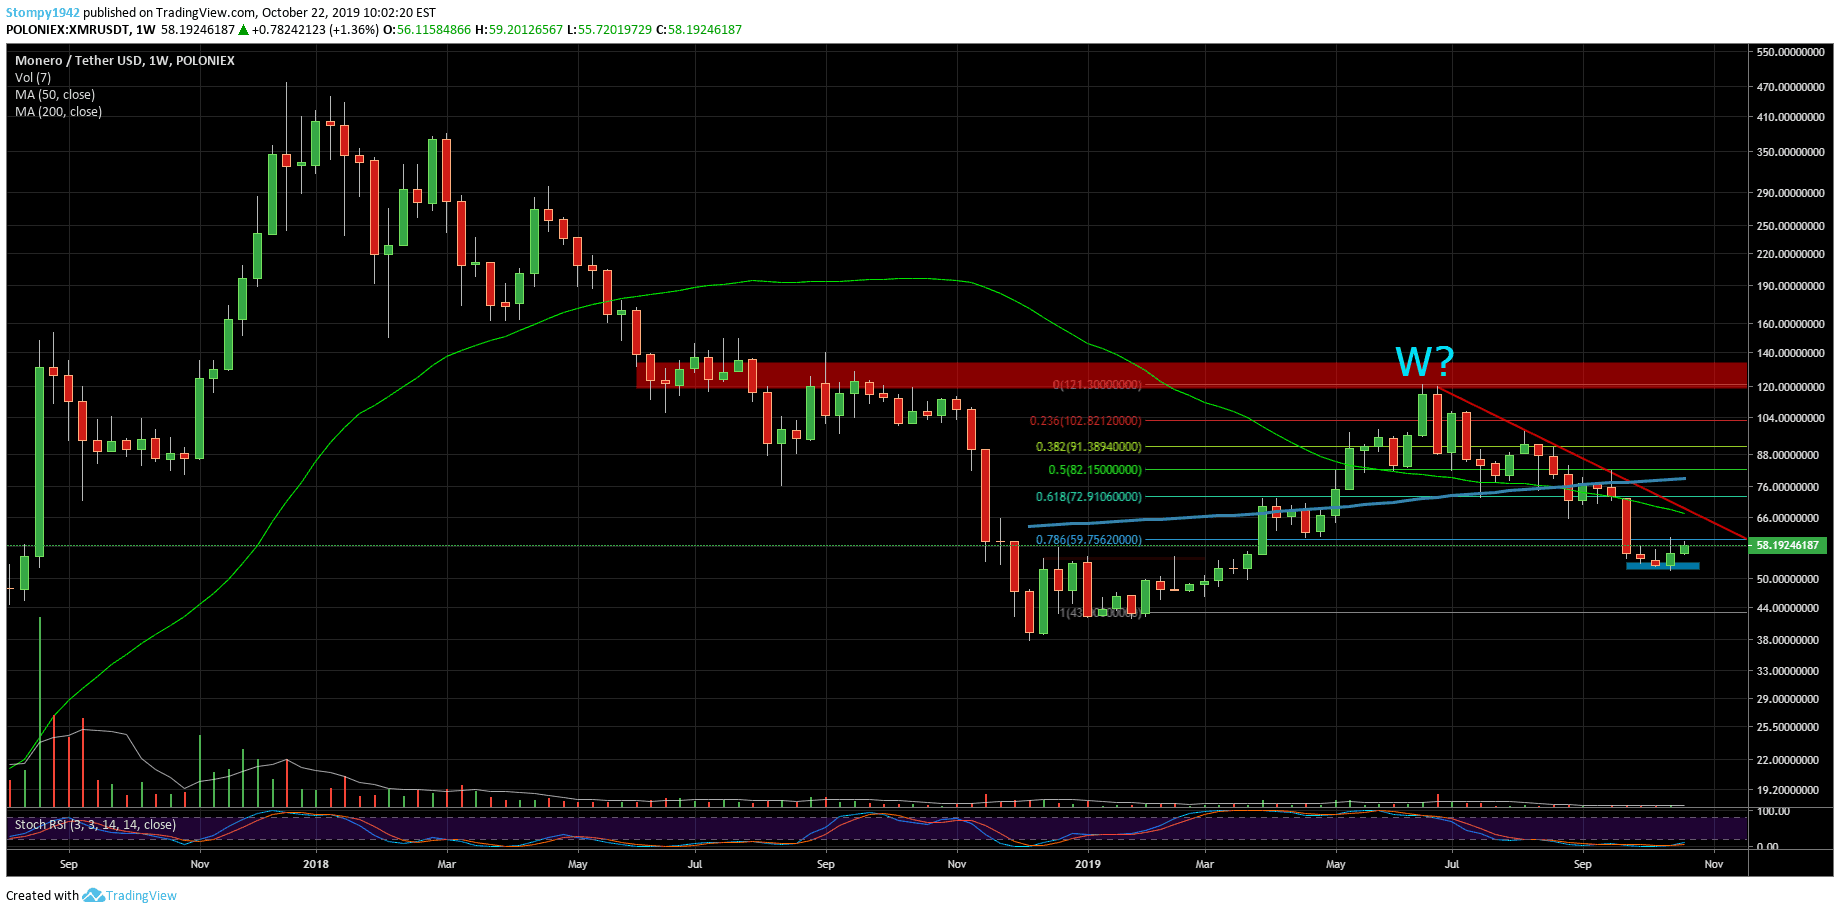
Against the USD, support and demand cycles in the $50 range. If this level fails, the next support can be estimated at around $44 according to Fibonacci and the previous bottom. Resistance is at $60. The 50-20MA line is far away and the RSI is at the bottom. If the resistance at $66 breaks, the next one is expected at around $75 at the 200MA.
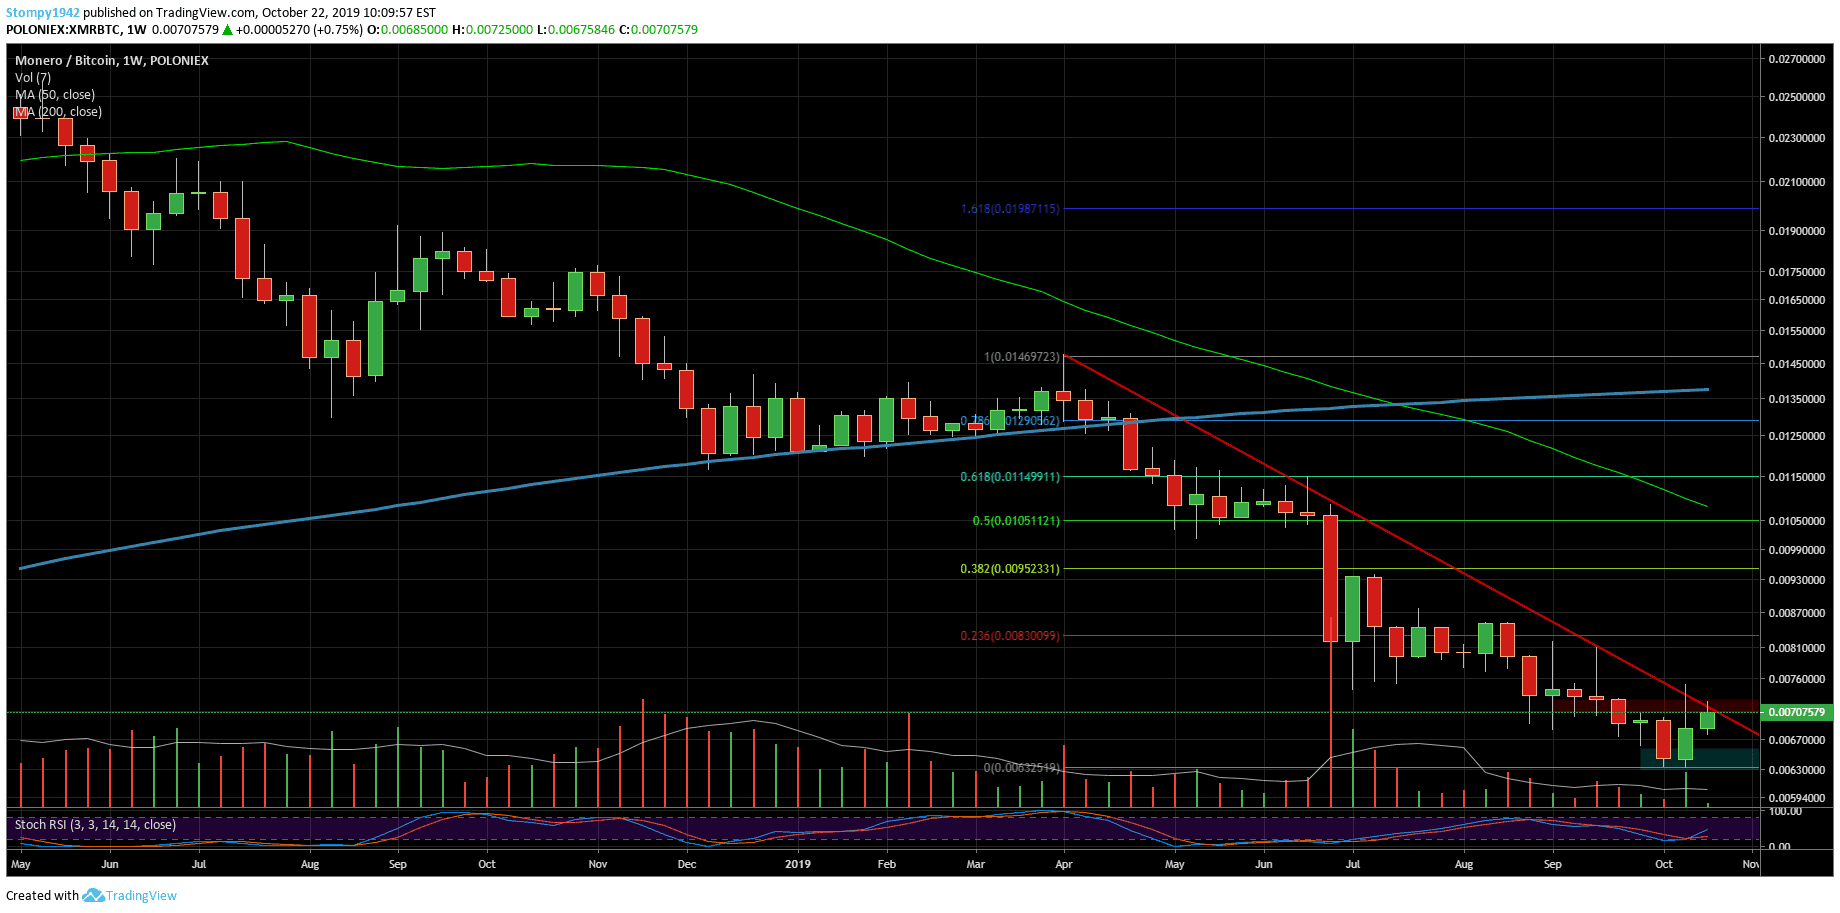
Against BTC, the trend is going down and the attempts to change it have failed. Only a 15-20% increase would bring confidence back to the market. Resistance in this range is at 0.007BTC while support is found at 0.006BTC.
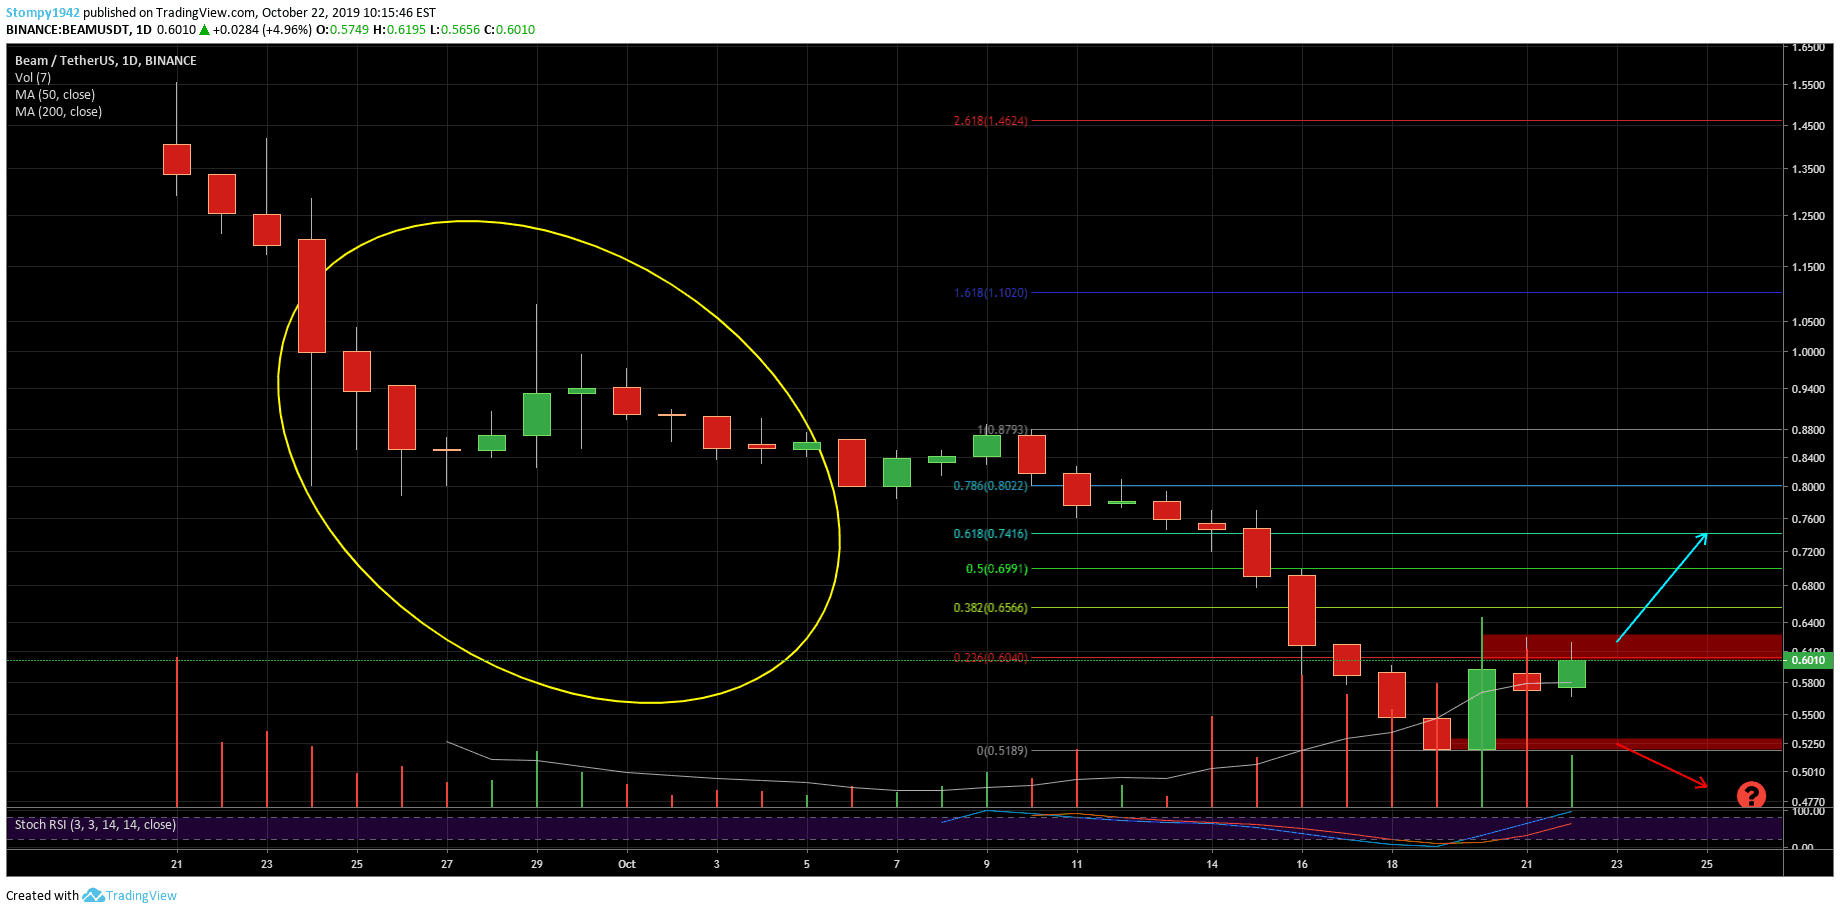
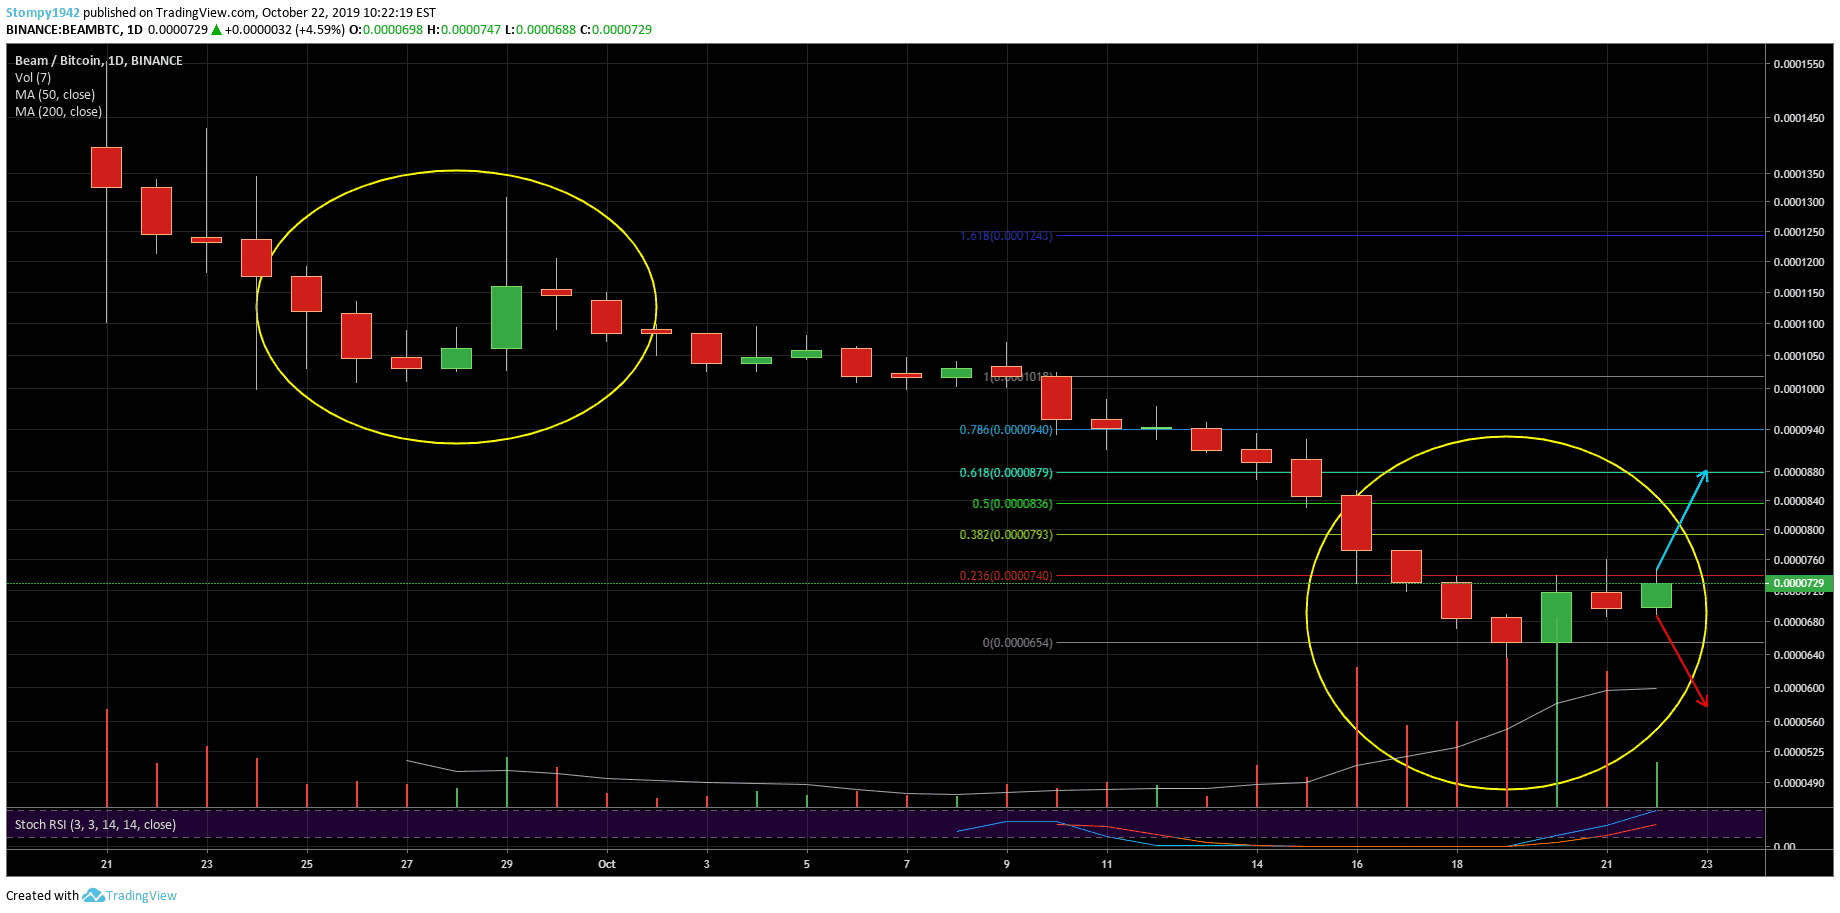
Against the USD, there’s not a lot of trading information but we still got analysis and tried to figure out where the levels are and what moves should we keep an eye out for. The bottom is at 52 cents with a high trading volume. Support is at 56 cents while resistance is at 64 cents. In general, it looks similar to the move we marked in the yellow circle so it’s important to consider that from here we can also find a new bottom. On the other hand, if the resistance breaks in and the price manages to rise above the 0.618 Fibonacci levels, it will be very positive and we can see a change in the trend.
Against BTC, the chart looks technically similar to what we saw against the dollar. We marked the move in yellow once again and if we see consolidation above the 0.618 Fibonacci levels, this would bring confidence back to the market. In the meantime, support in this range is at 680 SAT and resistance is at 740 SAT.