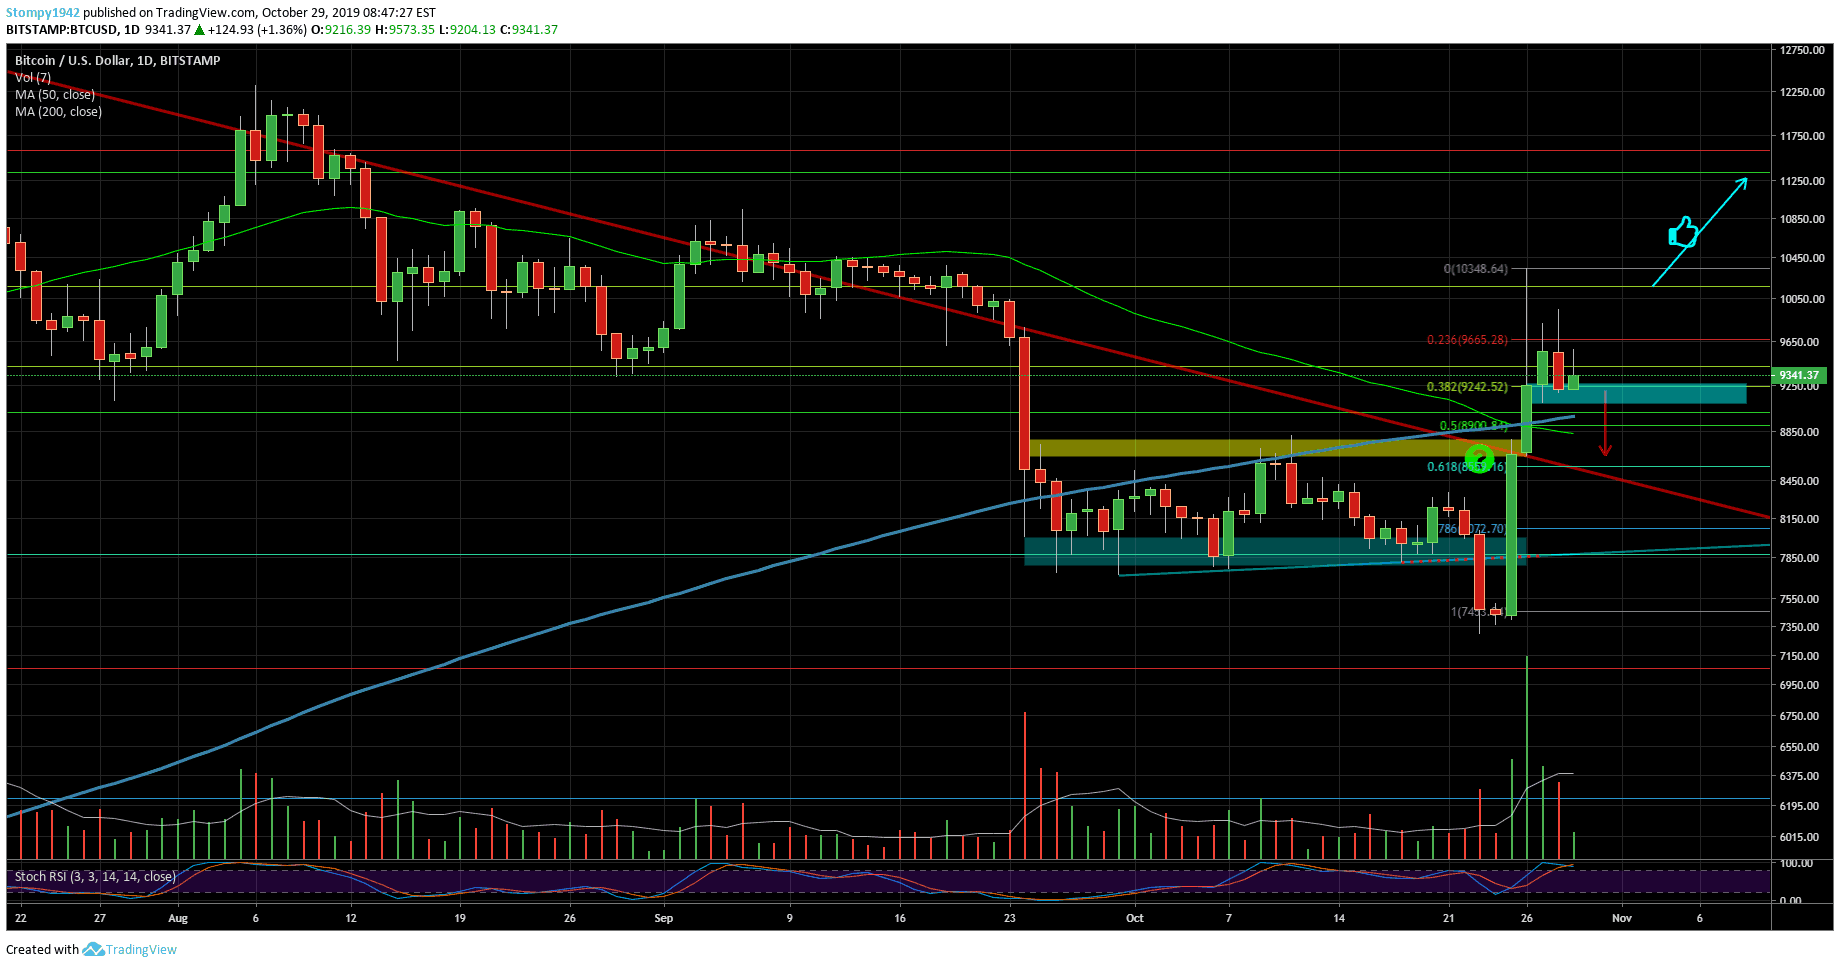
The spike from $7,350 to $10,348 brought the hype around Bitcoin back and the declines are already behind our backs. The price corrected down to $9100 and we can also see attempts to build support in this range and the 0.38 Fibonacci levels, suggesting a bullish trend on the charts. A healthy correction would restore the 0.618 Fibonacci levels in the $8500 range, leading up to the next level at $10,200.
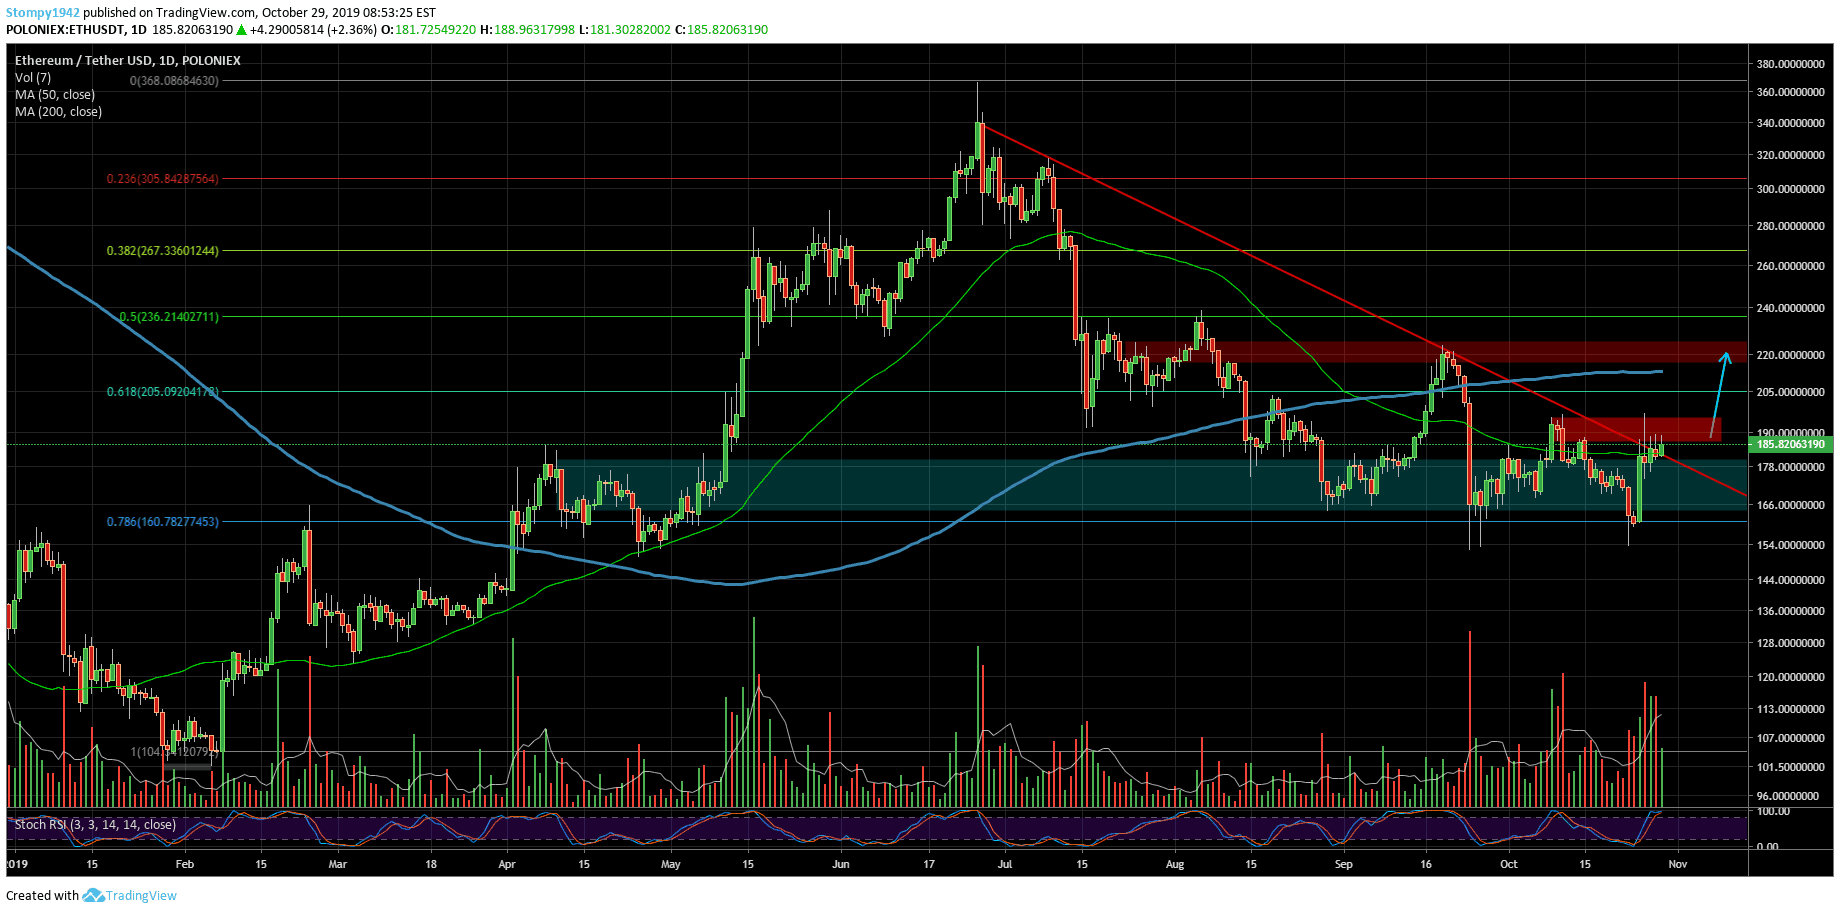
Against the USD, the price is trying to break the resistance built around $190. If it does get through, we can expect the next resistance at $220. The support in this range is around $175.
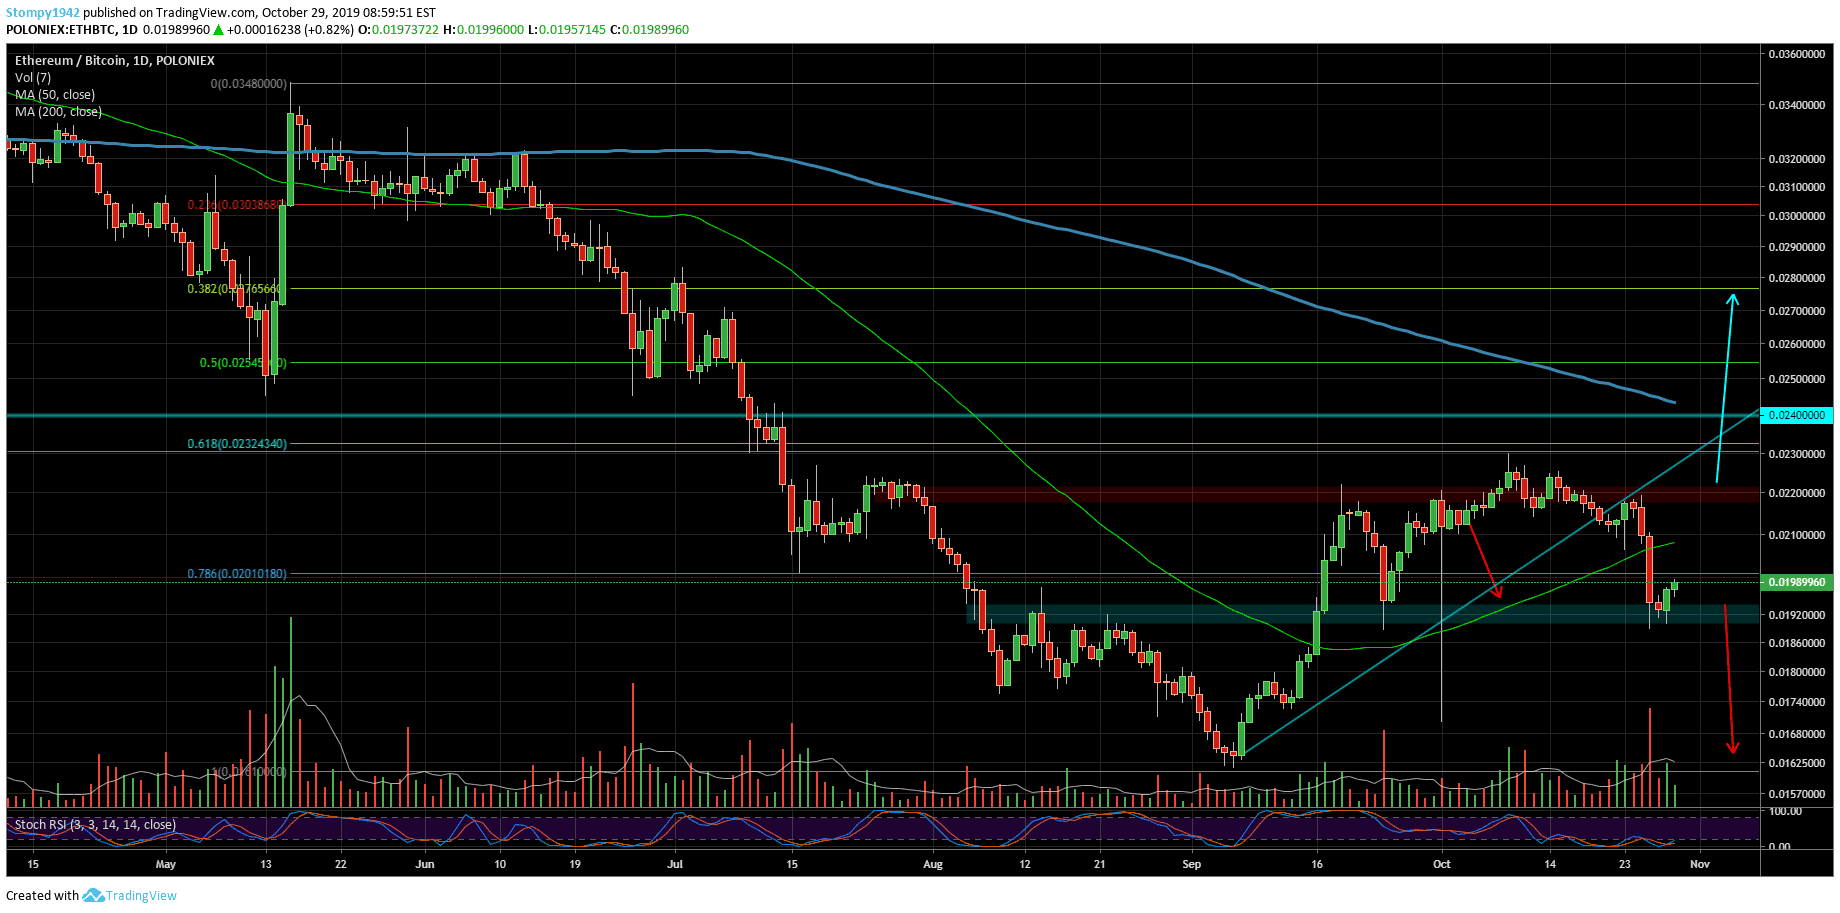
Against Bitcoin, the price is trading around the support where, last week, we saw the levels around 0.019BTC acting as a two-year support. The resistance in this range is at around 0.022BTC.
Against the USD, the trend was a bit lost around 30 cents. The volatility, however, is back, and the trend line is seen as resistance at 31 cents. Support hasn’t really been tested yet. It’s also important to consider the 26-cents correction where the support has already been tested twice.
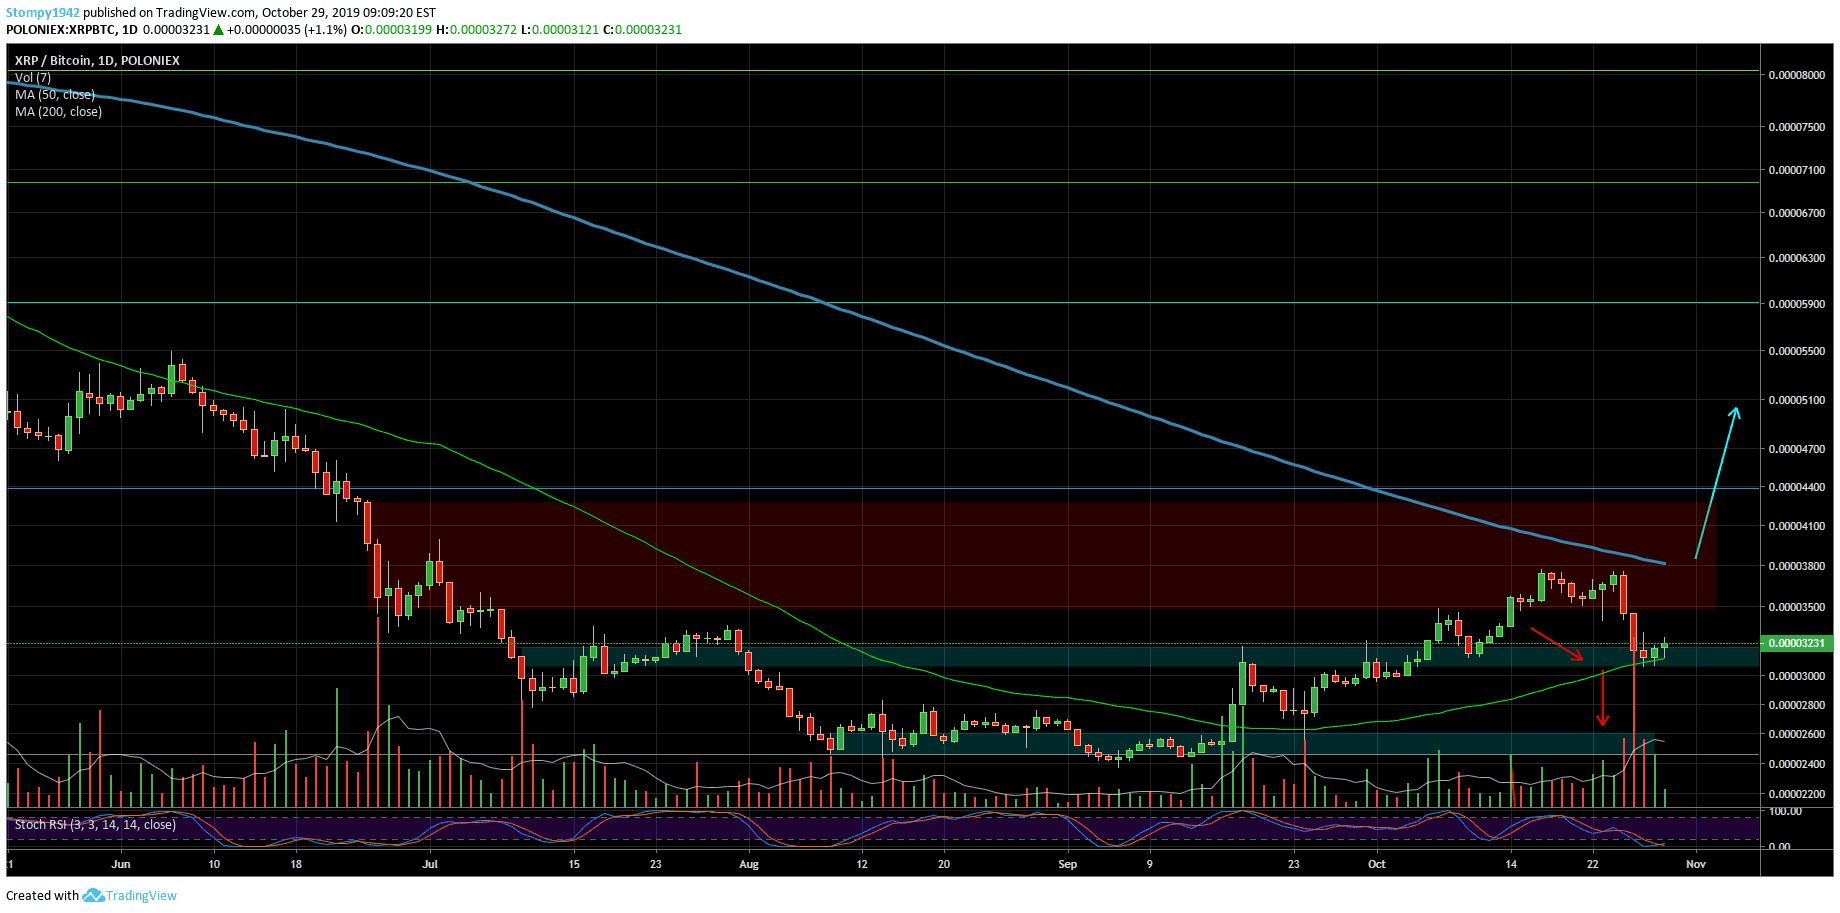
Against BTC, the support around 3200SAT on the 50MA is holding strong. Resistance is built around the 200MA at 3800SAT. Traders have room to experiment. Ripple was also affected by the sharp increase in Bitcoin’s price but it failed to return to the lower levels as it did before.
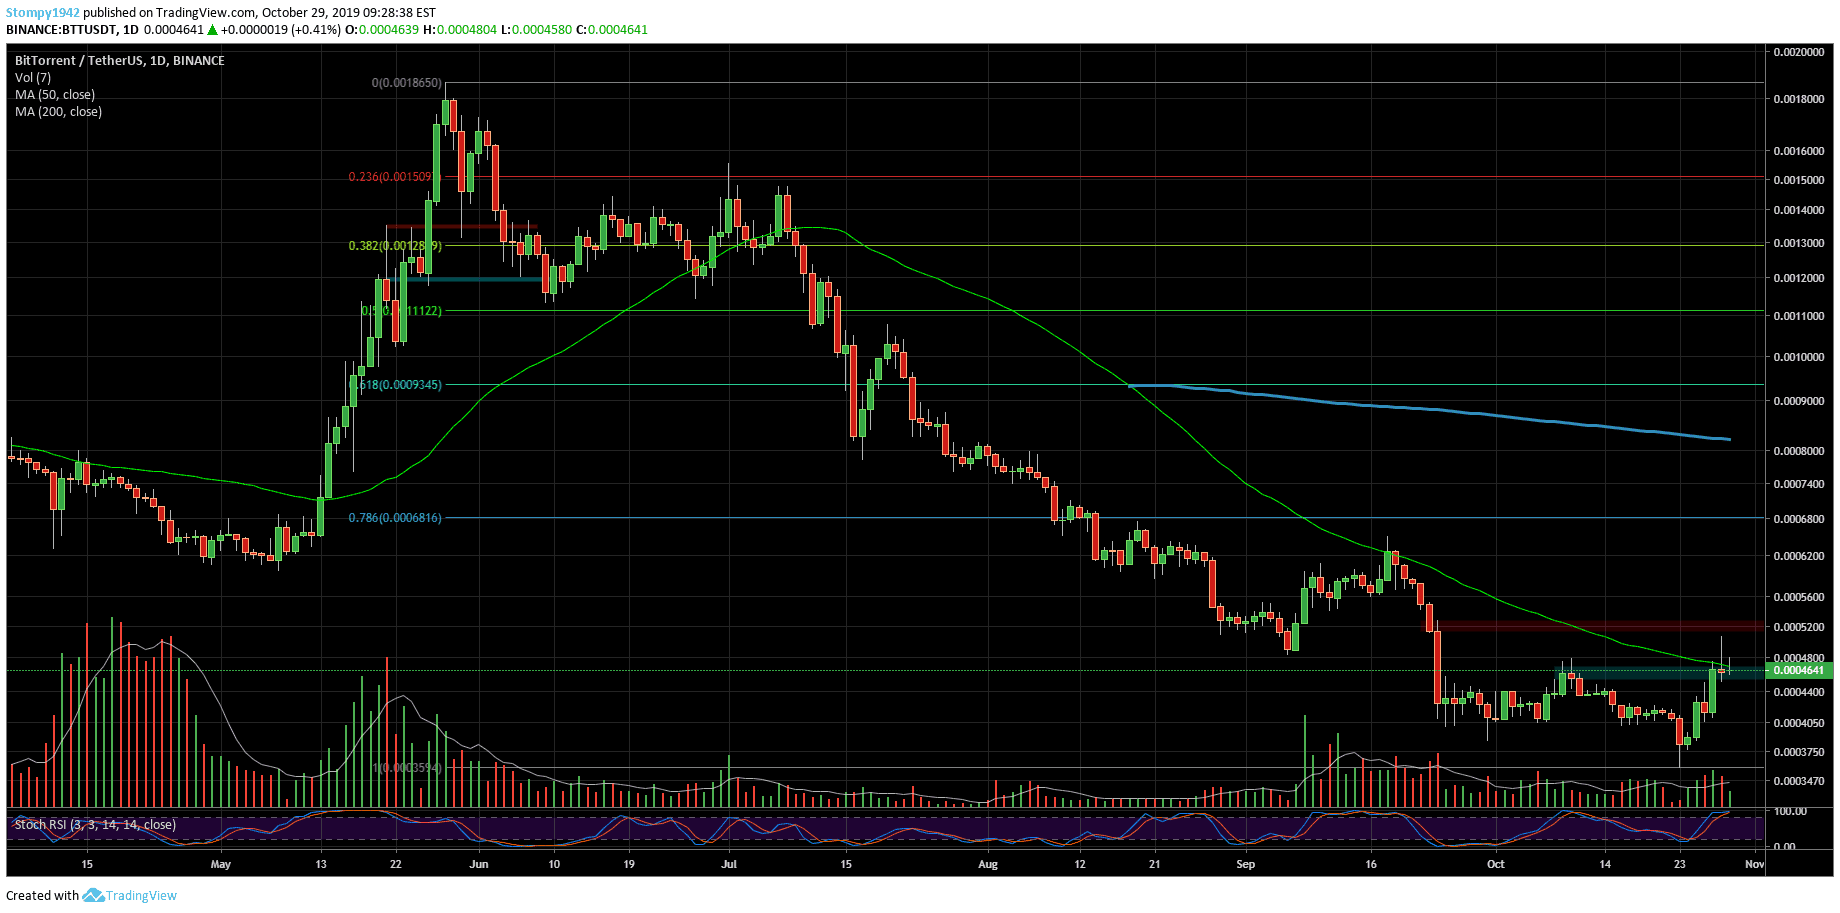
Against the USD, the price surged and broke the resistance at $0.00046 where the support currently is. Resistance is at $0.00052. Did we see the bottom?
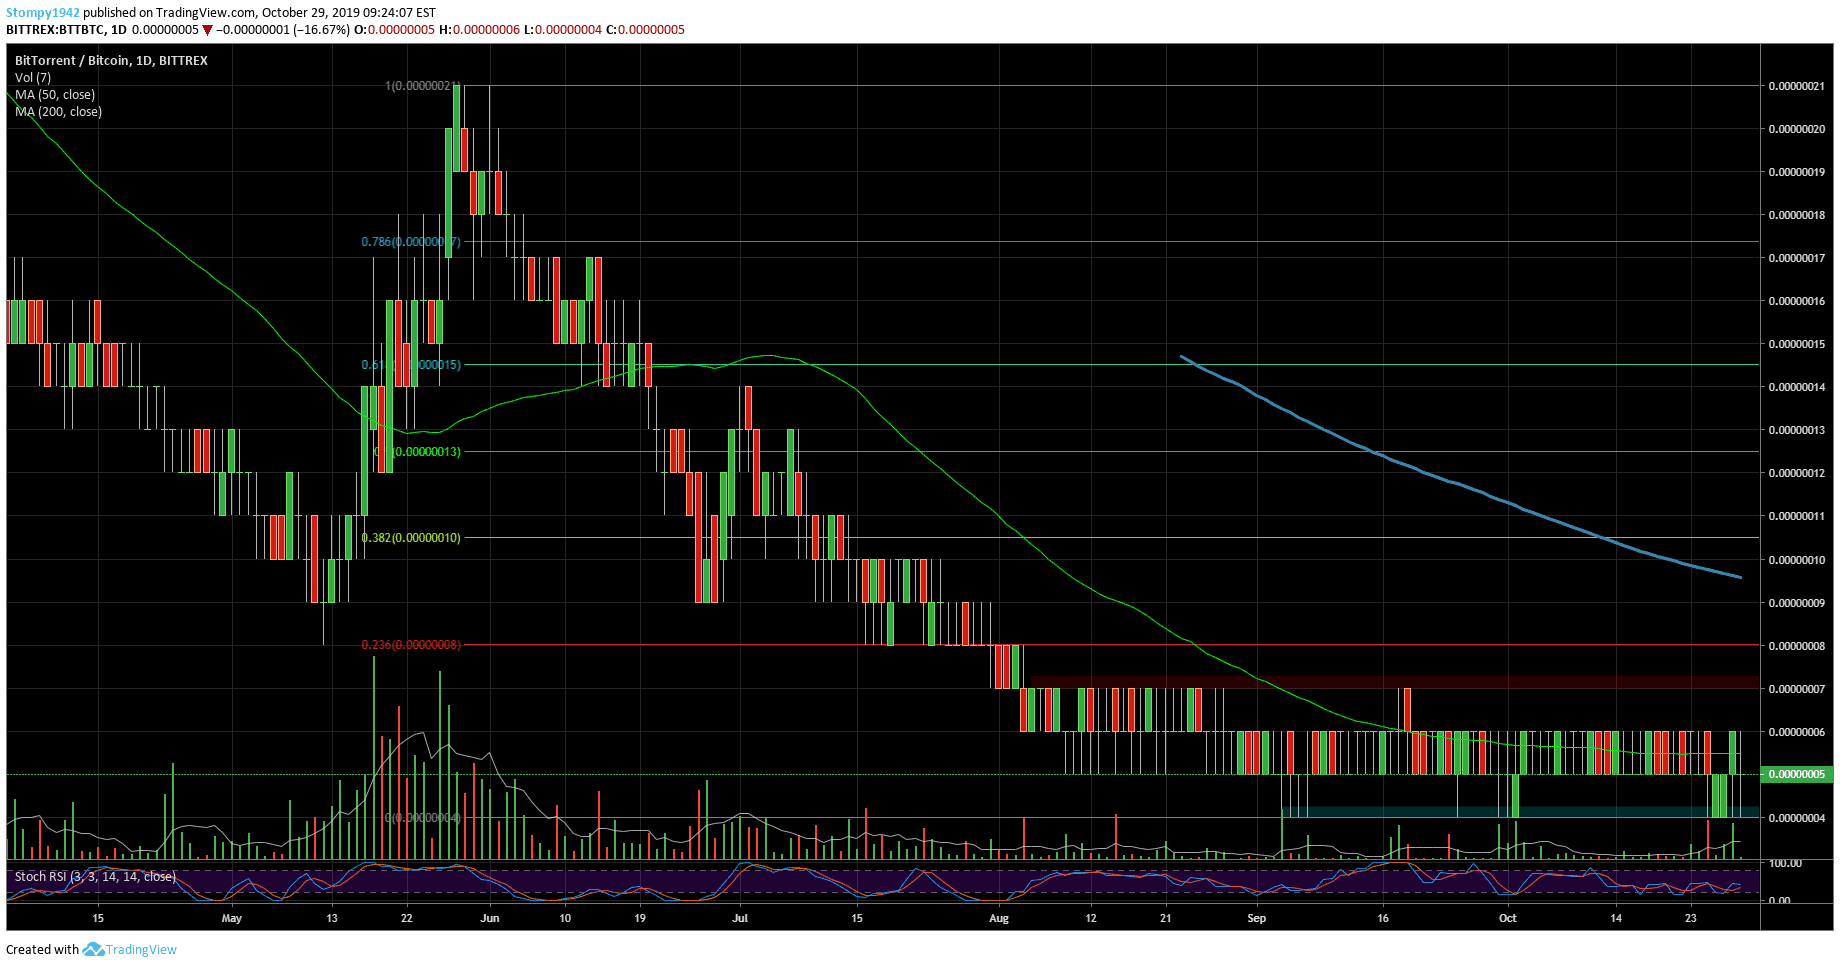
Against BTC, the price has been stable since August. The resistance is at 7SAT while support is at 4SAT. Volatility was down and the RSI was balancing. This would change if we see a breakthrough of one of the above levels. In the meantime, the price is stable.
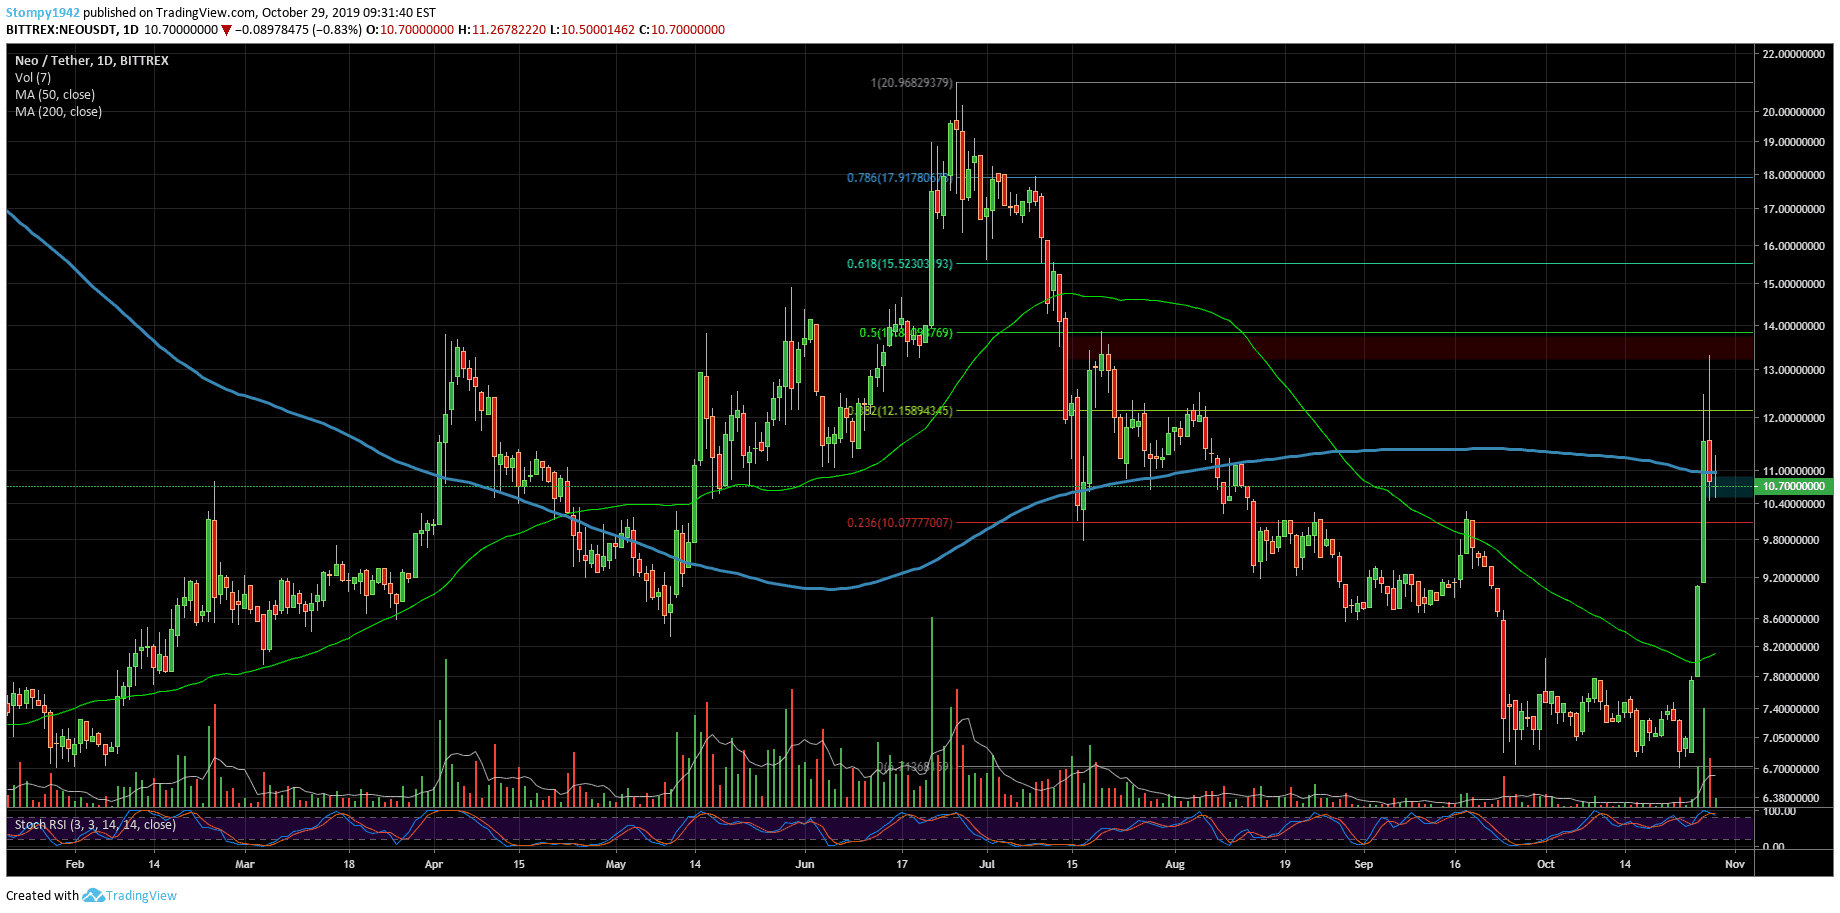
Against the USD, we saw a continual repair of a head and shoulders pattern after a short rally that saw the price reaching its peak at $20. However, the correction brought it back to $6.7. As China seems to have woken up, the price surged by more than 100% to reach $13.3 over the past week. It corrected like Bitcoin down to the 0.382 Fibonacci levels around $10, which is also the support. If it doesn’t hold, the next support is at $9.3. Resistance in this range is at $11 around the 200MA.
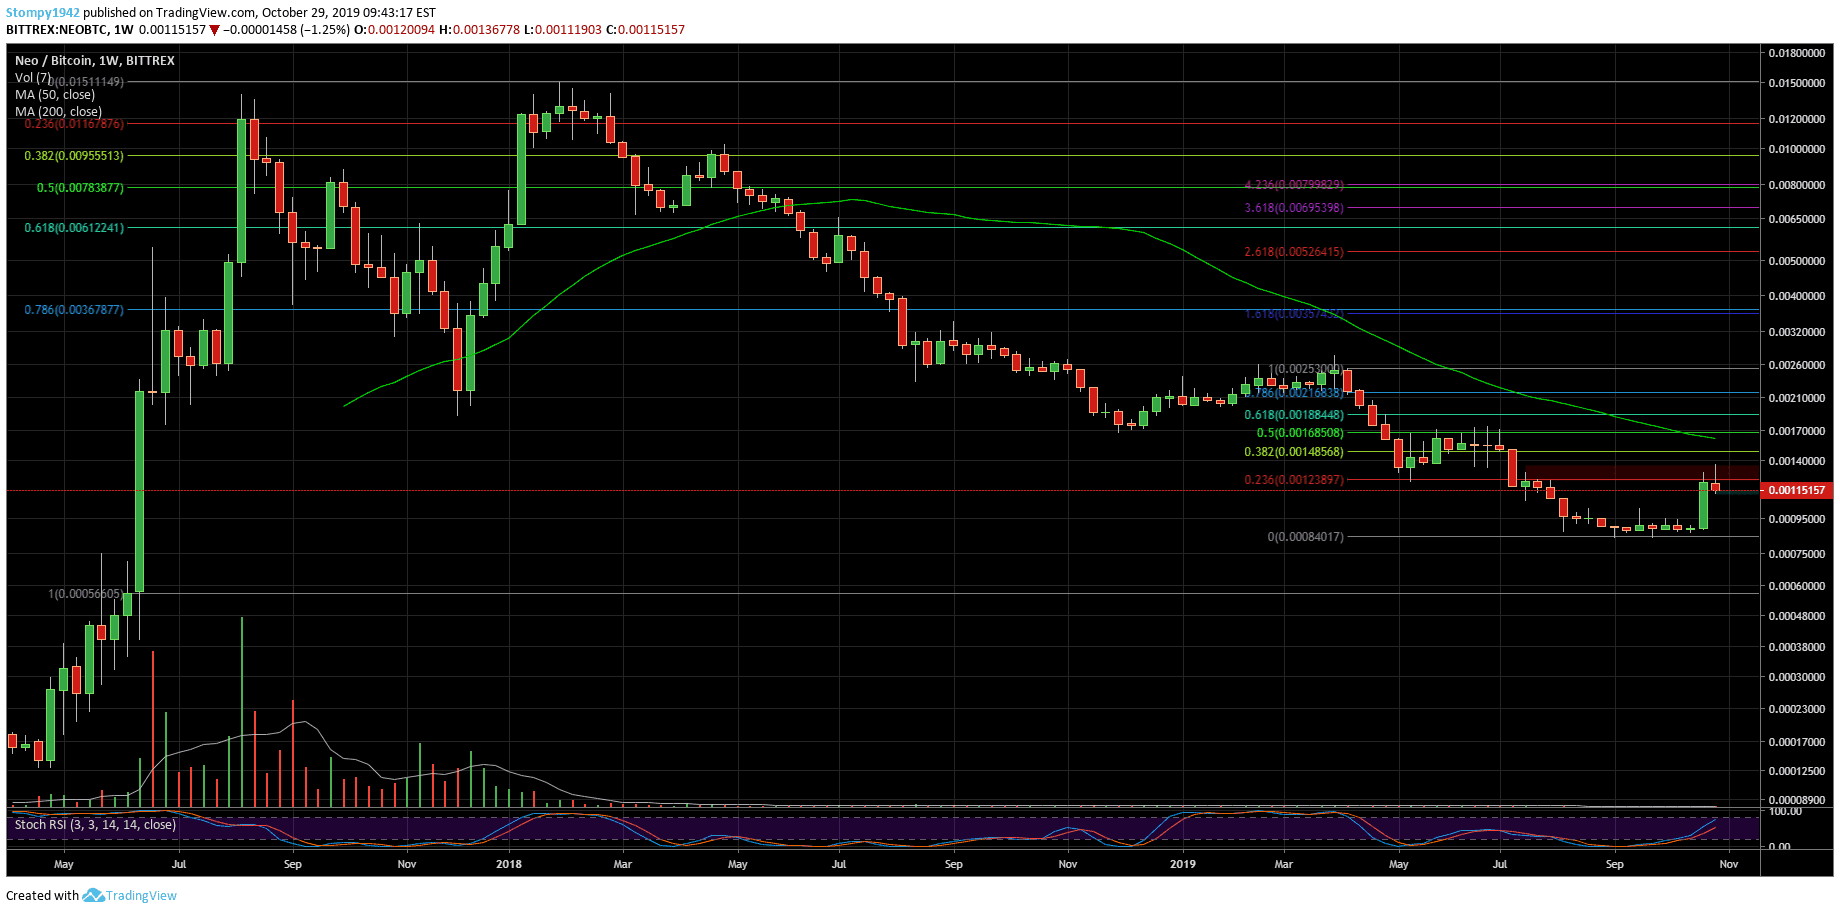
Against BTC, the weekly chart shows a double-tap pattern and an ongoing correction which is a pattern that’s designed to break up. The price climbed this week from 0.00088BTC to 0.00135BTC, which is also acting as resistance. Support is still being tested around the range of 0.0011BTC.