This week was very intense in terms of price action, and we take a look at Ethereum, Cardano, Polkadot, Solana, and Shiba Inu.
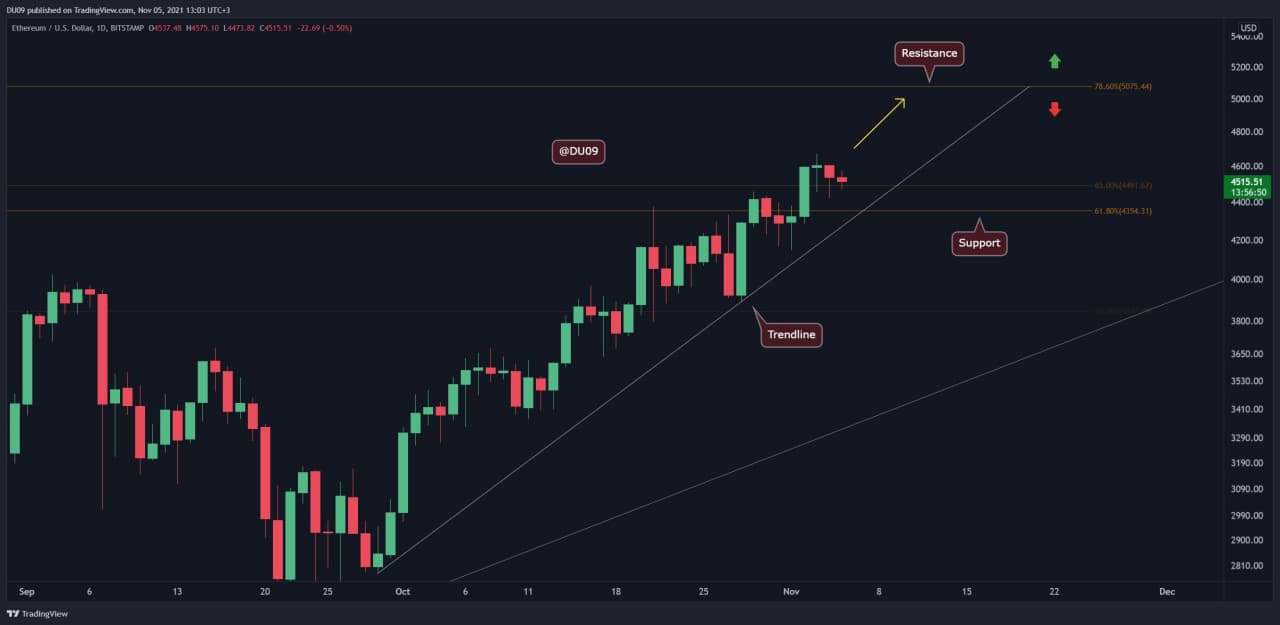
Ethereum has set a new all-time high this week at $4,670 and had another good performance where the price increased by 5.3%.
ETH is currently found on a clear uptrend towards the first key resistance at $5,075. The price level of $4,500 has acted as good support in the past three days and seems to hold well against sellers. However, there are some early signs that the bulls are getting weaker on this move higher since the MACD histogram and RSI on the daily timeframe have made lower highs while price pushed above. This is a bearish divergence, but it is too early to confirm it.
It may be confirmed if ETH breaks below the trendline that has held this uptrend so far. Considering the current momentum, this could take place sometime next week once ETH is faced with the resistance at $5,000.
Ethereum had a great start in November, and it’s possible for the price action to continue gaining momentum.
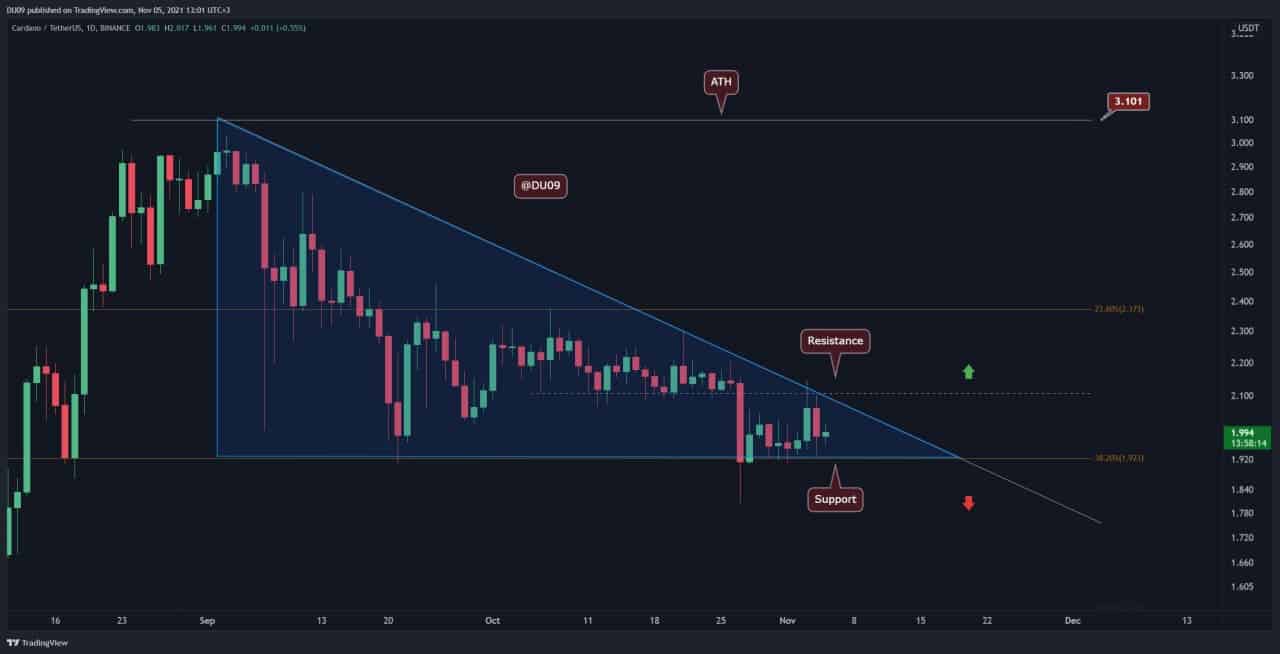
This week, Cardano saw a major attempt to break above the descending triangle but was swiftly rejected at the resistance at $2.1. The price was then pushed back to the support level just above $1.9.
In the next few days, ADA seems likely to continue to bounce between these two key levels before a resolution is reached. As such, ADA’s performance this week was weak, with almost no change in price compared to our last analysis.
Because of this price action, ADA’s indicators are looking rather flat on most timeframes. This is not an ideal situation for traders because profits are made in trending markets. When there is no trend in the market, trying to force one can lead to significant losses.
DOT had a fantastic week with a 24.8% price increase. This came due to a major breakout from the ascending triangle highlighted in blue. Dot quickly made past the previous resistance at $48 and continued up to reach the current resistance, which sits at $53
The indicators are on the bullish side and signal that there might be more to come from DOT before any significant correction. At the present time, DOT has to clear beyond the $53 resistance to expect further increases in price. A shallow pullback just under this level is also possible before bulls can gather enough strength to push higher again.
Looking ahead, DOT is one of the strongest altcoins in the market, with solid fundamentals that can propel prices to much higher levels. If DOT is successful in passing the current resistance, the next critical level will be found at $71.
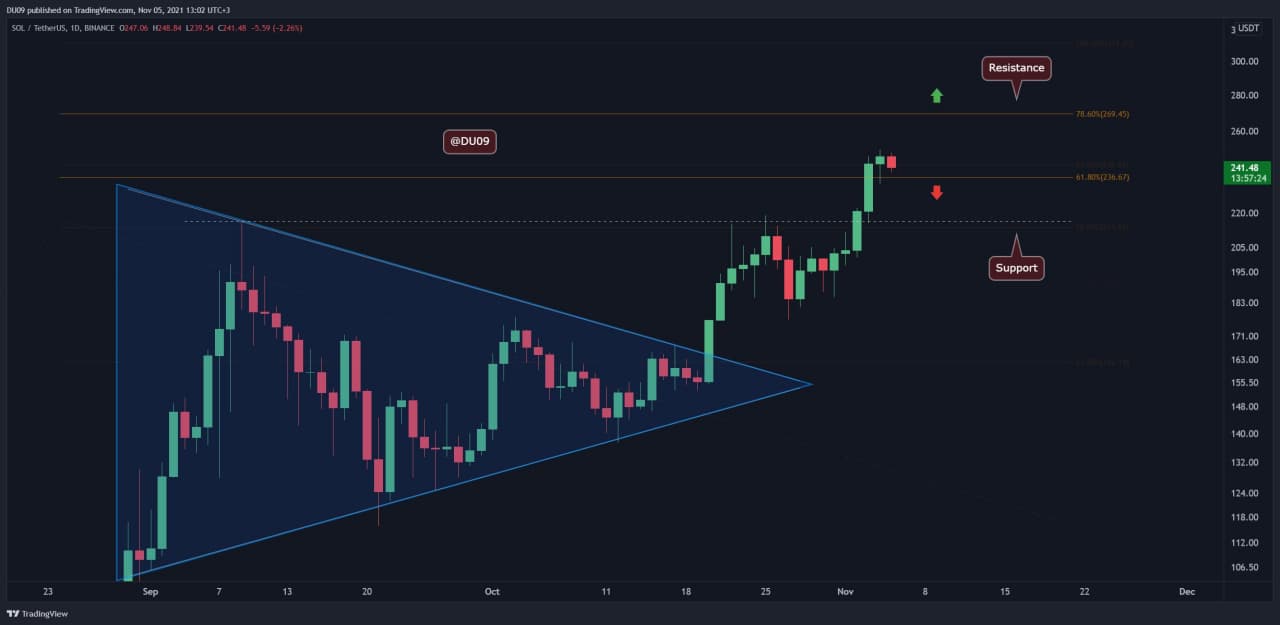
Like Ethereum, Solana broke another record this week, reaching a new all-time high at $250. This is a nice round number after a fantastic week where SOL saw a 23.2% price increase. This places the cryptocurrency as the fourth largest one in terms of market capitalization.
Solana has support at $236 and below that at the previous all-time high of $213. Therefore, any correction should find substance around these levels. If the price decides to continue higher, the most immediate resistance can be found at $269.
Looking ahead, Solana might be expected to continue higher. This is an exciting race and forces each blockchain to push innovation to the limit in the race to stay on top. This ultimately benefits the user.
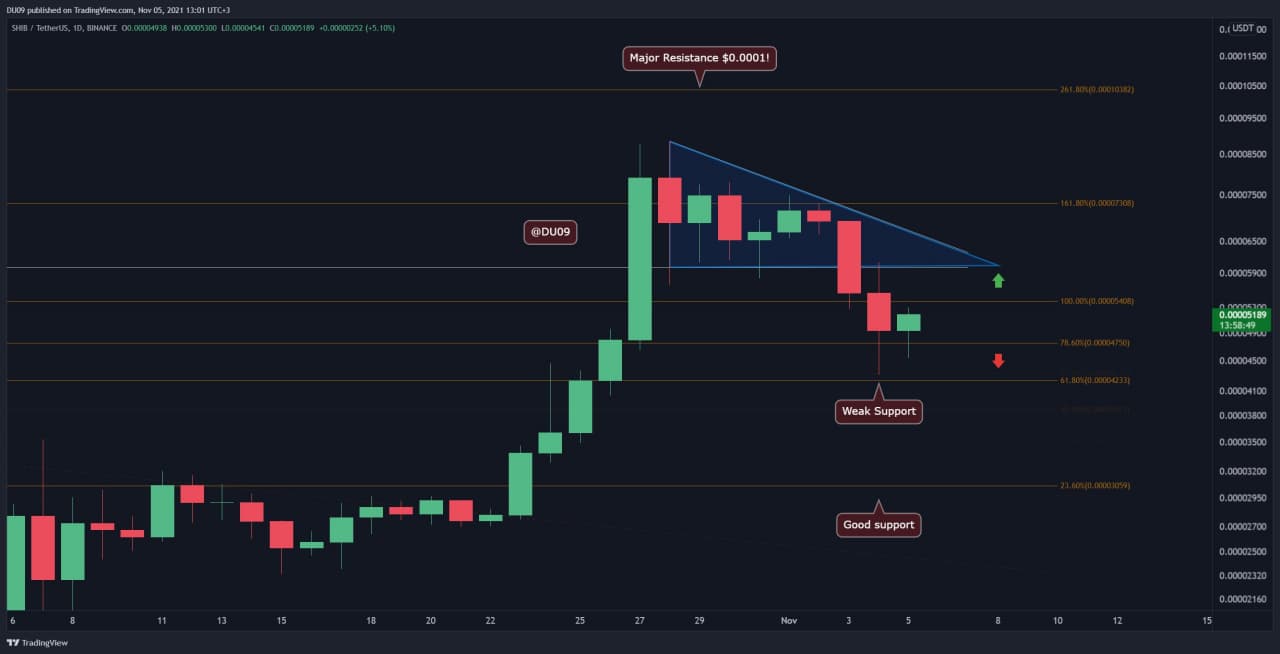
After the euphoria last week, we have entered the denial stage on SHIB. This is because in the past seven days, Shiba crashed by 24.3%. However, if we measure the drop from the all-time high at $0.00008854, which was also reached within the same weekly candlestick, this drop was over 50%. This signals Shiba has reached a local top, and it will take some time before a recovery can be expected.
The reason Shiba crashed so much is that it failed to push higher and was rejected at several key levels, which gave bears a lot of confidence to push the price lower. The cryptocurrency also broke below the descending triangle in blue and made the previous support resistance. After that, there was no way to stop the bears.
Right now, Shiba is bouncing from the support at $0.000047, but if this ends up being a dead cat bounce then lower levels can be expected still. The most reliable support level on Shiba right now appears all the way down at $0.000030 because the other levels have almost no price history to rely on. The bearish cross on the daily MACD is also concerning in the near future.