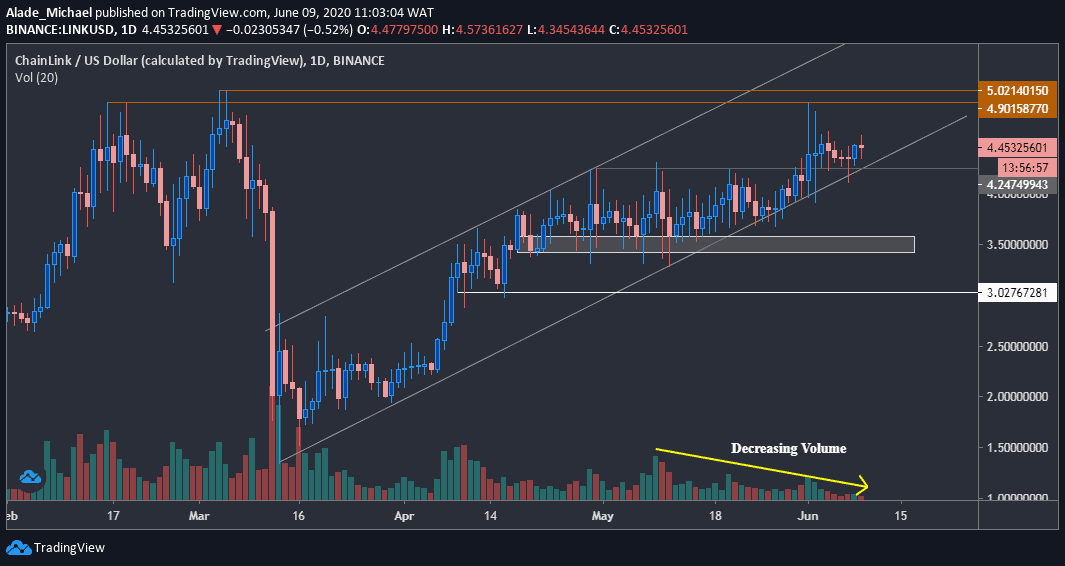
Key Resistance Levels: $4.9, $5, $5.5
Key Support Levels: $4.25, $3.5, $3
Chainlink failed to resume buying pressure since the price spiked to $4.9 on June 1, although the market structure is still looking bullish on a short-term perspective. Due to a low buying volume, the price has been consolidating around $4.5 over the past seven days.
Looking at the price action, Link is trying to hold above the $4 price level since the monthly opening and, at the same time, respecting the channel that is shaping since March. A strong bearish action may come into play if the price drops off this channel.
It is likely to face the monthly resistance at $4.9 – $5 levels if buyers try to show commitment again. But despite the latest indecisive actions, the price is still up by 2.1% over the last 24 hours.
The price is still in favor of the bull, even though their presence appears weak at the moment. If the buyers regroup and manage to surpass this crucial resistance around $4.9 (marked orange), it may print a fresh yearly high around $5.5 or even $6.
Apart from holding the channel’s support, Link is sitting well on $4.25 for a while now. As mentioned above, the price may crash straight into the grey demand area of $3.5 if a channel break down occurs. Support below this area lies at $3 in case of a further dip.
Considering the current decreasing volume on the daily chart, a strong correction could be around the corner for the 14th largest cryptocurrency by market cap.
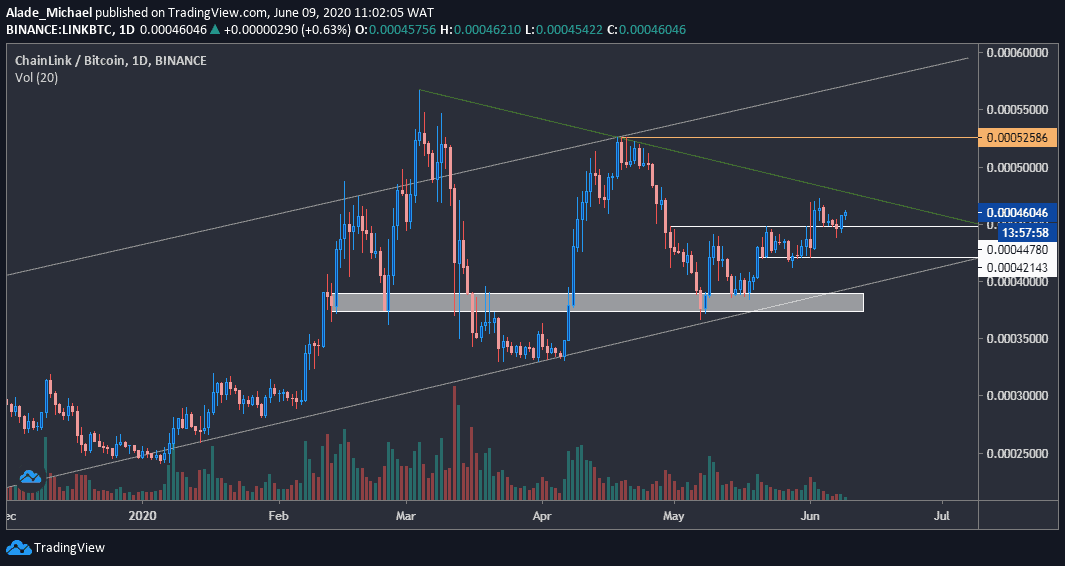
Key Resistance Levels: 47267 SAT, 52500 SAT, 56000 SAT
Key Support Levels: 44780 SAT, 42143 SAT, 37566 SAT
Over the past weeks, Chainlink was facing strong resistance at 45000 SAT level after rebounding from a key demand zone of 37000 SAT in May, around the channel’s support forming since late 2019.
During last week’s trading, this resistance finally got breached with a full body candle that wicked at 47267 SAT level before pulling back to where it currently found weekly support around this same 45000 SAT level. It was followed by a 2.36% increase overnight to reach 46050 SAT at the time of writing.
It is currently looking bullish on the daily chart, but it would need to surpass another important resistance line (marked green) before validating a strong bullish trend.
Link may currently be preparing for another leg up. Once the price crosses above this green trend line, especially above the last week’s high of 47267 SAT, the next target would be the 52000 SAT marked in orange.
The next above, this would be around the channel’s resistance at 56000 SAT, where the price started to fall on March 4.
Chainlink is currently supported by 44780 SAT, followed by last week’s support of 42143 SAT level – marked white on the price chart. There’s a strong demand zone at 37566 SAT if these support levels fail to hold.