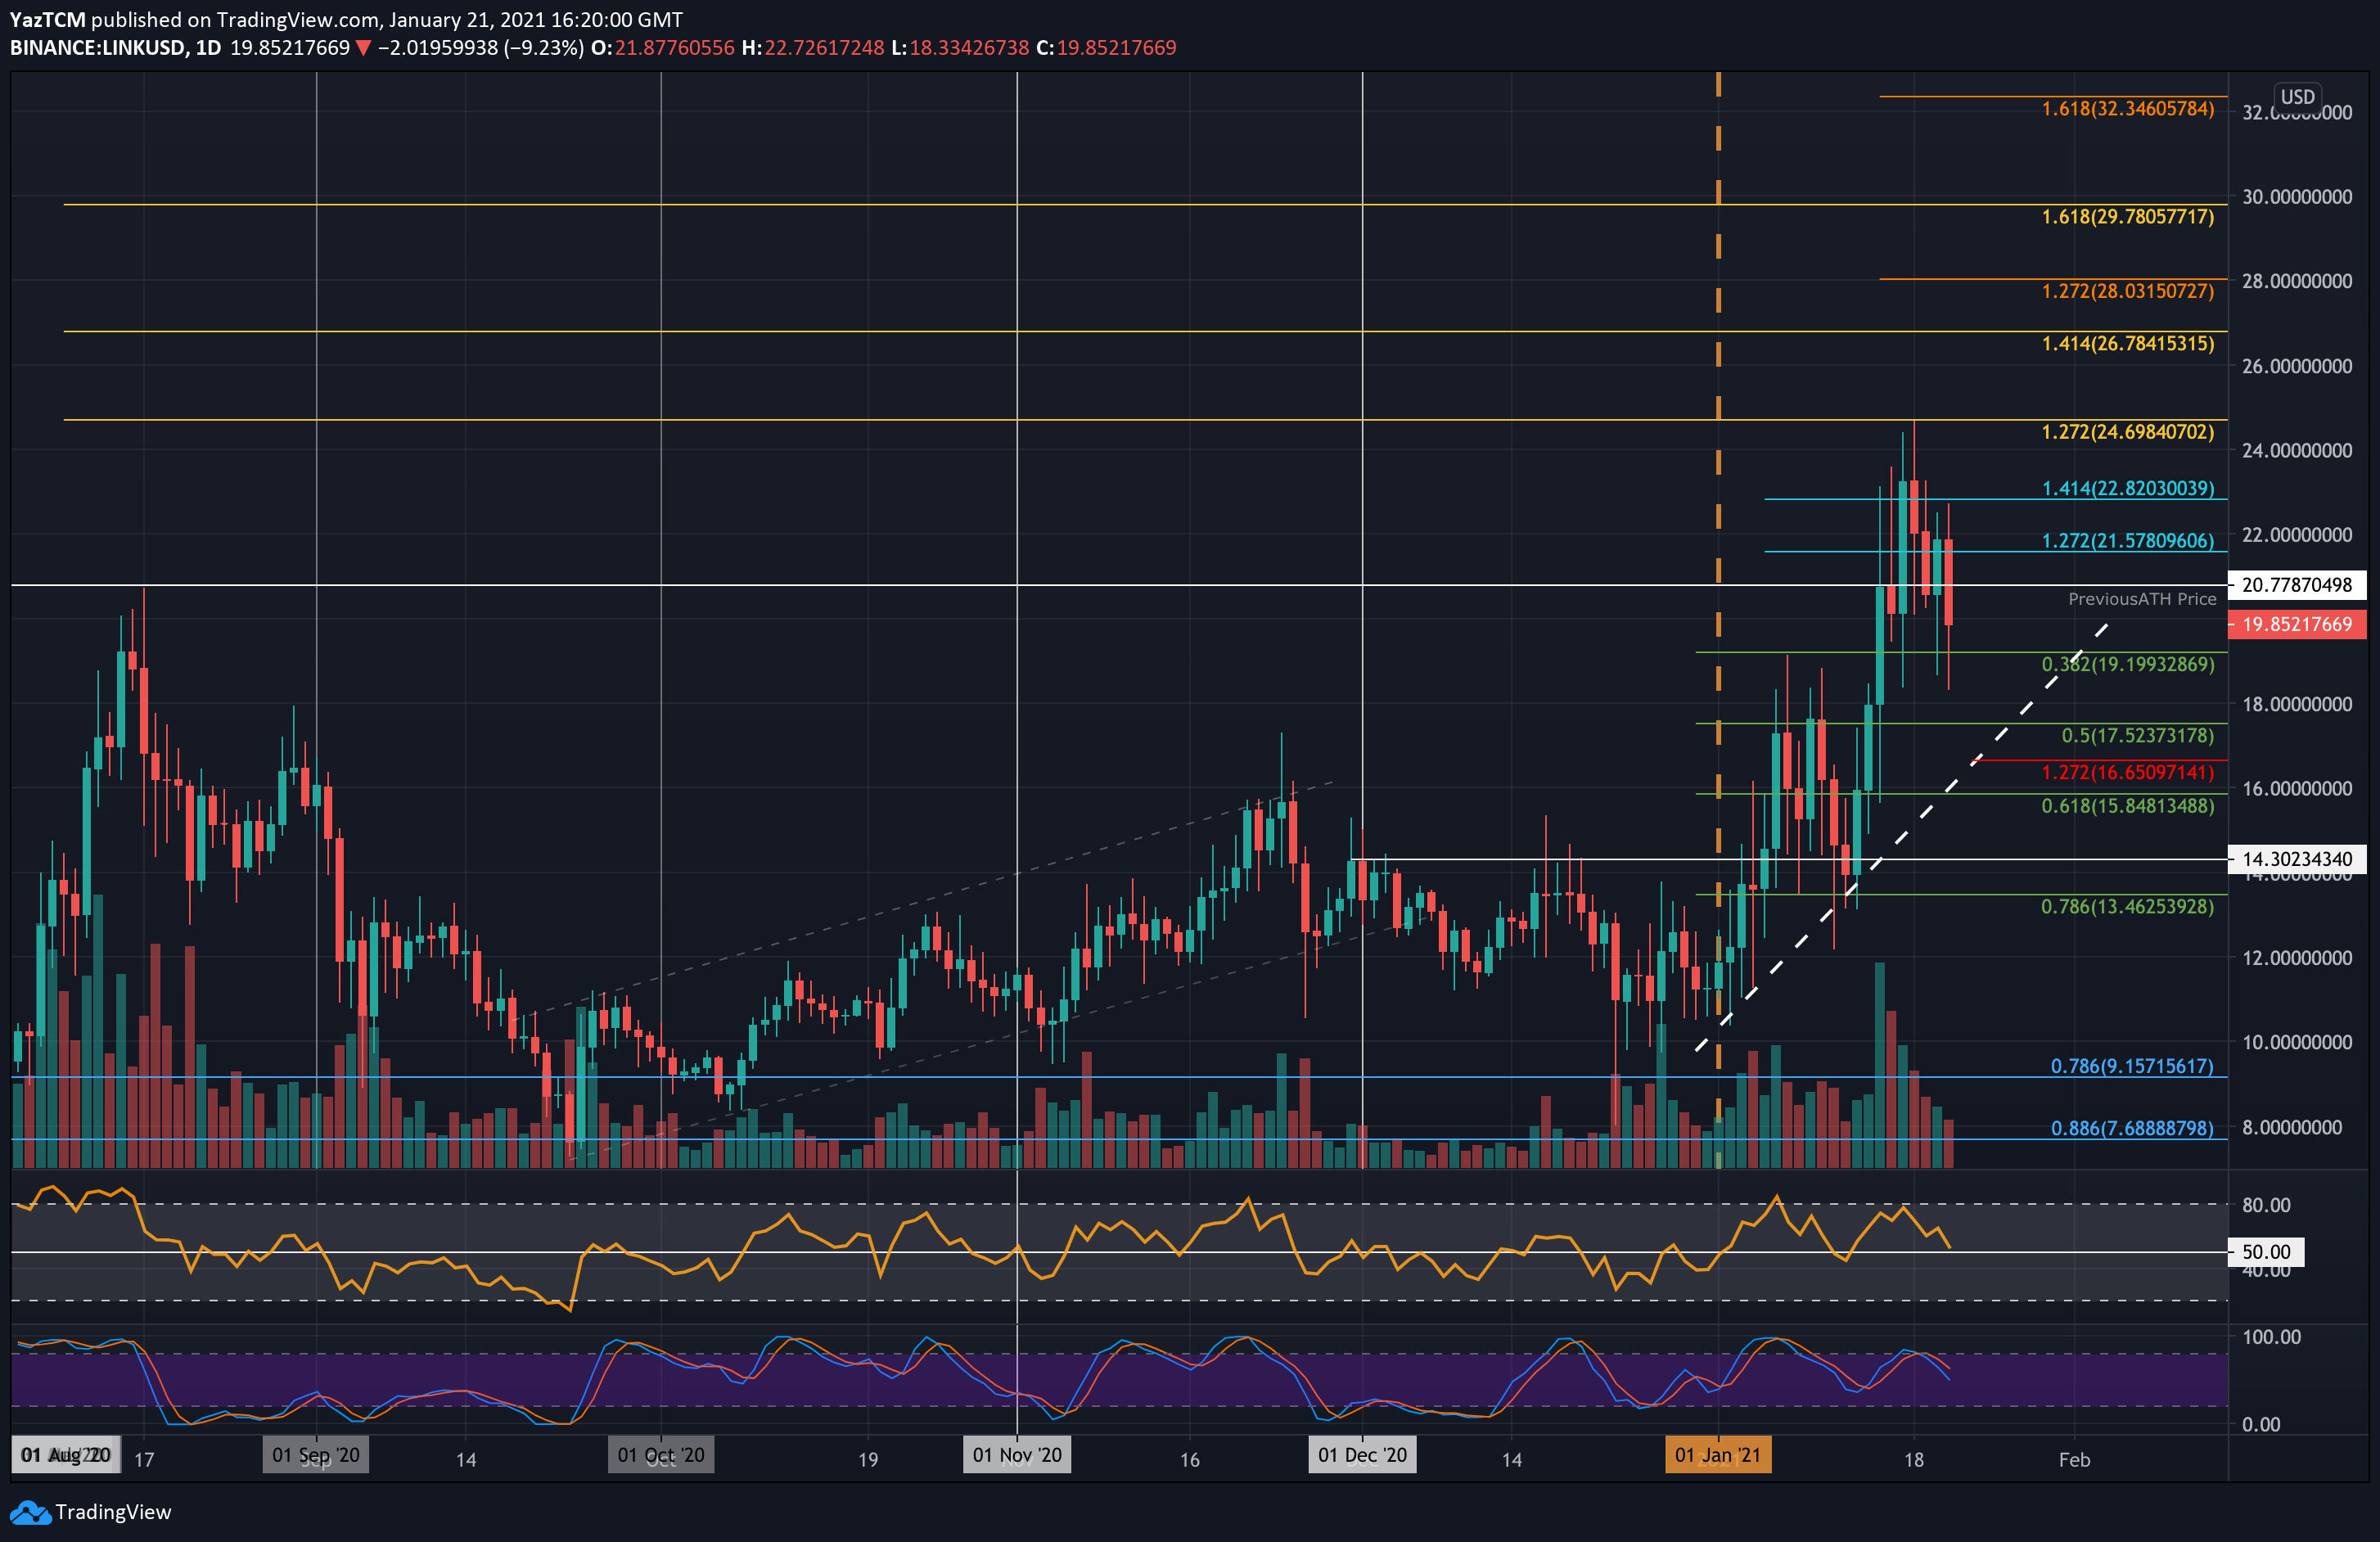
LINK/USD Daily Chart. Source: TradingView
Key Support Levels: $19.20, $18, $17.52.
Key Resistance Levels: $20.77, $21.57, $22.82.
Despite dropping 20% over the past four days, LINK is still up by a strong 25.6% this week. It had surged higher to break the previous ATH price and set a new one at $24.70.
There, it ran into resistance at a 1.272 Fib Extension ad started to head lower. Today, it dropped by a steep 10% as it fell from above $22 to reach the current $19.85 level. Nevertheless, LINK is still above support at $19.20, provided by a .382 Fib Retracement.
Looking ahead, if the sellers continue lower, the first level of support lies at $19.20 (.382 Fib). This is followed by $18, $17.52 (.5 Fib), $16.65 (downside 1.272 Fib Extension), and $15.85 (.618 Fib).
On the other side, the first level of resistance lies at the previous ATH, around $20.77. This is followed by $21.57 (short term 1.272 Fib Extension), $22.82 (short term 1.414 Fib Extension), and $24.70 (ATH). Beyond the ATH, targets lie at $26, $26.78, and $28.
The RSI has dropped back into the midline, indicated indecision within the market. If it dips beneath the midline, LINK can be expected to head beneath $18.
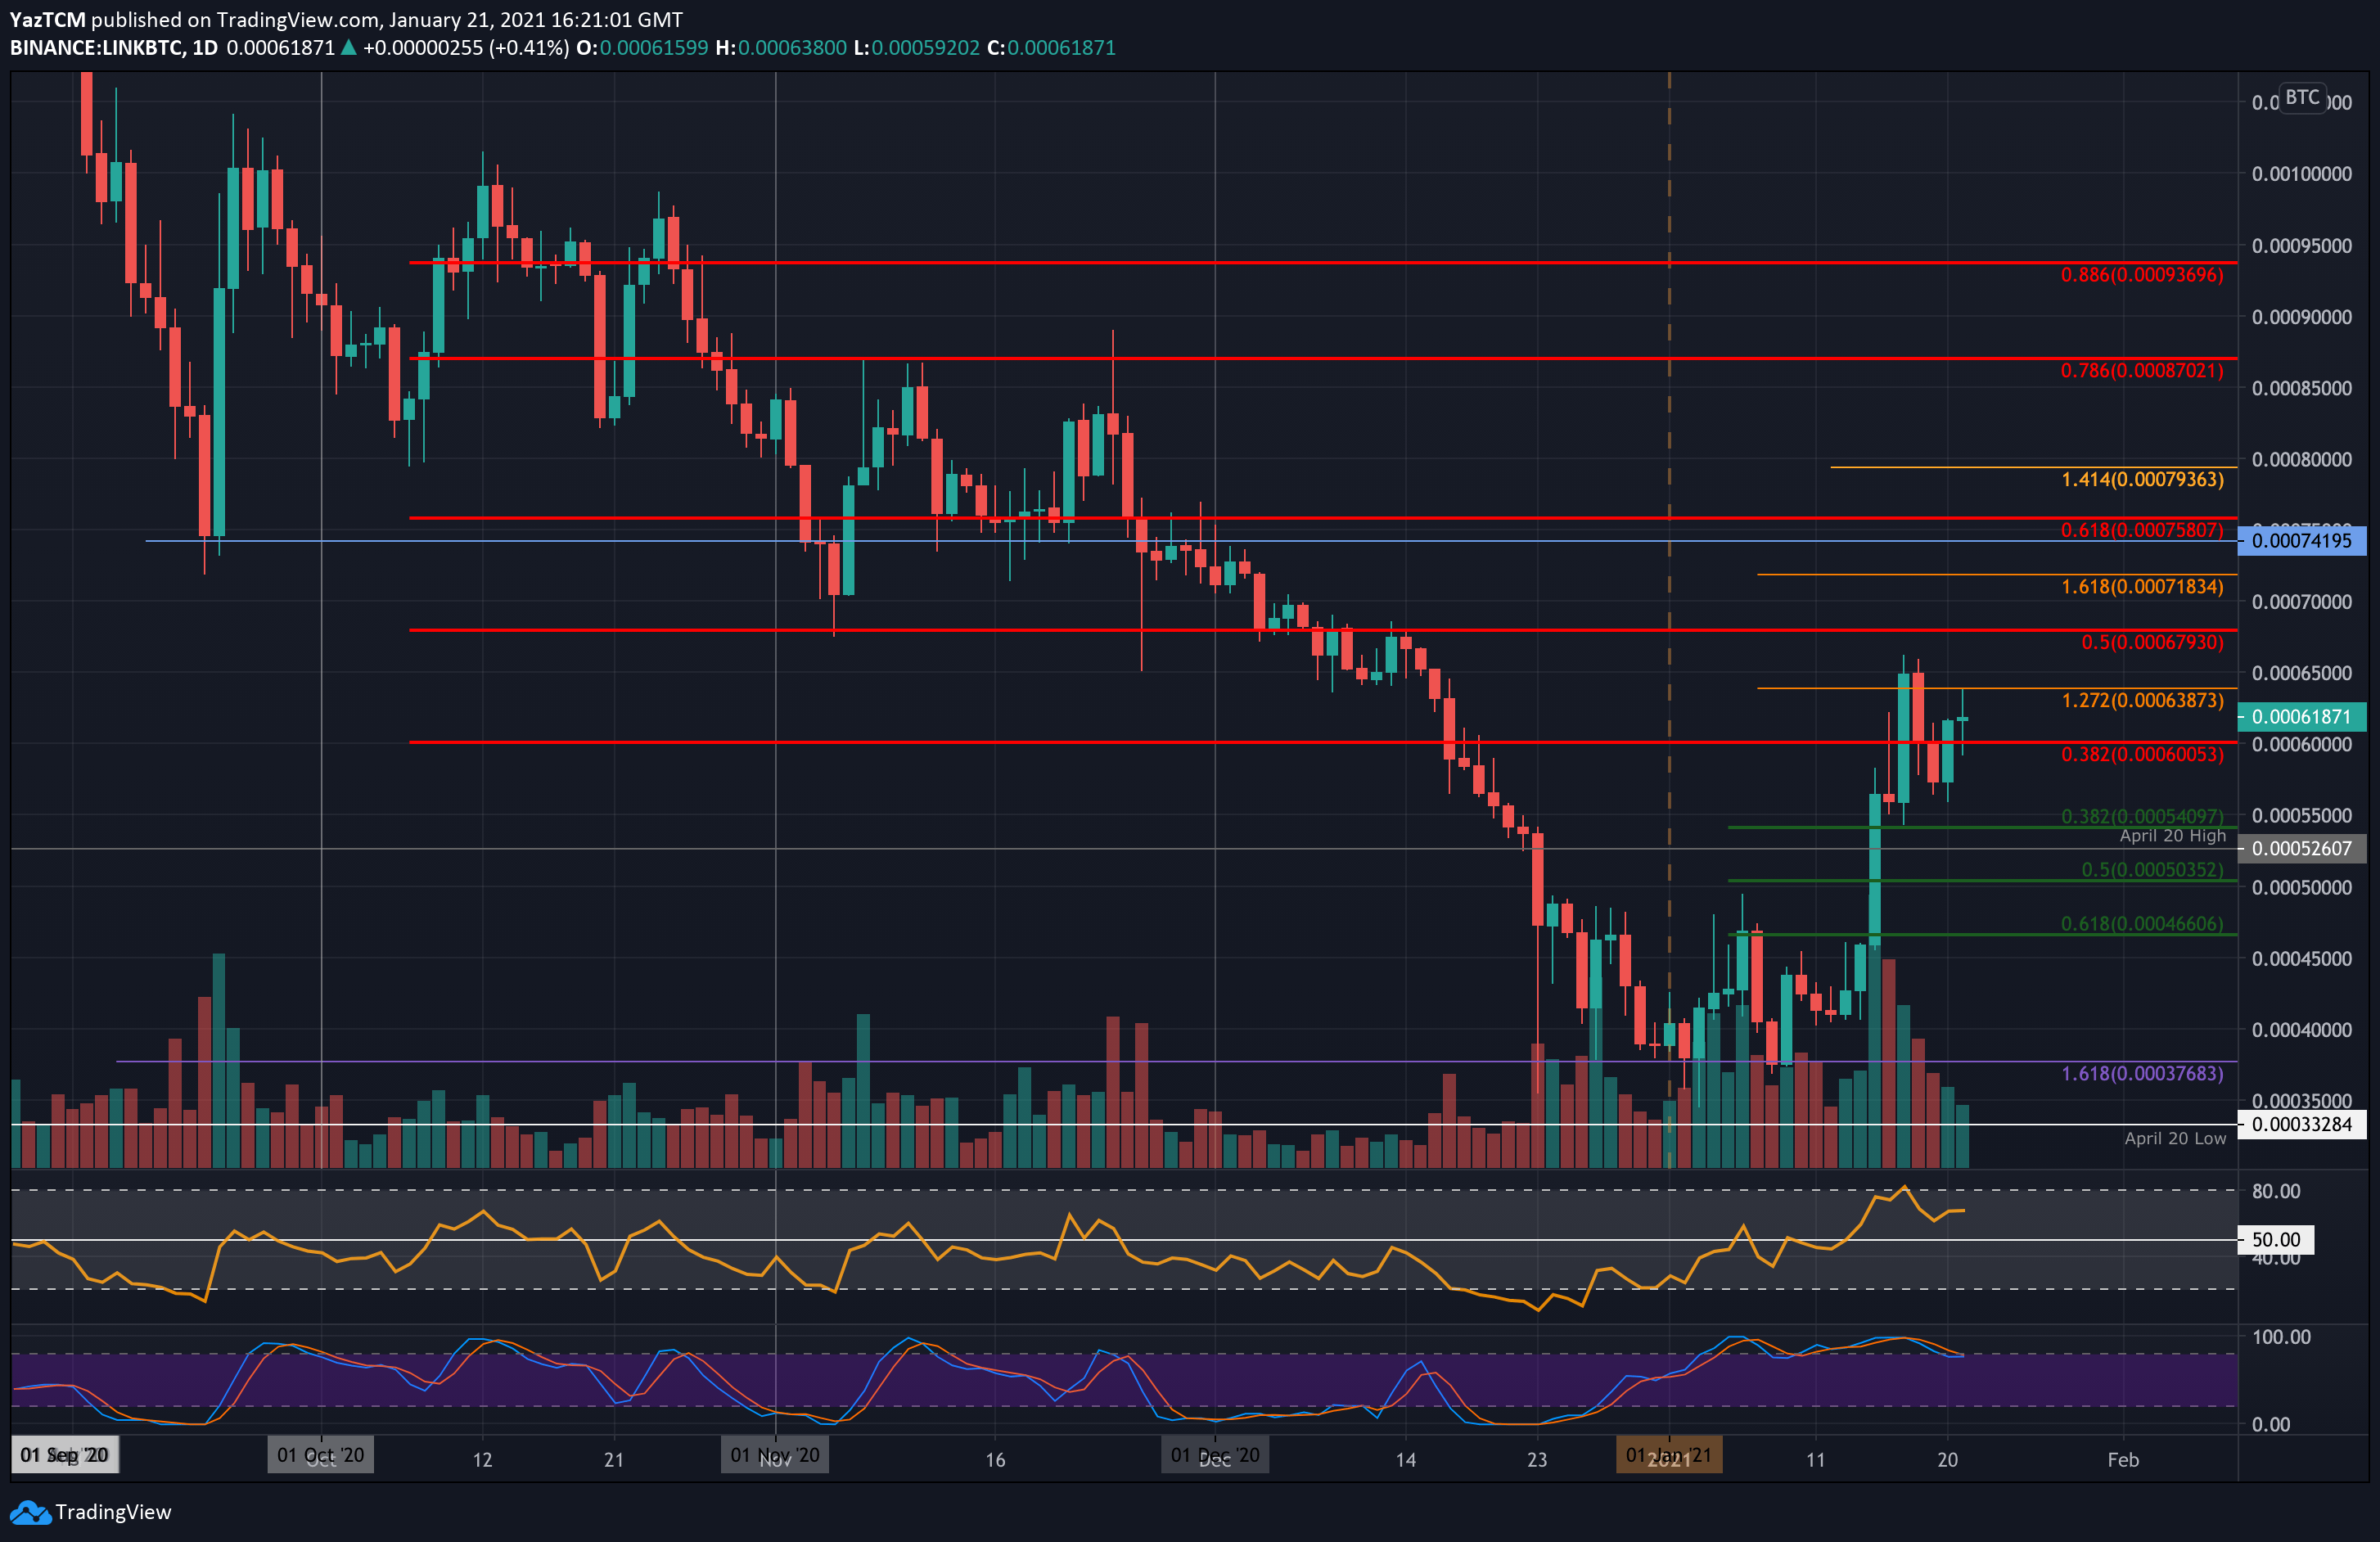
Key Support Levels: 0.0006 BTc, 0.00055 BTC, 0.000526 BTC.
Key Resistance Levels: 0.00065 BTC, 0.000679 BTC, 0.0007 BTC.
Against Bitcoin, LINK also surged higher last week to meet resistance at 0.00065 BTC on Sunday. From there, it dropped lower but found support around 0.00057 BTC.
Today, it dropped to 0.000618 BTC.
Moving forward, the first level of resistance lies at 0.00065 BTC. This is followed by resistance at 0.000679 BTC (bearish .5 Fib), 0.0007 BTC, and 0.000758 BTC (bearish .618 Fib & December 2020 Highs).
On the other side, the first support lies at 0.0006 BTC. This is followed by support at 0.00055 BTC (.382 Fib), 0.000526 BTC (April 20 Highs), and 0.0005 BTC (.5 Fib).
The RSI is still in the bullish territory as they control the market momentum. However, the Stochastic RSI is shaping up for a bearish crossover signal.