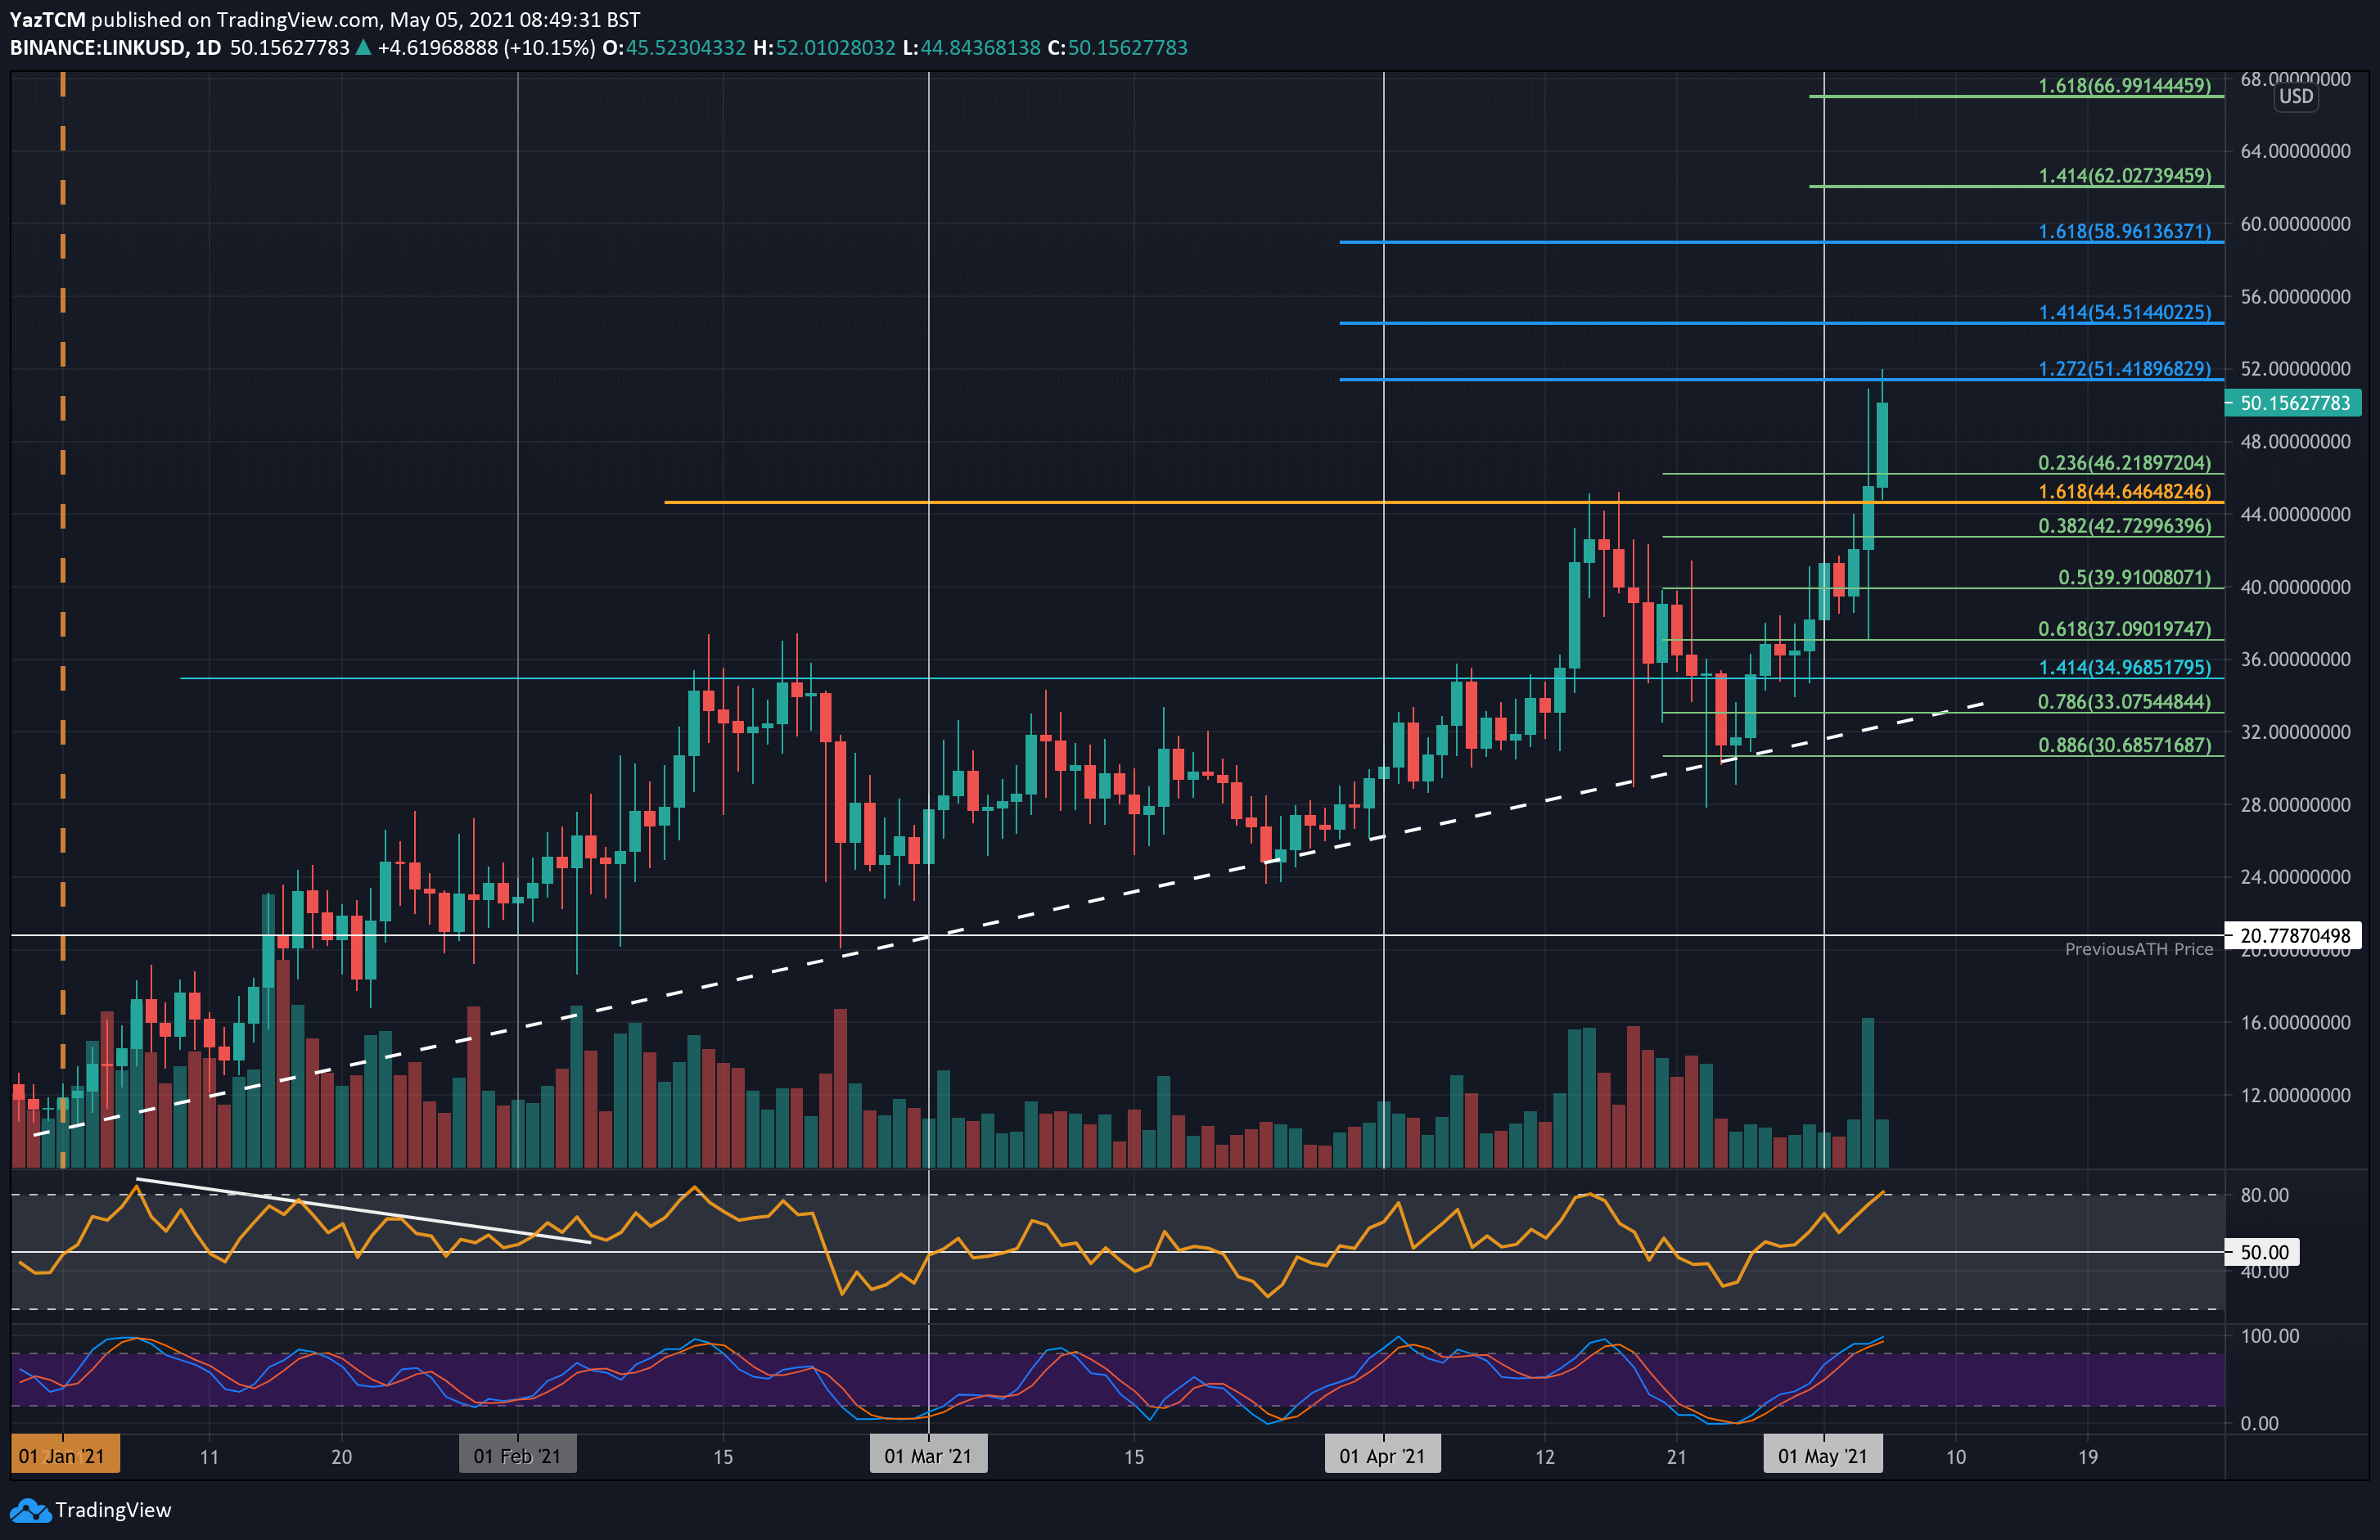
LINK/USD Daily Chart. Source: TradingView
Key Support Levels: $50, $56.21, $52.73.
Key Resistance Levels: $52, $54.50, $56.
LINK surged by a total of 25.5% today, finally managing to break above $50 and set a new ATH at $52. The coin topped out at around $45 in April but could not push beyond that. From there, it started to head lower until support was found around $30.70 toward the end of the month.
A 4-month-old rising trend line provided the support, and it allowed LINK to rebound. Since then, LINK managed to break the $45 resistance yesterday. Today, it continued further above $50 and set the new ATH at $52.
Looking ahead, If the bulls continue to push above $52, the first resistance lies at $54.50 (1.414 Fib Extension). This is followed by $56, $60 (1.618 Fib Extension), , and $62 (1.414 Fib Extension – green).
On the other side, the first support beneath $50 lies at $56.21 (.236 Fib). This is followed by $52.73 (.382 Fib), $40 (.5 Fib), and $37.10 (.618 Fib).
The RSI is well within the bull’s favor and is currently the highest it has been all year long.
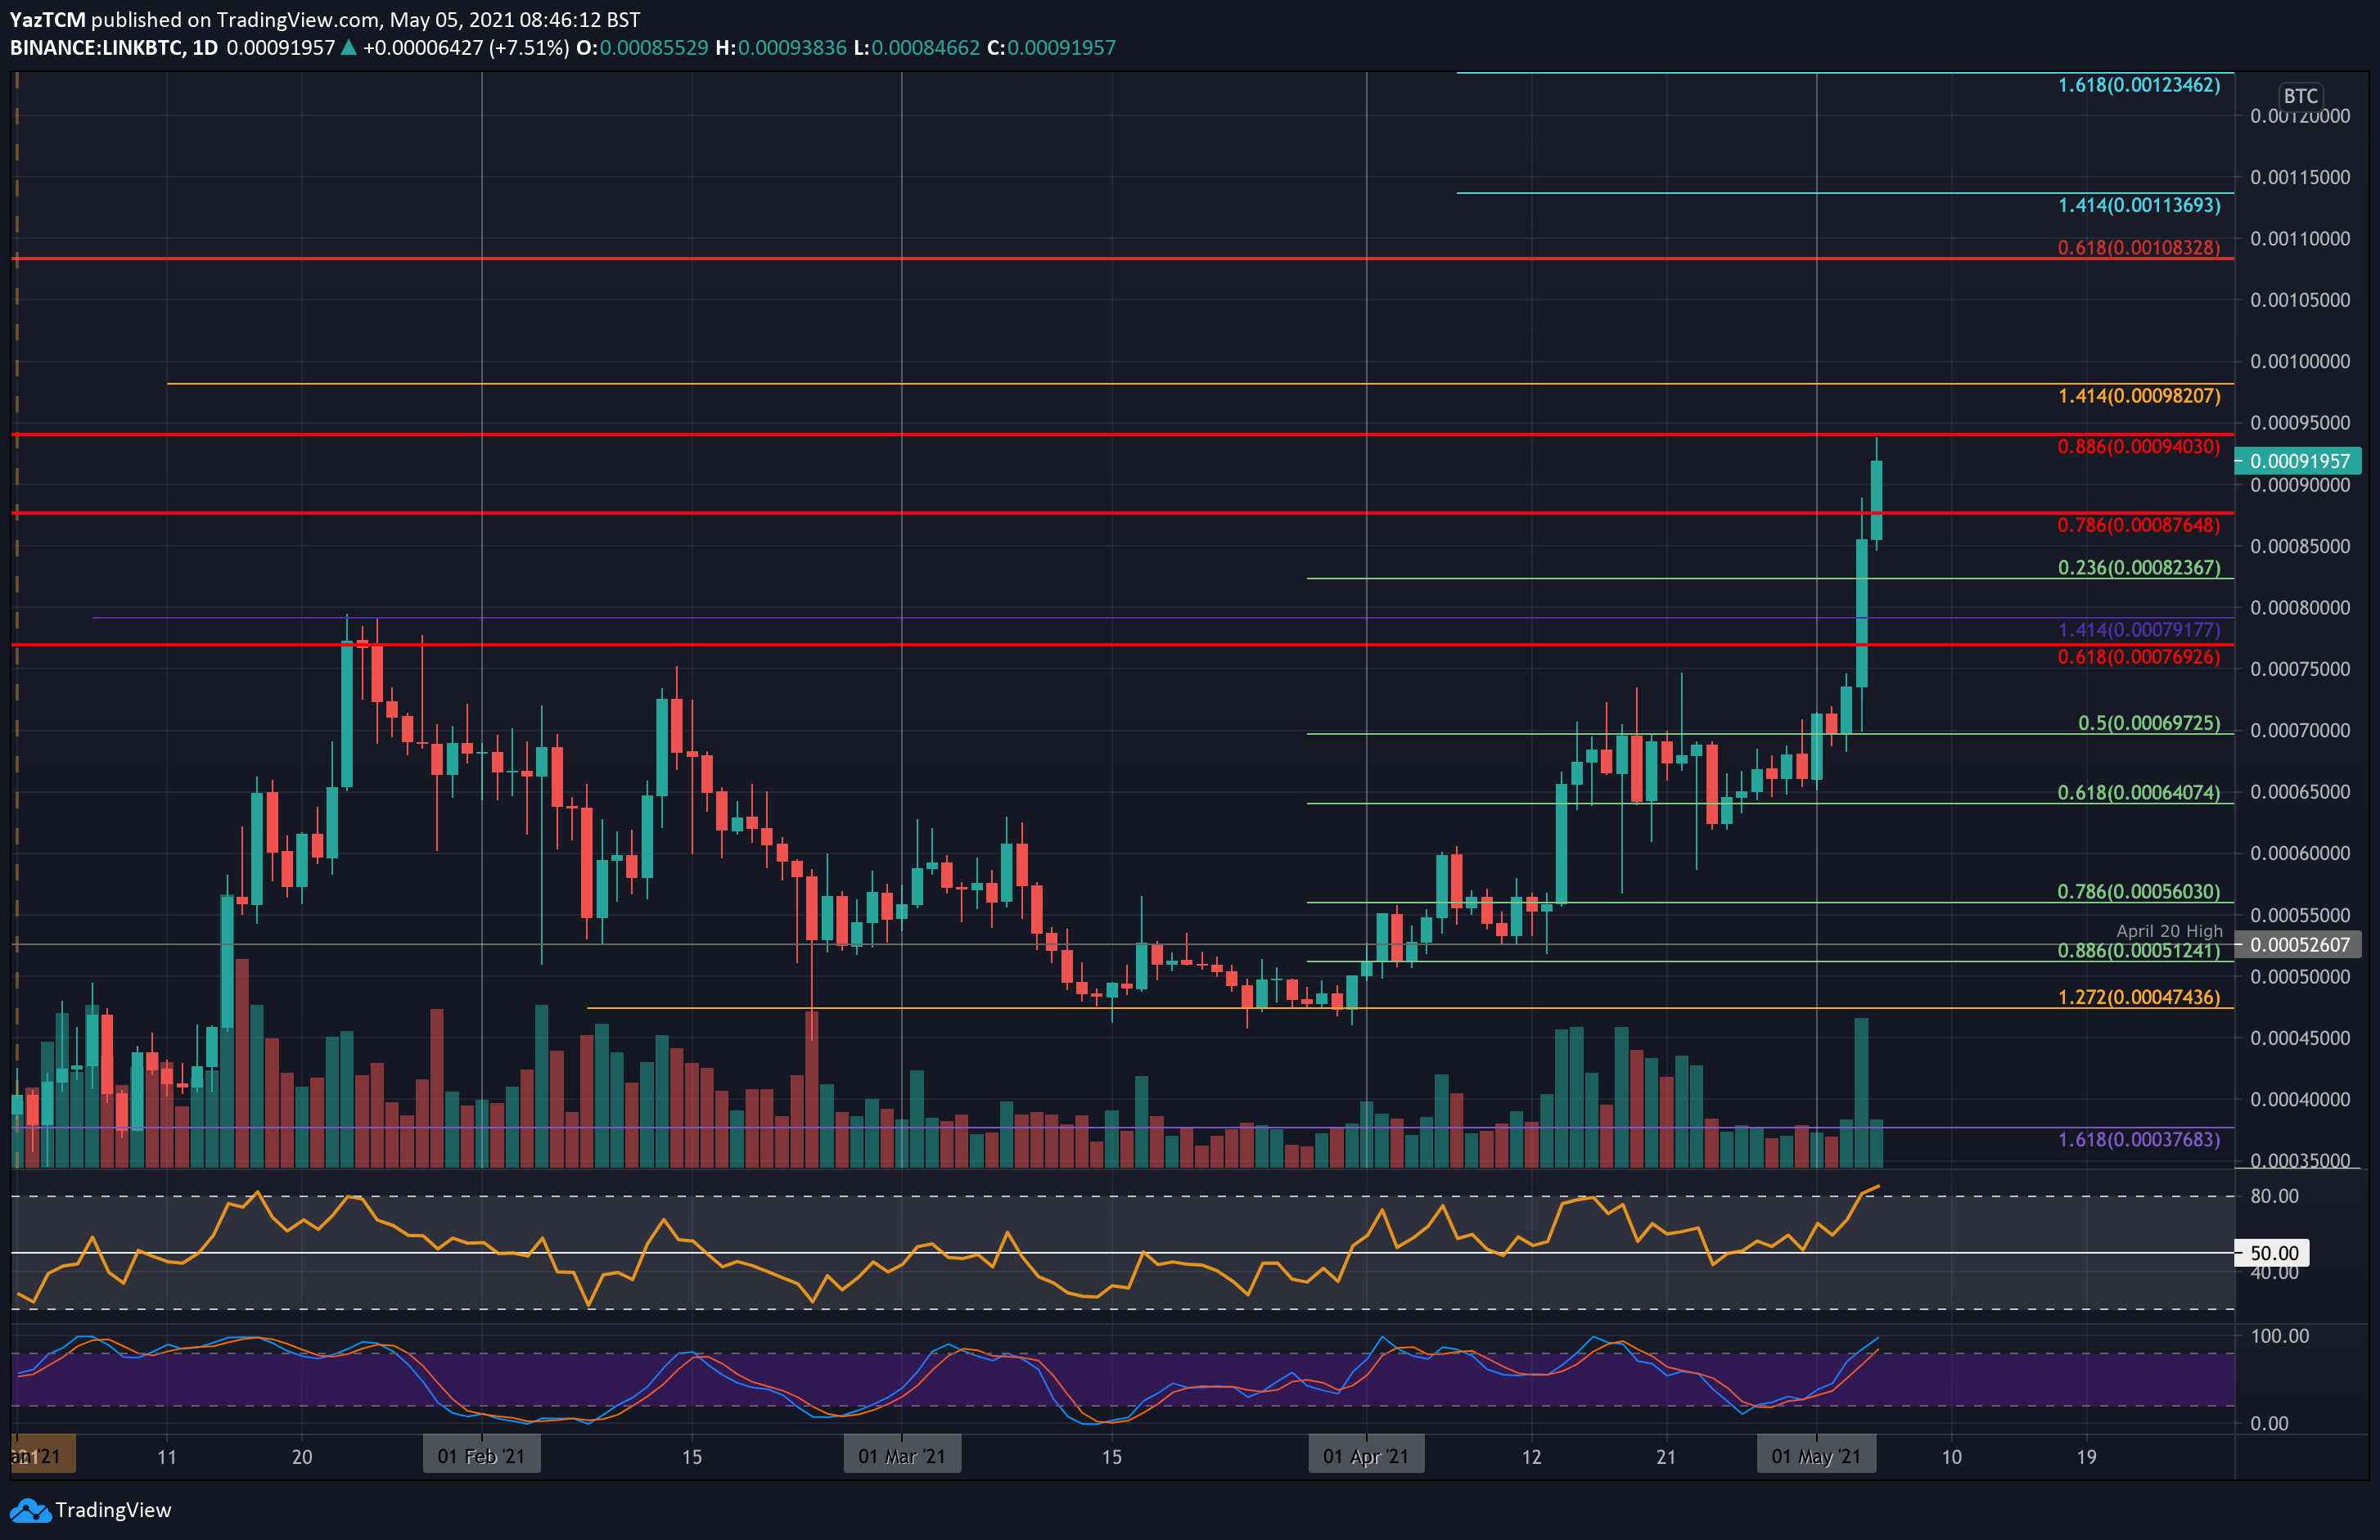
Key Support Levels: 0.0009 BTC, 0.000823 BTC, 0.00075 BTC.
Key Resistance Levels: 0.00094 BTC. 0.000982 BTC, 0.001 BTC.
LINK is also performing very well against bitcoin over the past two months. It pushed higher from 0.0005 BTC at the start of April and continued upward until finding resistance at 0.0007 BTC.
The resistance at 0.0007 BTC was not penetrated until the beginning of May when LINK started to push higher again. Yesterday, LINK surged from a low of 0.0007 BTC to reach as high as 0.00088 BTC. Today, it continued to run as high as 0.00094 BTC, where it found resistance at a bearish .886 Fib Retracement.
Looking ahead, if the bulls break 0.00094 BTC, the first resistance lies at 0.000982 BTC (1.414 Fib Extension). This is followed by 0.001 BTC, 0.00108 BTC (long-term bearish .618 Fib), and 0.00113 BTC (1.414 Fib Extension).
On the other side, the first support lies at 0.0009 BTC. This is followed by 0.000823 BTC (.236 Fib), 0.00075 BTC, 0.000697 BTC (.5 Fib), and 0.00064 BTC (.618 Fib).
Likewise, the RSI is the highest it has been this year, indicating that the bulls are in complete control over the market right now. It is slightly overbought, which might lead to a short-term retracement.