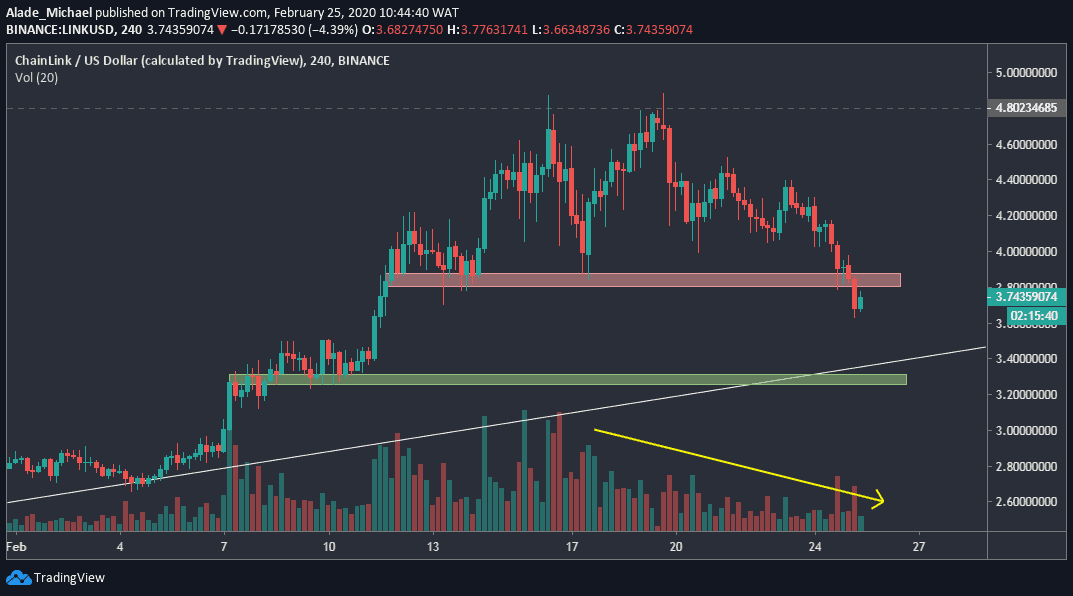
Key Resistance Levels: $3.8 $4.4, $4.8
Key Support Levels: $3.3, $3, $2.8
Since Chainlink turned away at the 7-month high of $4.80, the price correction has become notable, and it currently trades at $3.75. LINK lost 20% in seven days. Meanwhile, this bearish correction was footed by a double-top formation.
Losing 9.15% overnight has caused a lot of selling pressure in the market. This sent LINK below a critical support level of $3.8 – the red horizontal area on the 4-hours chart. This support is now turned resistance.
Notwithstanding, there’s hope for the bulls. The only condition for a bullish continuation is if LINK/USD can find support on the white rising trend line that was drawn based on the low on January 2nd. Otherwise, the bearishness might just be starting if Chainlink drops beneath this trend line.
Chainlink is seriously losing momentum, but it appeared the bears might run out of steam around the $3.3 support – where the green horizontal area lies. If this support fails to hold, Link may roll at $3 and perhaps $2.8.
In case Link finds support around $3.3, the critical resistance to watch here is $3.8, which was broken a few hours ago. If Chainlink can reclaim $4, the next level of resistance is $4.4 and $4.8, where a new bullish rally is expected to start.
As we can see on the chart, Link’s volume is down at the moment. We can anticipate an upward move as soon as the trading volume starts to increase. For now, the bearish bias remains dominant on a short-term perspective.
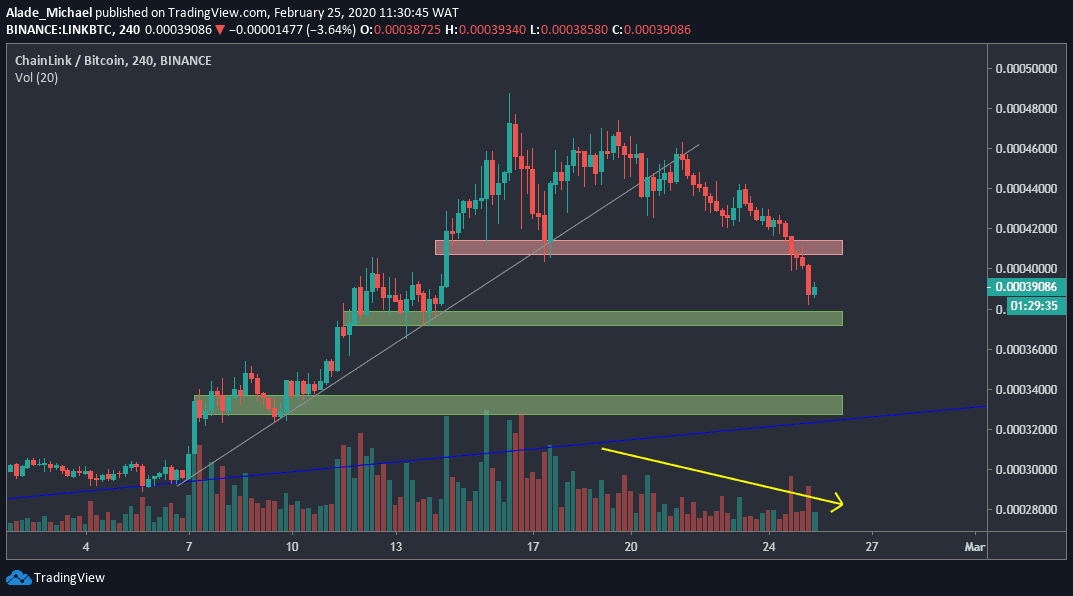
Key Resistance Levels: 41000SAT, 44000SAT, 46000SAT
Key Support Levels: 37600SAT, 35000SAT, 33000SAT
Against Bitcoin, Link sold off after recording a yearly high at around 48750SAT on February 16th. This bearish scenario has led to roughly 18% drops within ten days following a break below the two-week grey rising trend line.
Apart from that, Chainlink dropped below a key area of 41000SAT after losing 7.38% today. While Link roams around the 39000SAT level, the price is similarly trading near important support at the 37600SAT level.
If the price continues to drop for the next few days, Chainlink is likely to locate support on the blue diagonal line that was formed since January.
The 4-hours chart for Chainlink suggested a bearish trend as price heads towards support. Currently, Link is almost dropping into the green support area of 37600SAT after losing 41000SAT level.
If the bears overcome the above-mentioned support, the second green area of 33000SAT is the next. Meanwhile, there’s small support around the 35000SAT level.
For the bulls, the first level of resistance lies in the red area of 41000SAT, followed by 44000SAT and 46000SAT – from where the correction started in the mid-month.
One more thing to consider here is the decreasing volume – the yellow descending arrow on the 4-hours chart. Though, there’s a high probability that the bearish sentiment would soon end. On the other hand, it may last longer if the volume continues to fade off.