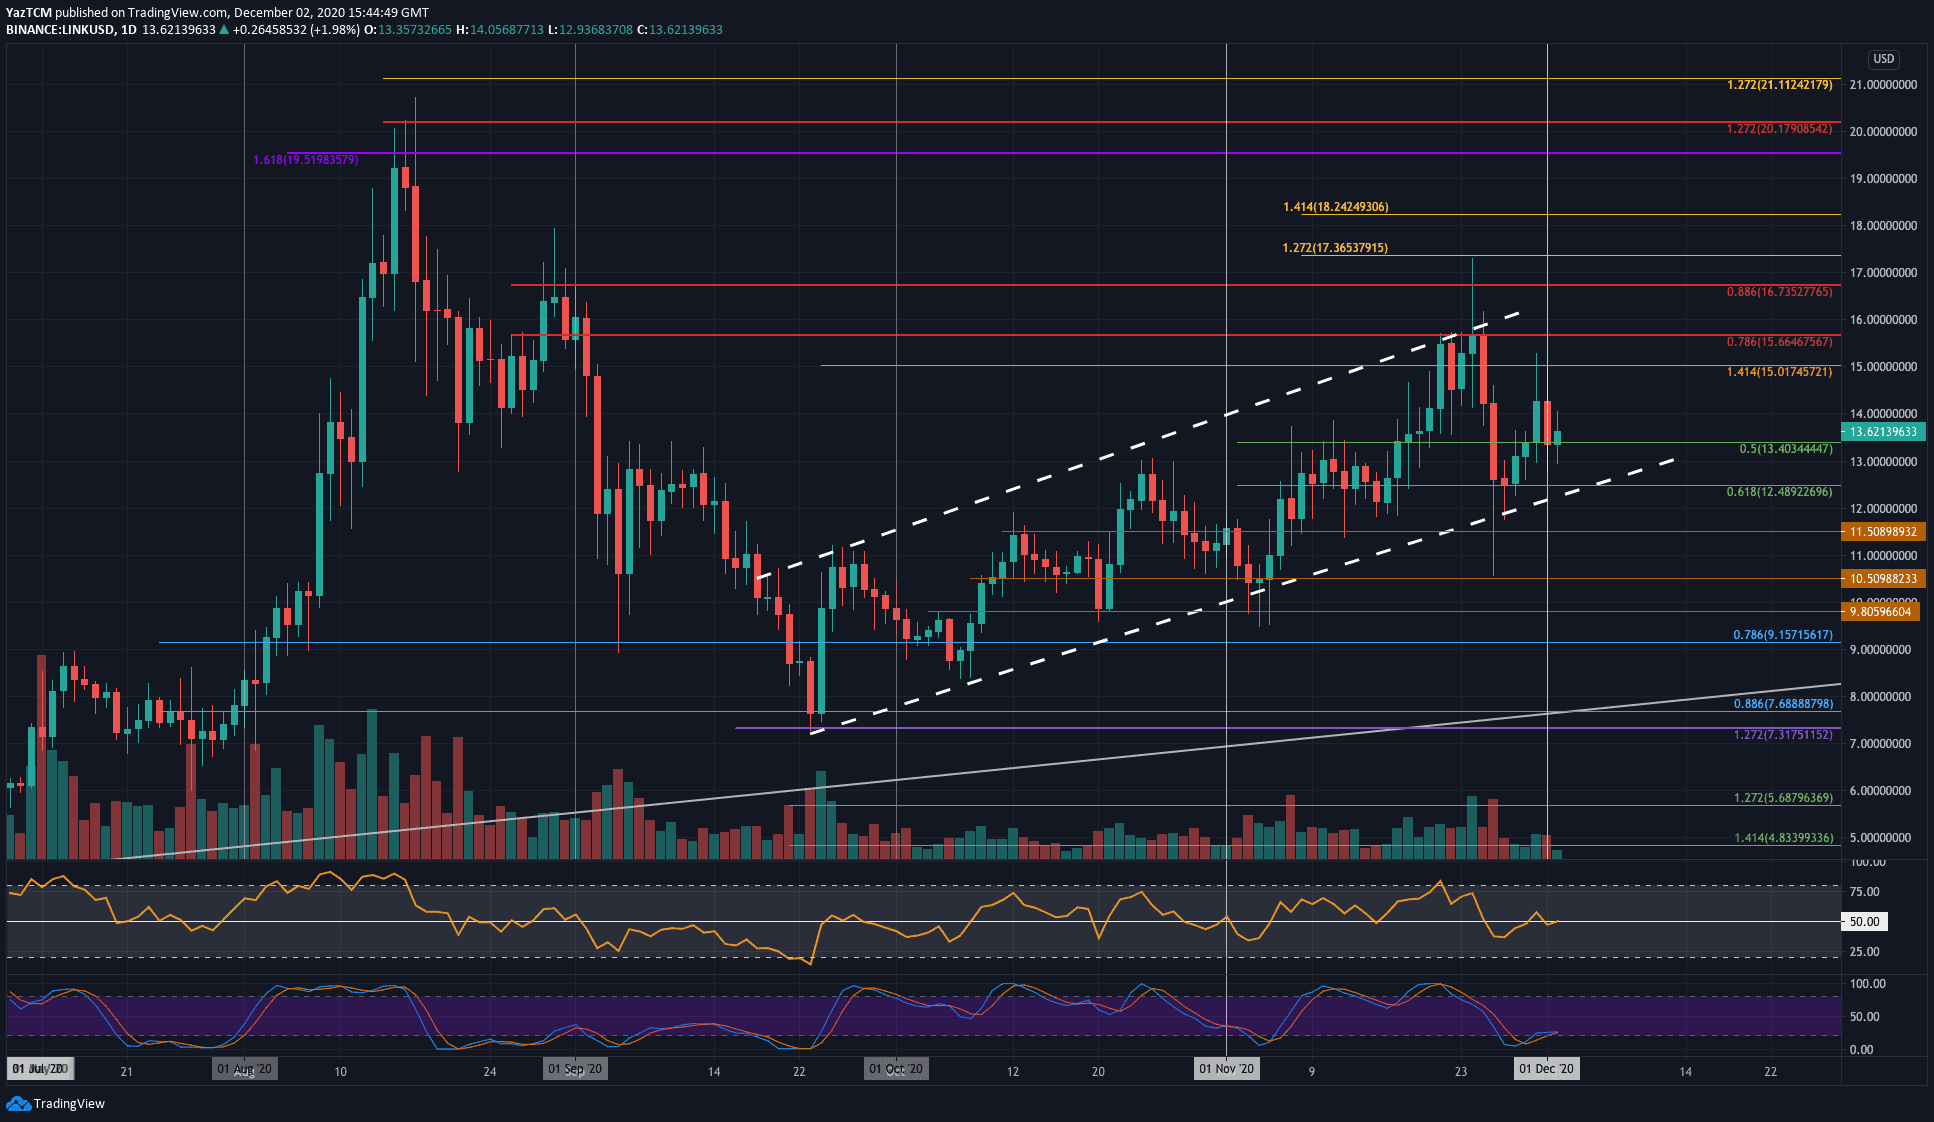
LINK/USD Daily Chart. Source: TradingView
Key Support Levels: $13, $12.50, $12.
Key Resistance Levels: $0.15, $15.66, $16.73.
Over the past fortnight, LINK surged higher from the $12 support to push into the resistance at the upper boundary of a 2-month-old rising price channel. The resistance there was further bolstered by a bearish .786 Fib Retracement at the $15.66 level.
LINK was unable to break this line and it started to head lower last week. It dropped into the support at $12.48 (.618 Fib) at the end of November which allowed it to rebound again. Unfortunately, it struggled to break $15 and is now trading at $13.62.
Looking ahead, if the buyers push higher, the first level of resistance lies at $15. This is followed by $15.66 (bearish .786 Fib), the upper boundary of the price channel, $16.73 (bearish .886 Fib), and $17.36 (1.272 Fib Extension).
On the other side, if the sellers break beneath $13.40, the first level of support lies at $13. This is followed by $12.50 (lower boundary of price channel & .618 Fib), $12, and $11.50.
The RSI is trading at the mid-line as indecision looms within the market. However, the Stochastic RSI is primed for a bullish crossover signal that could send the market upward.
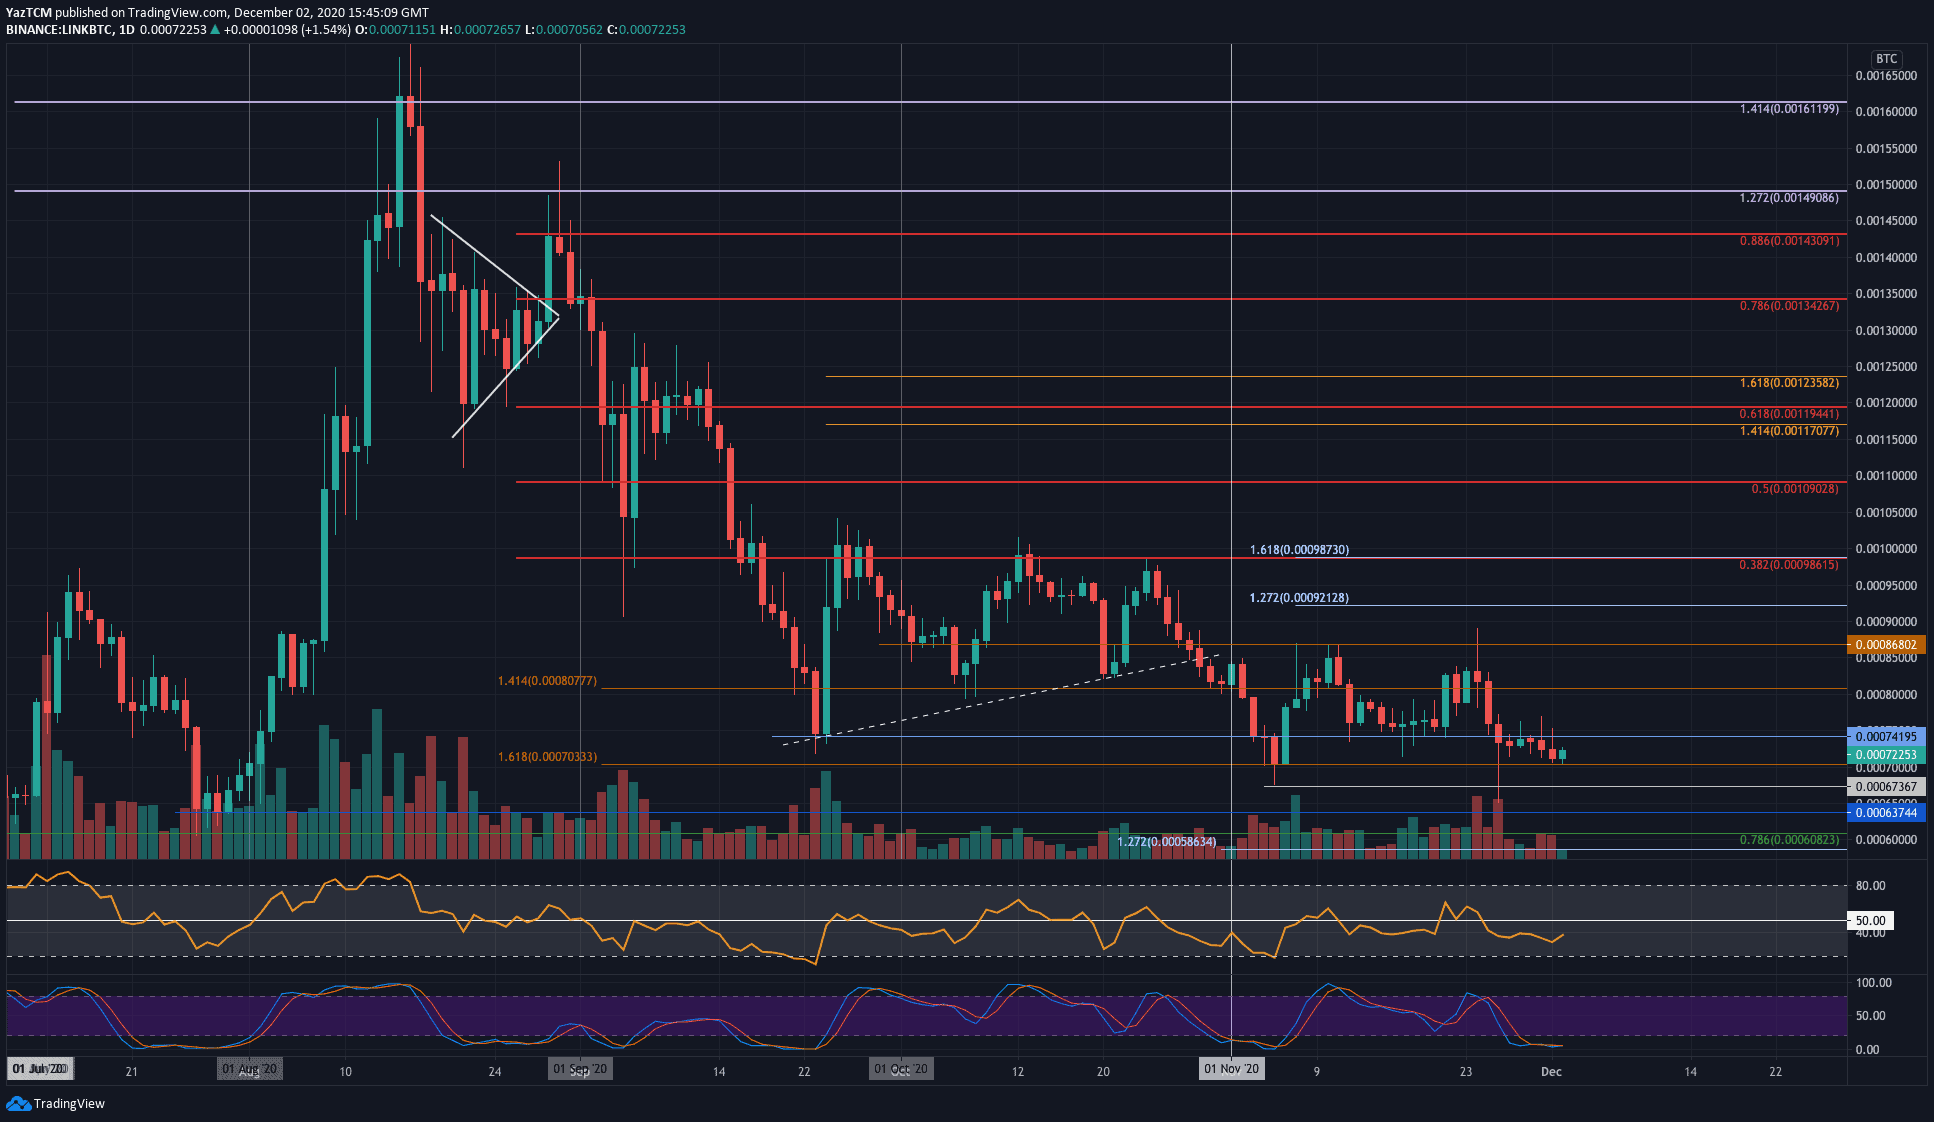
Key Support Levels: 70,000 SAT, 67,367 SAT, 65,000 SAT.
Key Resistance Levels: 74,200 SAT, 80,000 SAT, 86,800 SAT.
Against Bitcoin, LINK dropped from resistance at 86,800 SAT earlier last week and fell into the support at 70,333 SAT yesterday. This was the low-day closing price for LINK during October.
LINK has since rebounded slightly to trade at 72,250 SAT but the outlook is looking pretty bearish if the market breaks beneath 70,000 SAT.
Looking ahead, if the sellers break 70,000 SAT, support lies at 67,367 SAT (October lows), 65,000 SAT, 63,744 SAT, and 60,825 SAT (.786 Fib).
On the other side, the first level of resistance lies at 74,200 SAT. This is followed by 80,000 SAT, 86,800 SAT, and 92,130 SAT.
The Stochastic RSI is primed for a bullish crossover signal from oversold conditions which could stop the current downtrend.