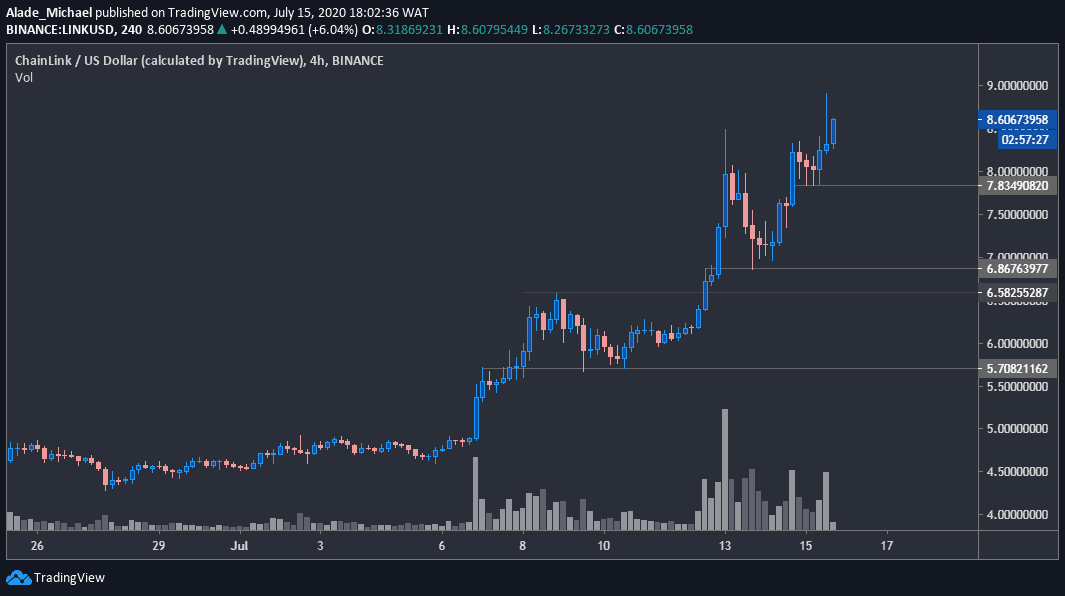
Key Resistance Levels: $8.9 – $9, $9.5, $10
Key Support Levels: $7.83, $6.86, $5.7
After climbing above $5 earlier this month, Chainlink saw an impressive 70% increase to reach over $8.9 earlier today. The price couldn’t hold there, and of writing these lines, LINK is trading around the $8.5 mark.
Looking at the current price actions, the 8th largest cryptocurrency by market cap is regaining momentum after correcting to around $6.86 on Monday.
However, buyers are still aiming to push the price towards $9 level. A daily close above $9 can be a bullish sign for continuation.
A few hours ago, Chainlink recorded a new ATH at $8.9 level following a daily 18% gain. A breakout of this level might see buyers through to $9.5 and perhaps the legendary $10 in the short-term future.
In case of a drop, the $8.5 level (previous high and current price) is likely to become strong support. If the level fails to hold, the next possible support might be at $7.83 and $6.86. Below these levels lies close support at $6.52 before a further drop to $5.7. As of now, the trend is looking bullish on a mid-term perspective.
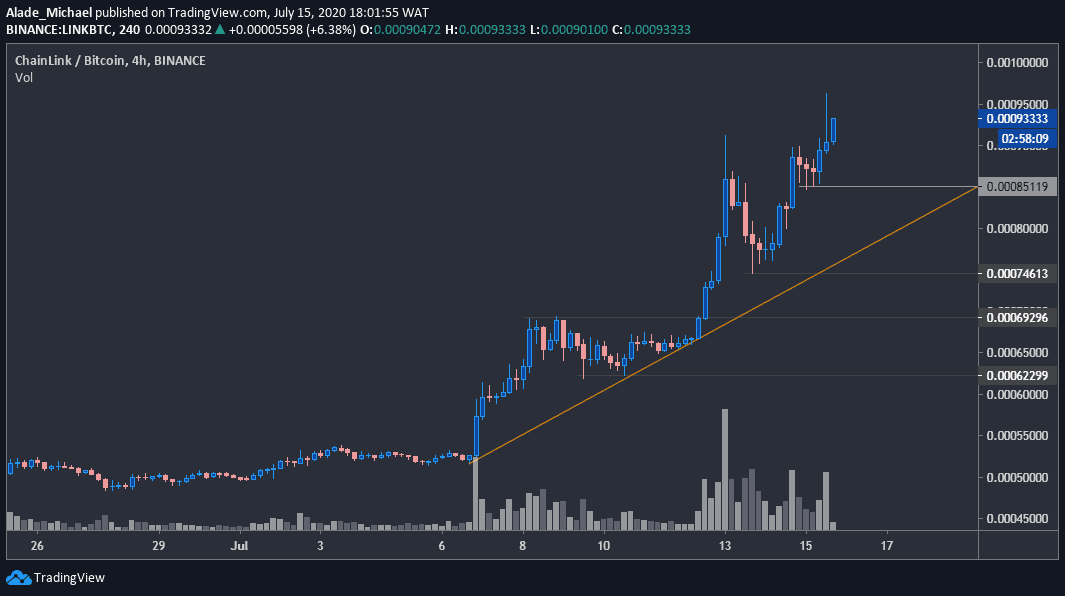
Key Resistance Levels: 96359 SAT, 10000 SAT, 10500 SAT
Key Support Levels: 85119 SAT, 74613 SAT, 69296 SAT
Against Bitcoin, the price of Chainlink is bouncing back on the 4-hours chart with a 15% increase over the past hours.
Technically, Chainlink’s volume is slowly fading in the above chart, which indicates that buying volume is slowly declining. As can be seen above, the latest candle formation reveals low trading volatility in the market over the past hours.
The price dropped since reaching the all-time high earlier today, as there’s still a chance for a retest of the 85119 SAT level, around the orange marked ascending line. LINK may continue to lose momentum if the price dips below this orange line.
From below, immediate support to watch below this orange line is around 74613 SAT level. The subsequent support to keep in mind is 69296 SAT, followed by last week’s low of 62299 SAT level.
Despite that, LINK is following a bullish sentiment on the 4-hour timeframe. An increase above the previous wick at 96359 SAT could recharge buying power towards the psychological level at 10000 SAT. Above this, the 10500 SAT should be the next level to keep an eye on.