The Cardano surge has continued over the past few days after rising by a total of 15% during the past week. The cryptocurrency has now seen a significant price surge totaling 60%.
The coin has recently reached resistance causing the bullish surge to slow down. However, this resistance is not deemed to be strong, and therefore we can expect Cardano’s Bullish momentum, as long as this Alcoin season continues.
Cardano remains ranked in 10th position on the top cryptos by market cap, with a $1.82 billion market cap valuation.
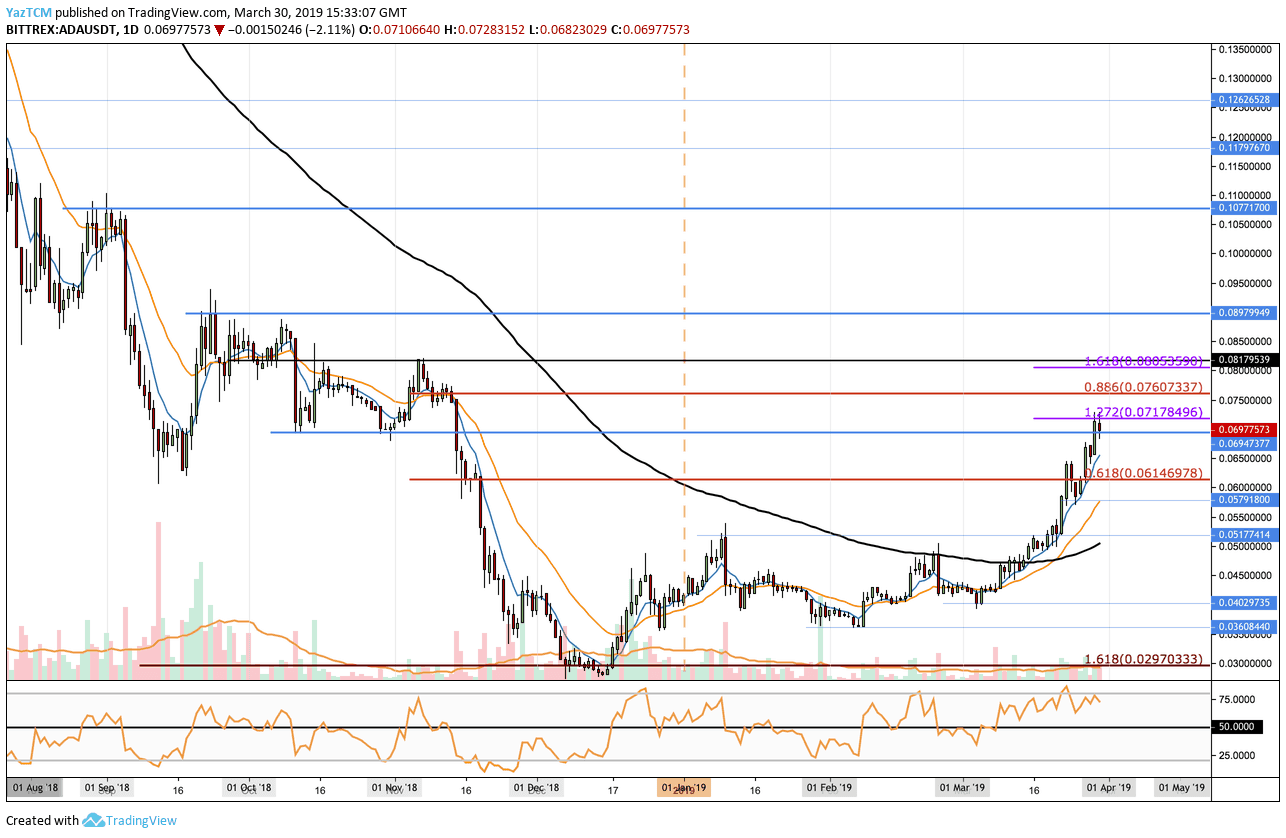
Looking at the ADA/USD 1-Day Chart:
- Since our previous ADA/USD analysis, we can see that the market has continued to rise and has now reached our outlined resistance at $0.072 where lies the short term 1.272 Fibonacci Extension level.
- From above: The nearest level of resistance now lies at $0.076 where lies the short term bearish .886 Fibonacci Retracement level. Above this, we can expect further resistance at $0.081, $0.089 and $0.1.
- From below: The nearest level of support lies at $0.06947 – $0.07 area. Support beneath this can then be expected at $0.06146, $0.057 and $0.05177.
- The trading volume has increased significantly toward the end of March 2019.
- The RSI remains in bullish territory. However, it is pointing downward which could turn into a healthy correction following the rally.
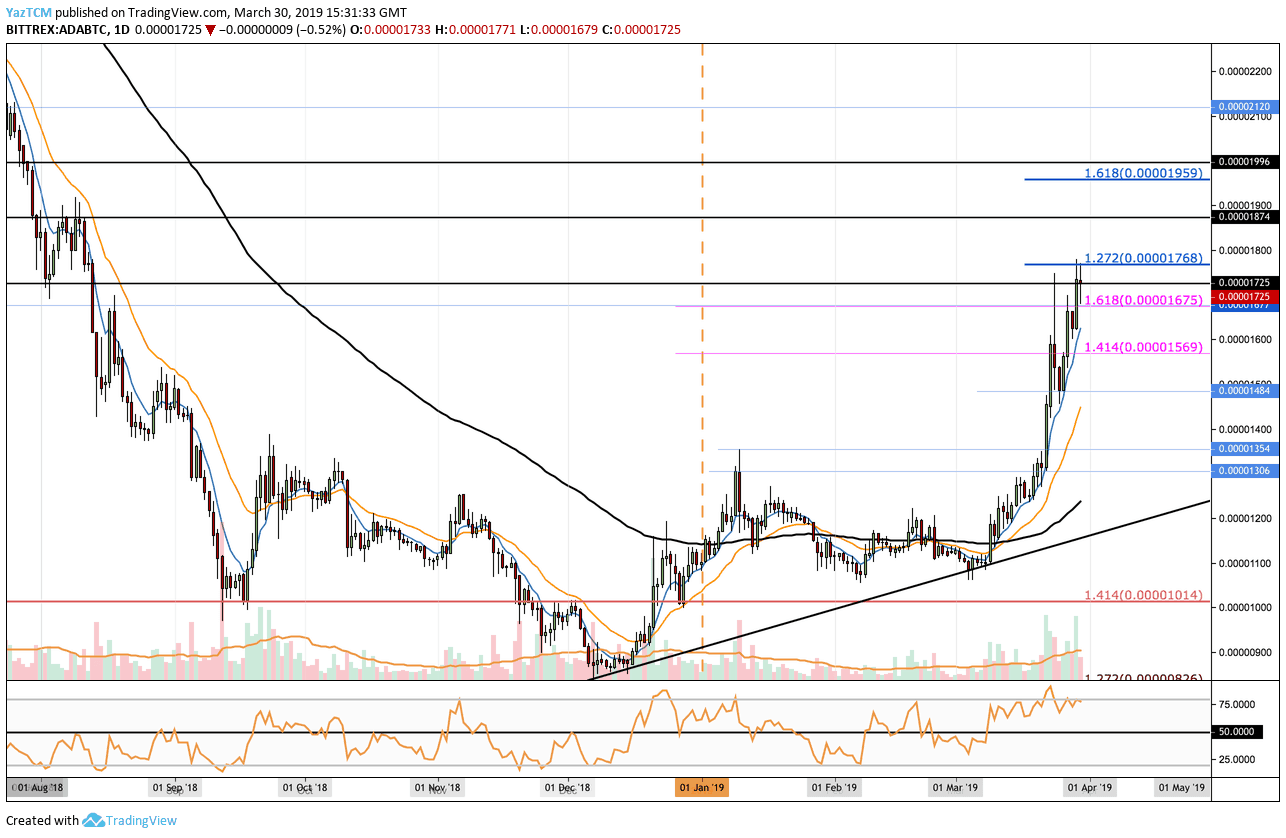
Looking at the ADA/BTC 1 Day Chart:
- Against Bitcoin, we can see that ADA has also reached resistance on the following chart’s highlighted area of 1768 SAT, where lies the short term 1.272 Fibonacci Extension level (marked in blue). The coin has rejected slightly and is now trading around support level of 1700 – 1725 SAT.
- From above: The nearest resistance level lies at 1768 SAT (as mentioned). Above this, we can expect further resistance at 1874 SAT and the area between 1959 and 2000 SAT.
- From below: The nearest support lies at 1675 SAT and 1570 SAT. If the sellers push the coin beneath 1500 SAT, we can then expect more support at 1484 SAT and 1354 SAT.
- The trading volume has picked up substantially throughout March.
- The RSI is in bullish territory and continues to look strong.
SPECIAL OFFER (Sponsored)
LIMITED OFFER 2024 for CryptoPotato readers at Bybit: Use this link to register and open a $500 BTC-USDT position on Bybit Exchange for free!
Disclaimer: Information found on CryptoPotato is those of writers quoted. It does not represent the opinions of CryptoPotato on whether to buy, sell, or hold any investments. You are advised to conduct your own research before making any investment decisions. Use provided information at your own risk. See Disclaimer for more information.
Cryptocurrency charts by TradingView.