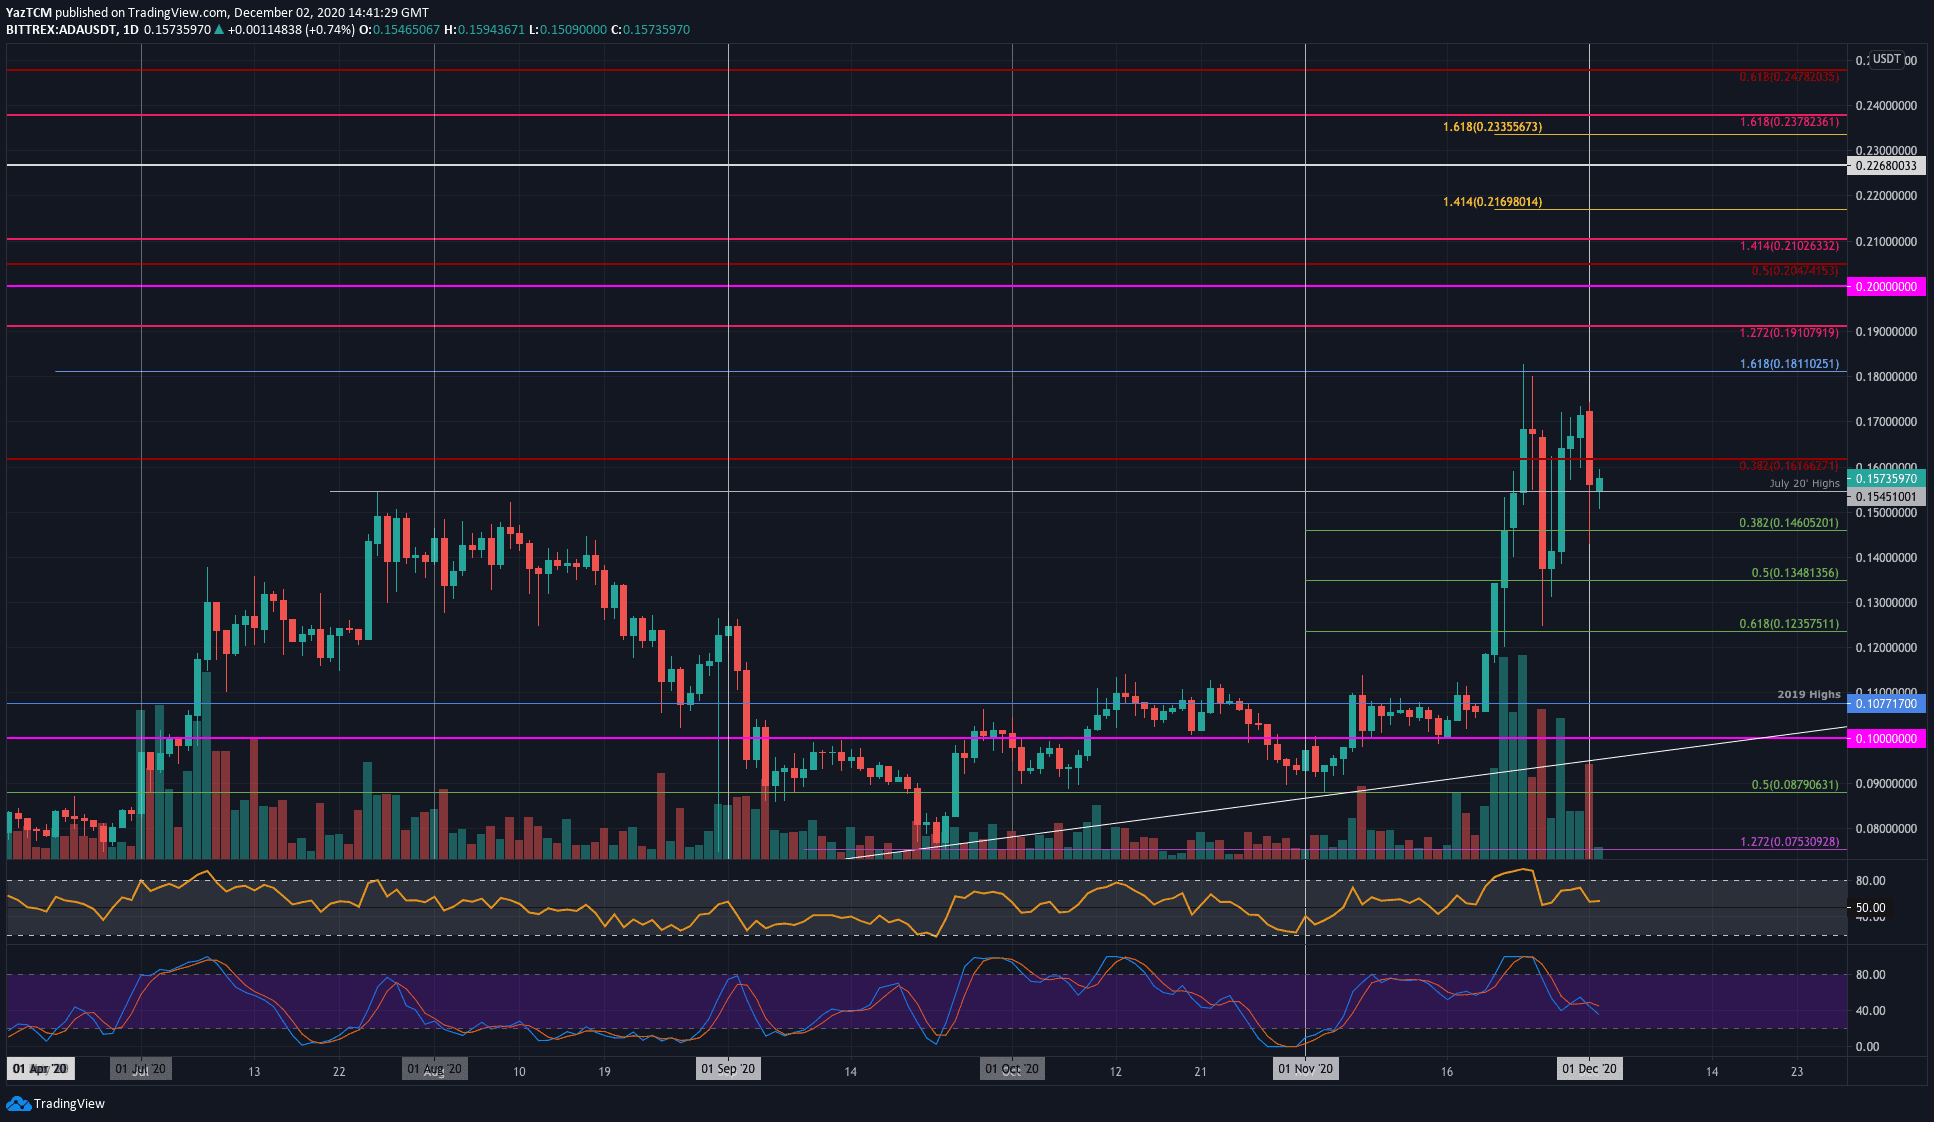
ADA/USD Daily Chart. Source: TradingView
Key Support Levels: $0.155, $0.146, $0.14.
Key Resistance Levels: $0.161, $0.17, $0.181.
ADA posted a fresh 2020 high during November when it surged to the $0.181 level. From there, it dropped lower to find the support around $0.135 (.5 Fib). It rebounded toward the end of November and managed to close a daily candle above $0.17 yesterday.
ADA dropped beneath $0.15 yesterday to reach as low as $0.135. It has since rebounded, and the bulls are now battling to keep above the July 2020 highs.
Looking ahead, if the bulls continue upward from here, the first level of resistance lies at $0.161 (bearish .382 Fib). This is followed by $0.17, $0.181, $0.191, and $0.2.
On the other side, if the sellers break the support at $0.155, additional support is found at $0.146 (.382 Fib), $0.14, $0.135 (.5 Fib), and $0.123 (.618 Fib).
The daily RSI is trading near the mid-level to indicate indecision within the market as bullish momentum fades.
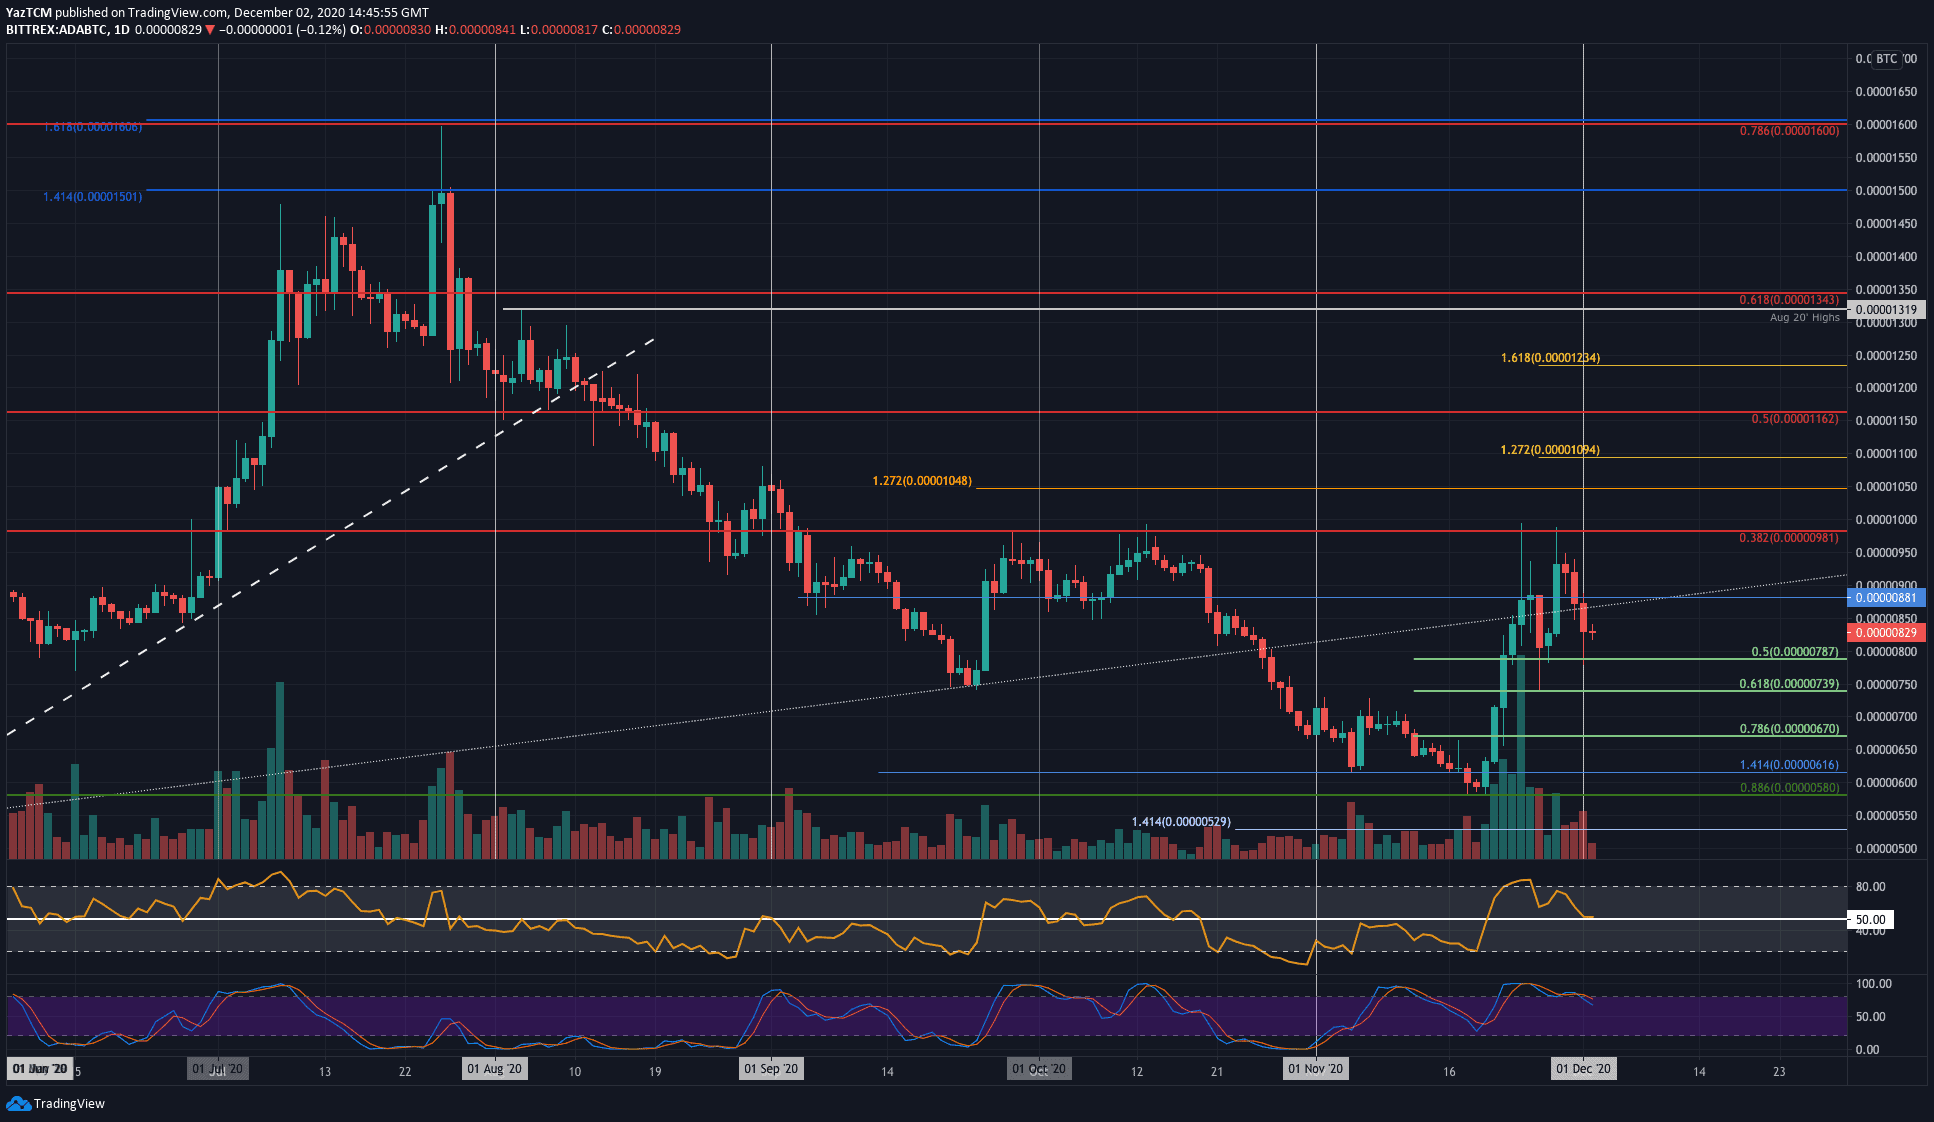
Key Support Levels: 787 SAT, 740 SAT, 700 SAT.
Key Resistance Levels: 881 SAT, 900 SAT, 980 SAT.
Against Bitcoin, Cardano managed to surge into the 980 SAT resistance (bearish .382 Fib Retracement) toward the end of November after rebounding from 580 SAT earlier in the month.
It was unable to overcome the 980 SAT and dropped lower over the past four days as a result. It is now trading at 830 SAT.
Looking ahead, if the sellers continue, support is expected at 787 SAT (.5 Fib), 740 SAT (.618 Fib, and 700 SAT.
On the other side, resistance lies at 881 SAT, 900 SAT, and 980 SAT (bearish .382 Fib). This is followed by 1050 SAT, and 1100 SAT.
The RSI has also returned to the mid-line as indecision looms within the market. Additionally, the Stochastic RSI is primed for a bearish crossover in overbought conditions.