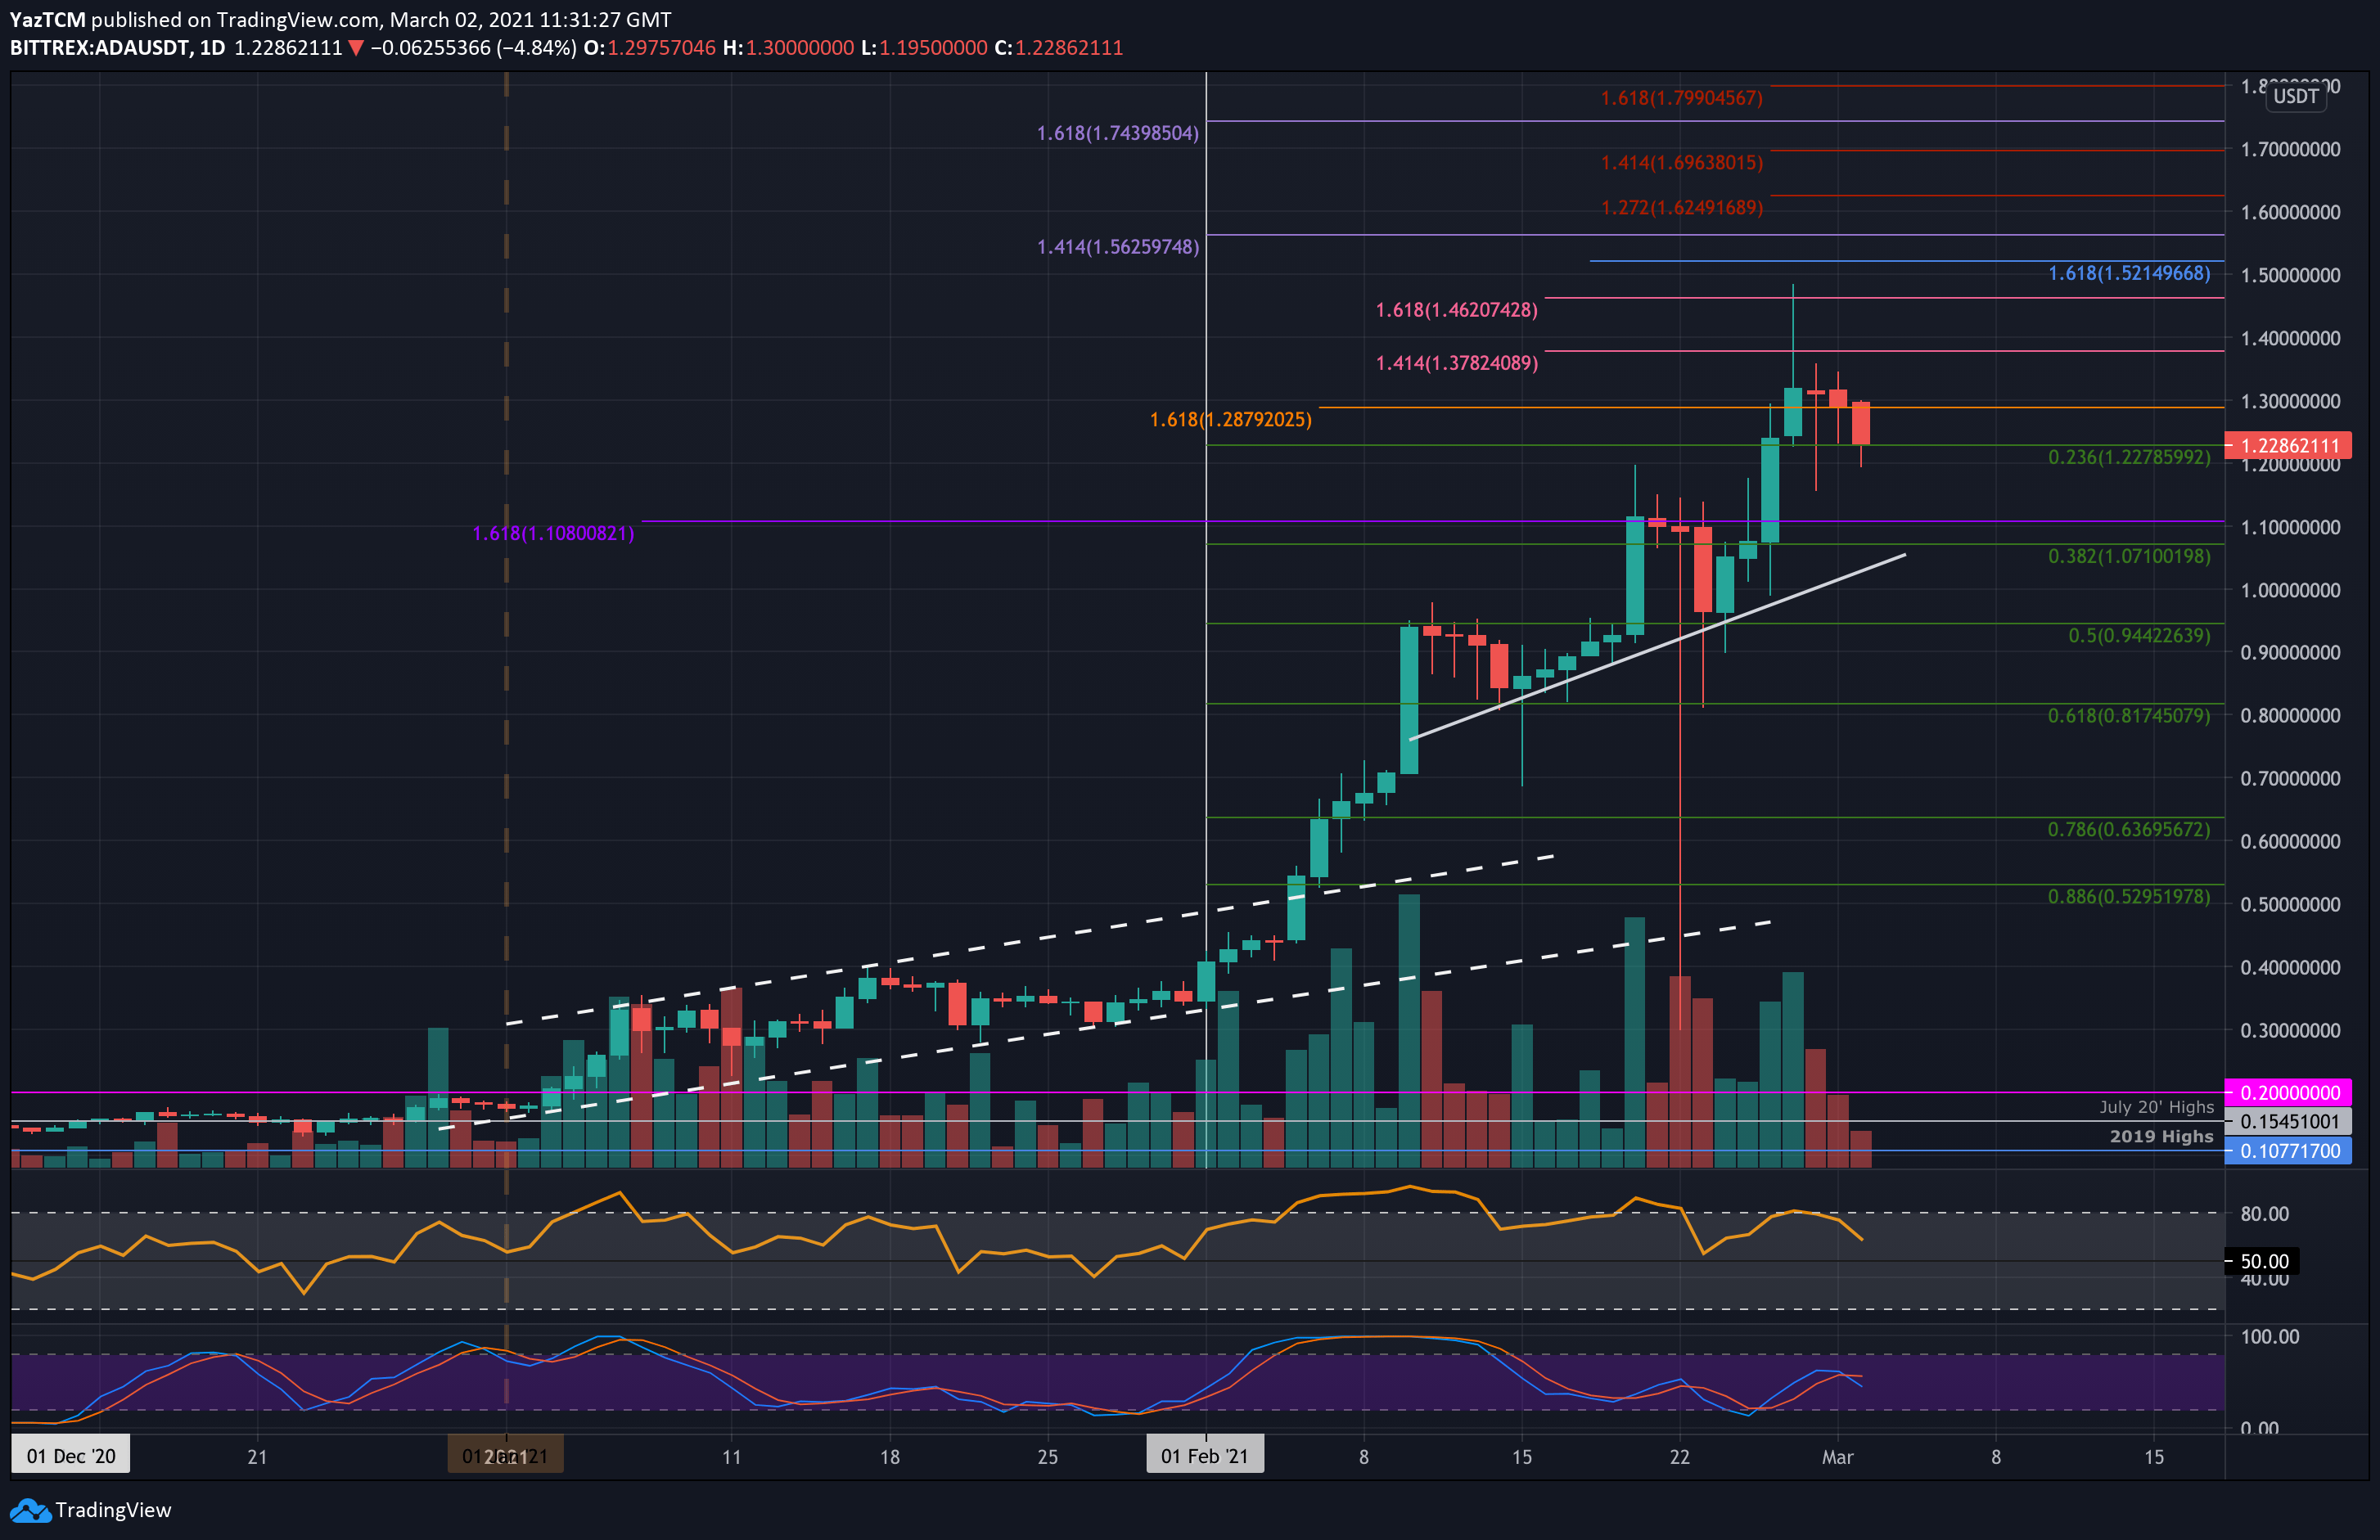
ADA/USD Daily Chart. Source: TradingView
Key Support Levels: $1.22, $1.07, $1.00.
Key Resistance Levels: $1.32, $1.40, $1.49.
The Mary upgrade for Cardano hit the mainnet a few hours ago, and ADA seems to have dropped by a small 2.8% to reach the support at $1.22 (.236 Fib). The cryptocurrency had clocked in a new ATH price on Saturday as it reached as high as $1.49, but it could not close a daily candle above $1.32 over the weekend.
Today, the 3% price drop caused ADA to drop into the .236 Fib as the volume from the previous surge starts to fade slightly. Nevertheless, ADA still remains up by a total of 11.5% over the past week.
Looking ahead, the first support lies at $1.22 (.236 Fib). This is followed by $1.07 (.382 Fib & ascending trend line), $1.00, and $0.944 (.5 Fib).
On the other side, the first resistance lies at $1.32. This is followed by $1.40, $1.49 (ATH price), $1.52, and $1.62 (1.272 Fib Extension – red).
The RSI is starting to trend lower, indicating fading bullish momentum. This might be the result of bearish divergence playing out that was apparent from February 20th to the weekend ATH.
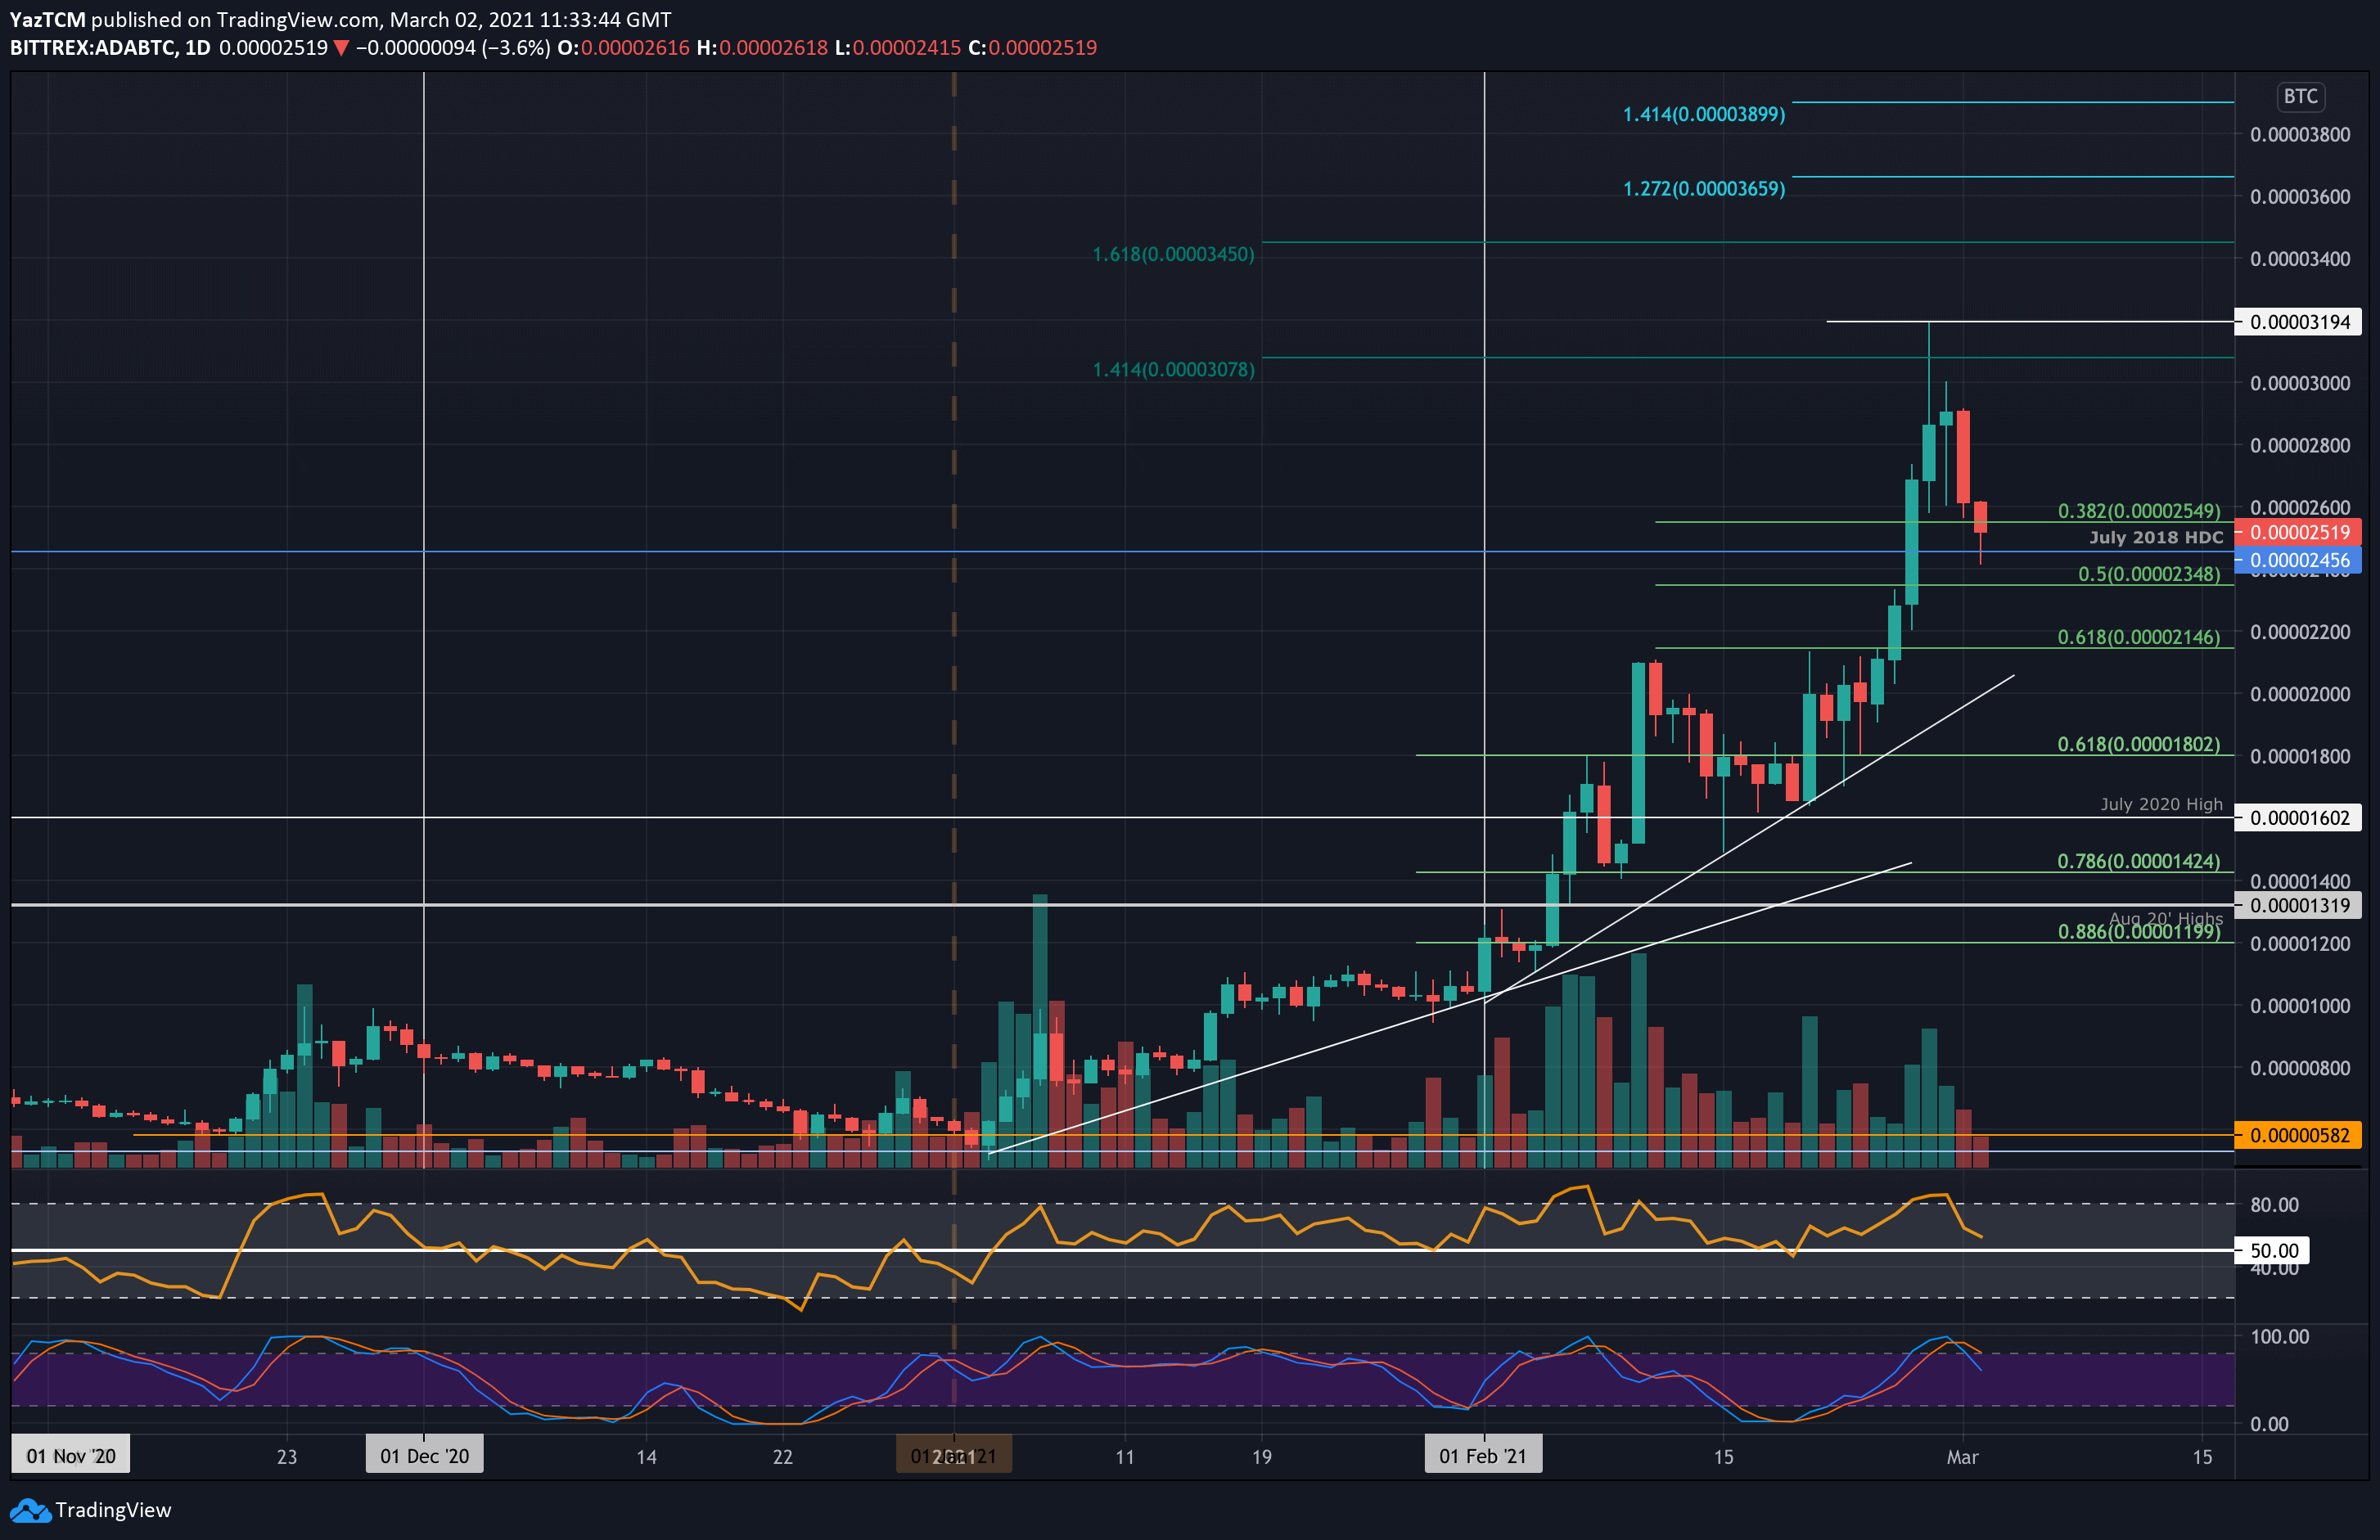
Key Support Levels: 2456 SAT, 2400 SAT, 2350 SAT.
Key Resistance Levels: 2600 SAT, 2900 SAT, 3000 SAT.
Cardano also witnessed a steep 14% price drop against Bitcoin over the past two days. The cryptocurrency had clocked a new ATH price at 3195 SAT on Saturday but could not close a daily candle above 2900 SAT.
As a result, ADA rolled over yesterday to reach as low as 2550 SAT (.382 Fib). Today, the selling continued, pushing ADA as low as 2400 SAT. It has since bounced higher as it trades around 2520 SAT.
Looking ahead, the first support lies at 2456 SAT. This is followed by 2400 SAT, 2350 SAT (.5 Fib), and 2146 SAT (.618 Fib).
On the other side, the first resistance lies at 2600 SAT. This is followed by 2900 SAT, 3000 SAT, and 3195 SAT (ATH price).
The RSI is also plummeting, indicating fading bullish momentum. It is still in the buyer’s favor, but if it penetrates beneath the midline, the bears will take over.