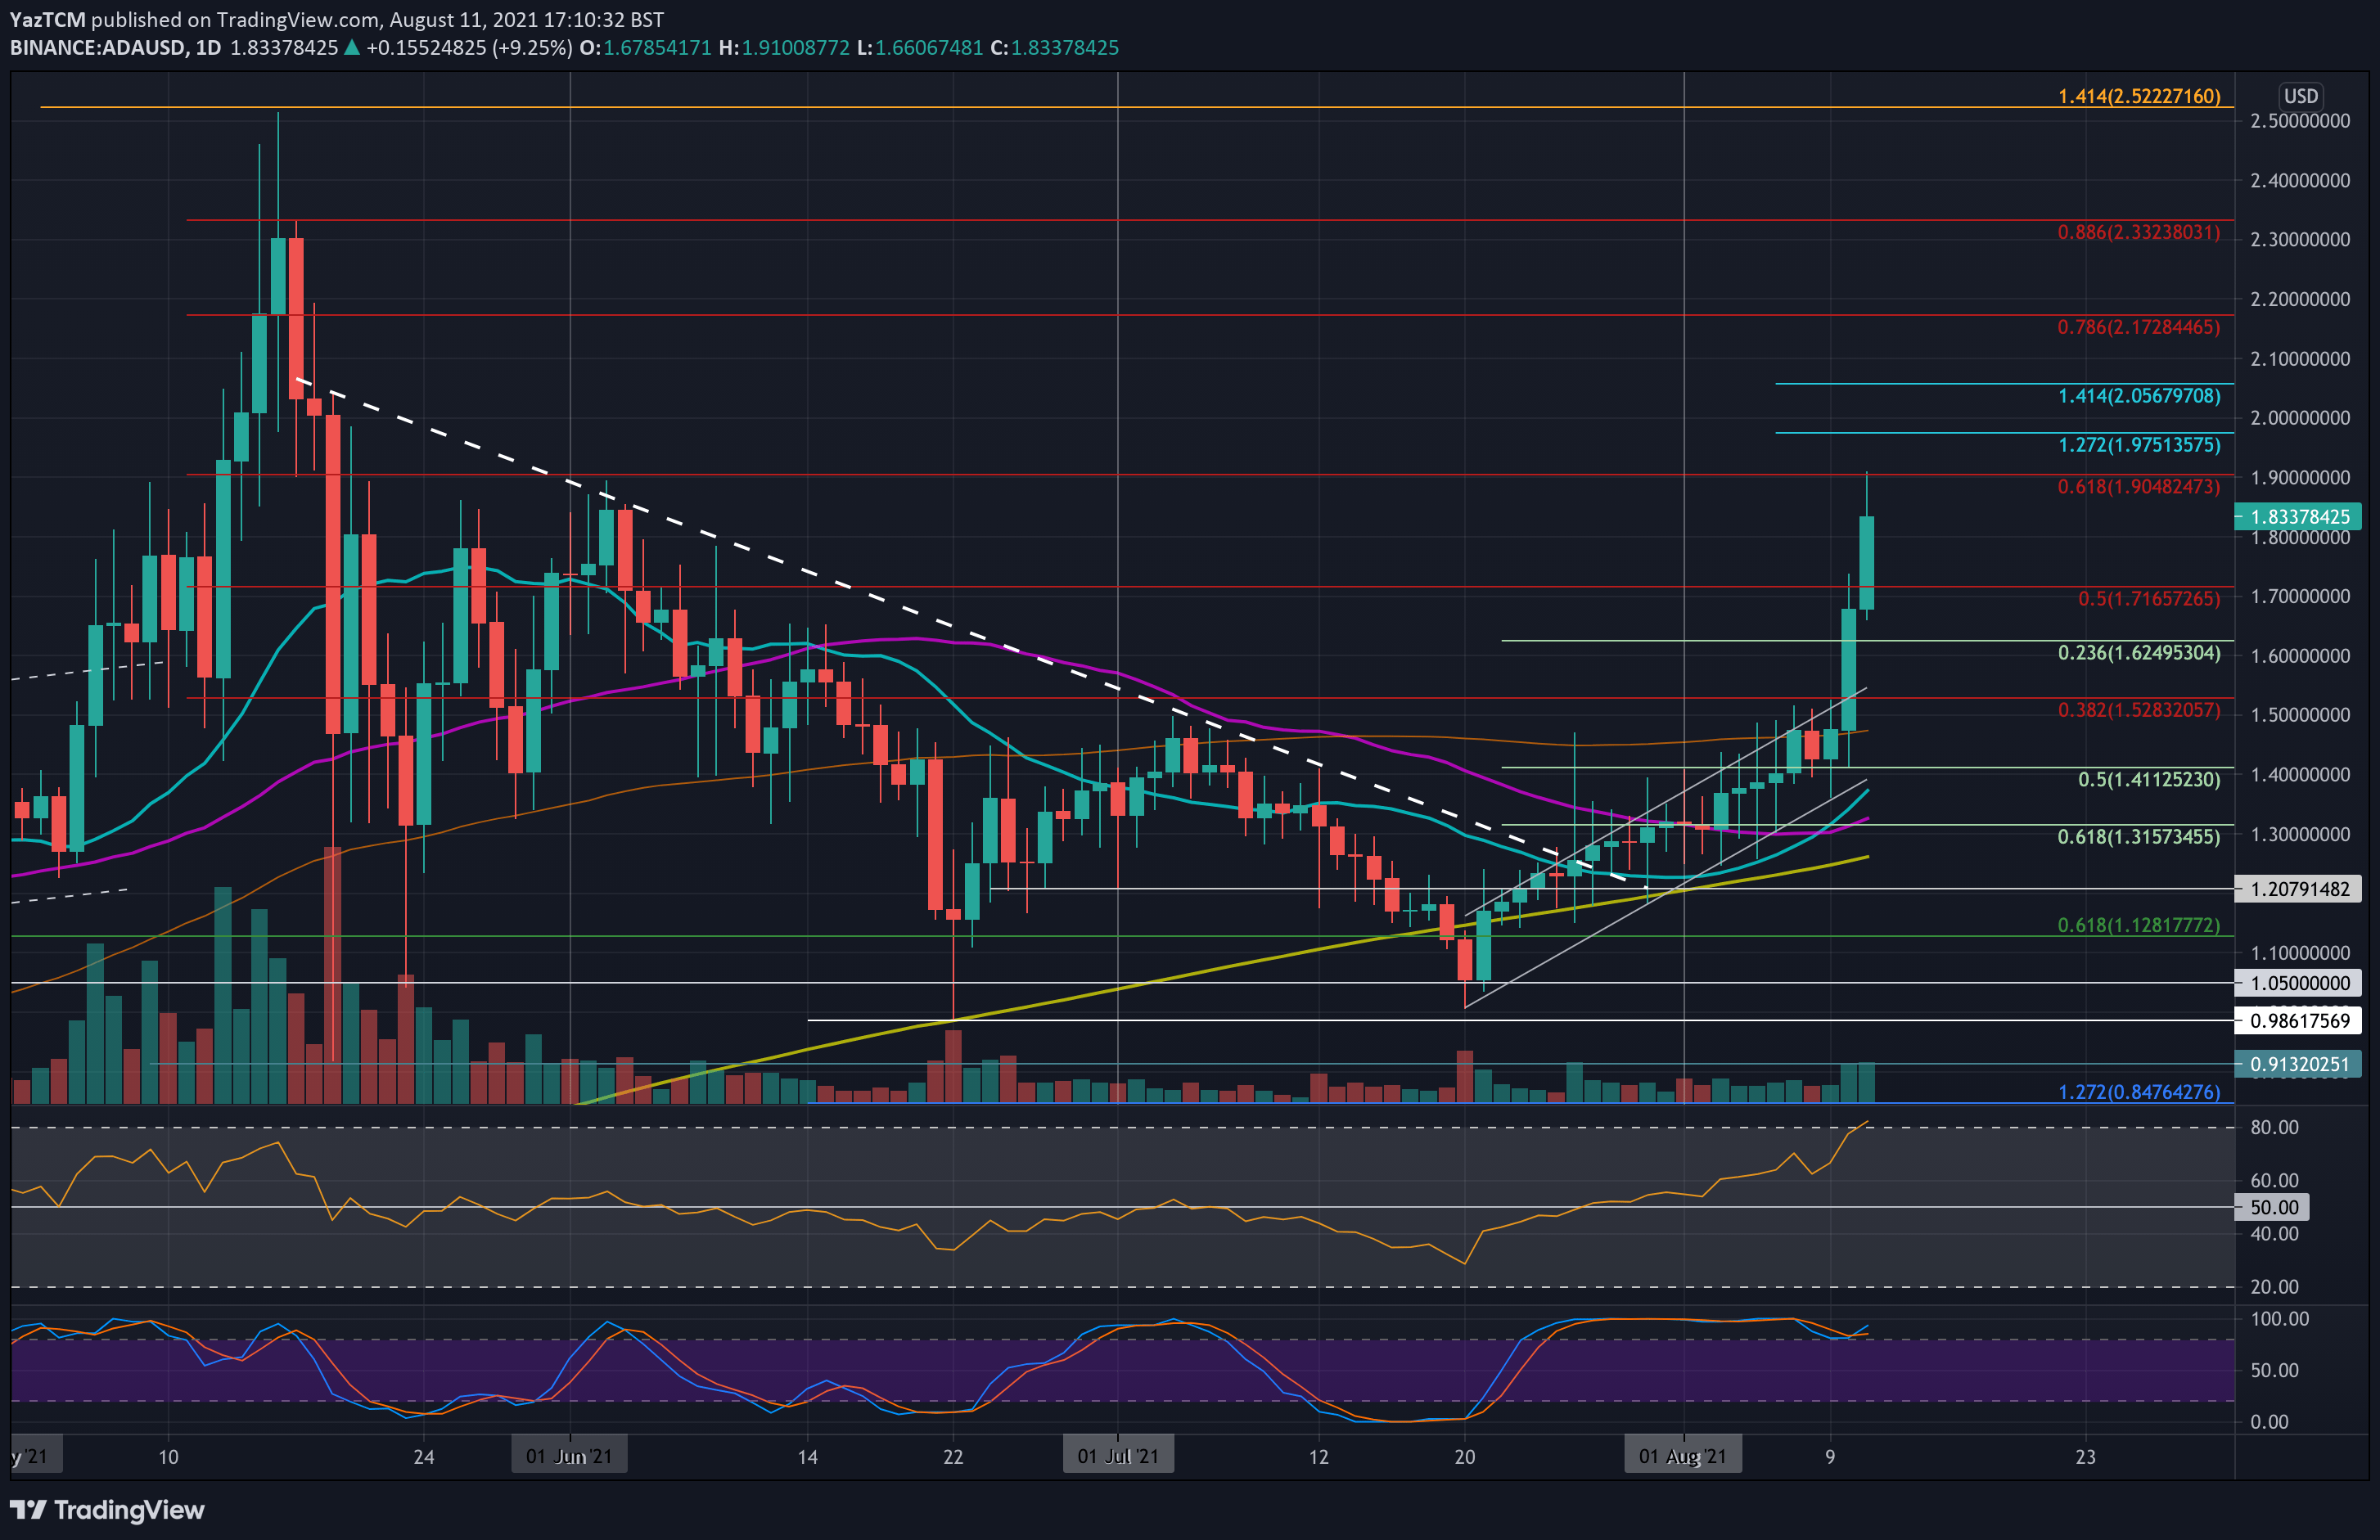
ADA/USD Daily Chart. Source: TradingView.
Key Support Levels: $1.70, $1.62, $1.50.
Key Resistance Levels: $1.90, $1.97, $2.05.
ADA surged 33% this week, which allowed it to break the upper angle of an ascending price channel it was trading inside. Before the breakout, ADA struggled to break resistance at $1.50, provided by the 100-day MA level.
The breakout came yesterday as ADA shot to resistance at $1.70. Today, it continued to break resistance at a $1.72 (bearish .5 Fib) and reach as high as $1.90, where it met resistance at a bearish .618 Fib Retracement.
This breakout is significant because it shows that the bulls are in complete control of the market and turn parabolic above the price channel.
Looking ahead, the first resistance lies at $1.90 (bearish .618 Fib & June high). This is followed by $1.97 (1.272 Fib Extension), $2.05 (1.414 Fib Extension), and $2.17 (beairsh .786 Fib).
On the other side, the first support lies at $1.70. This is followed by $1.62 (.236 Fib Retracement), $1.50 (100-day MA), and $1.414 (.5 Fib).
The RSI is in overbought conditions as the buyers dominate the market momentum. The bullish momentum is now the highest it has been since February 2021.
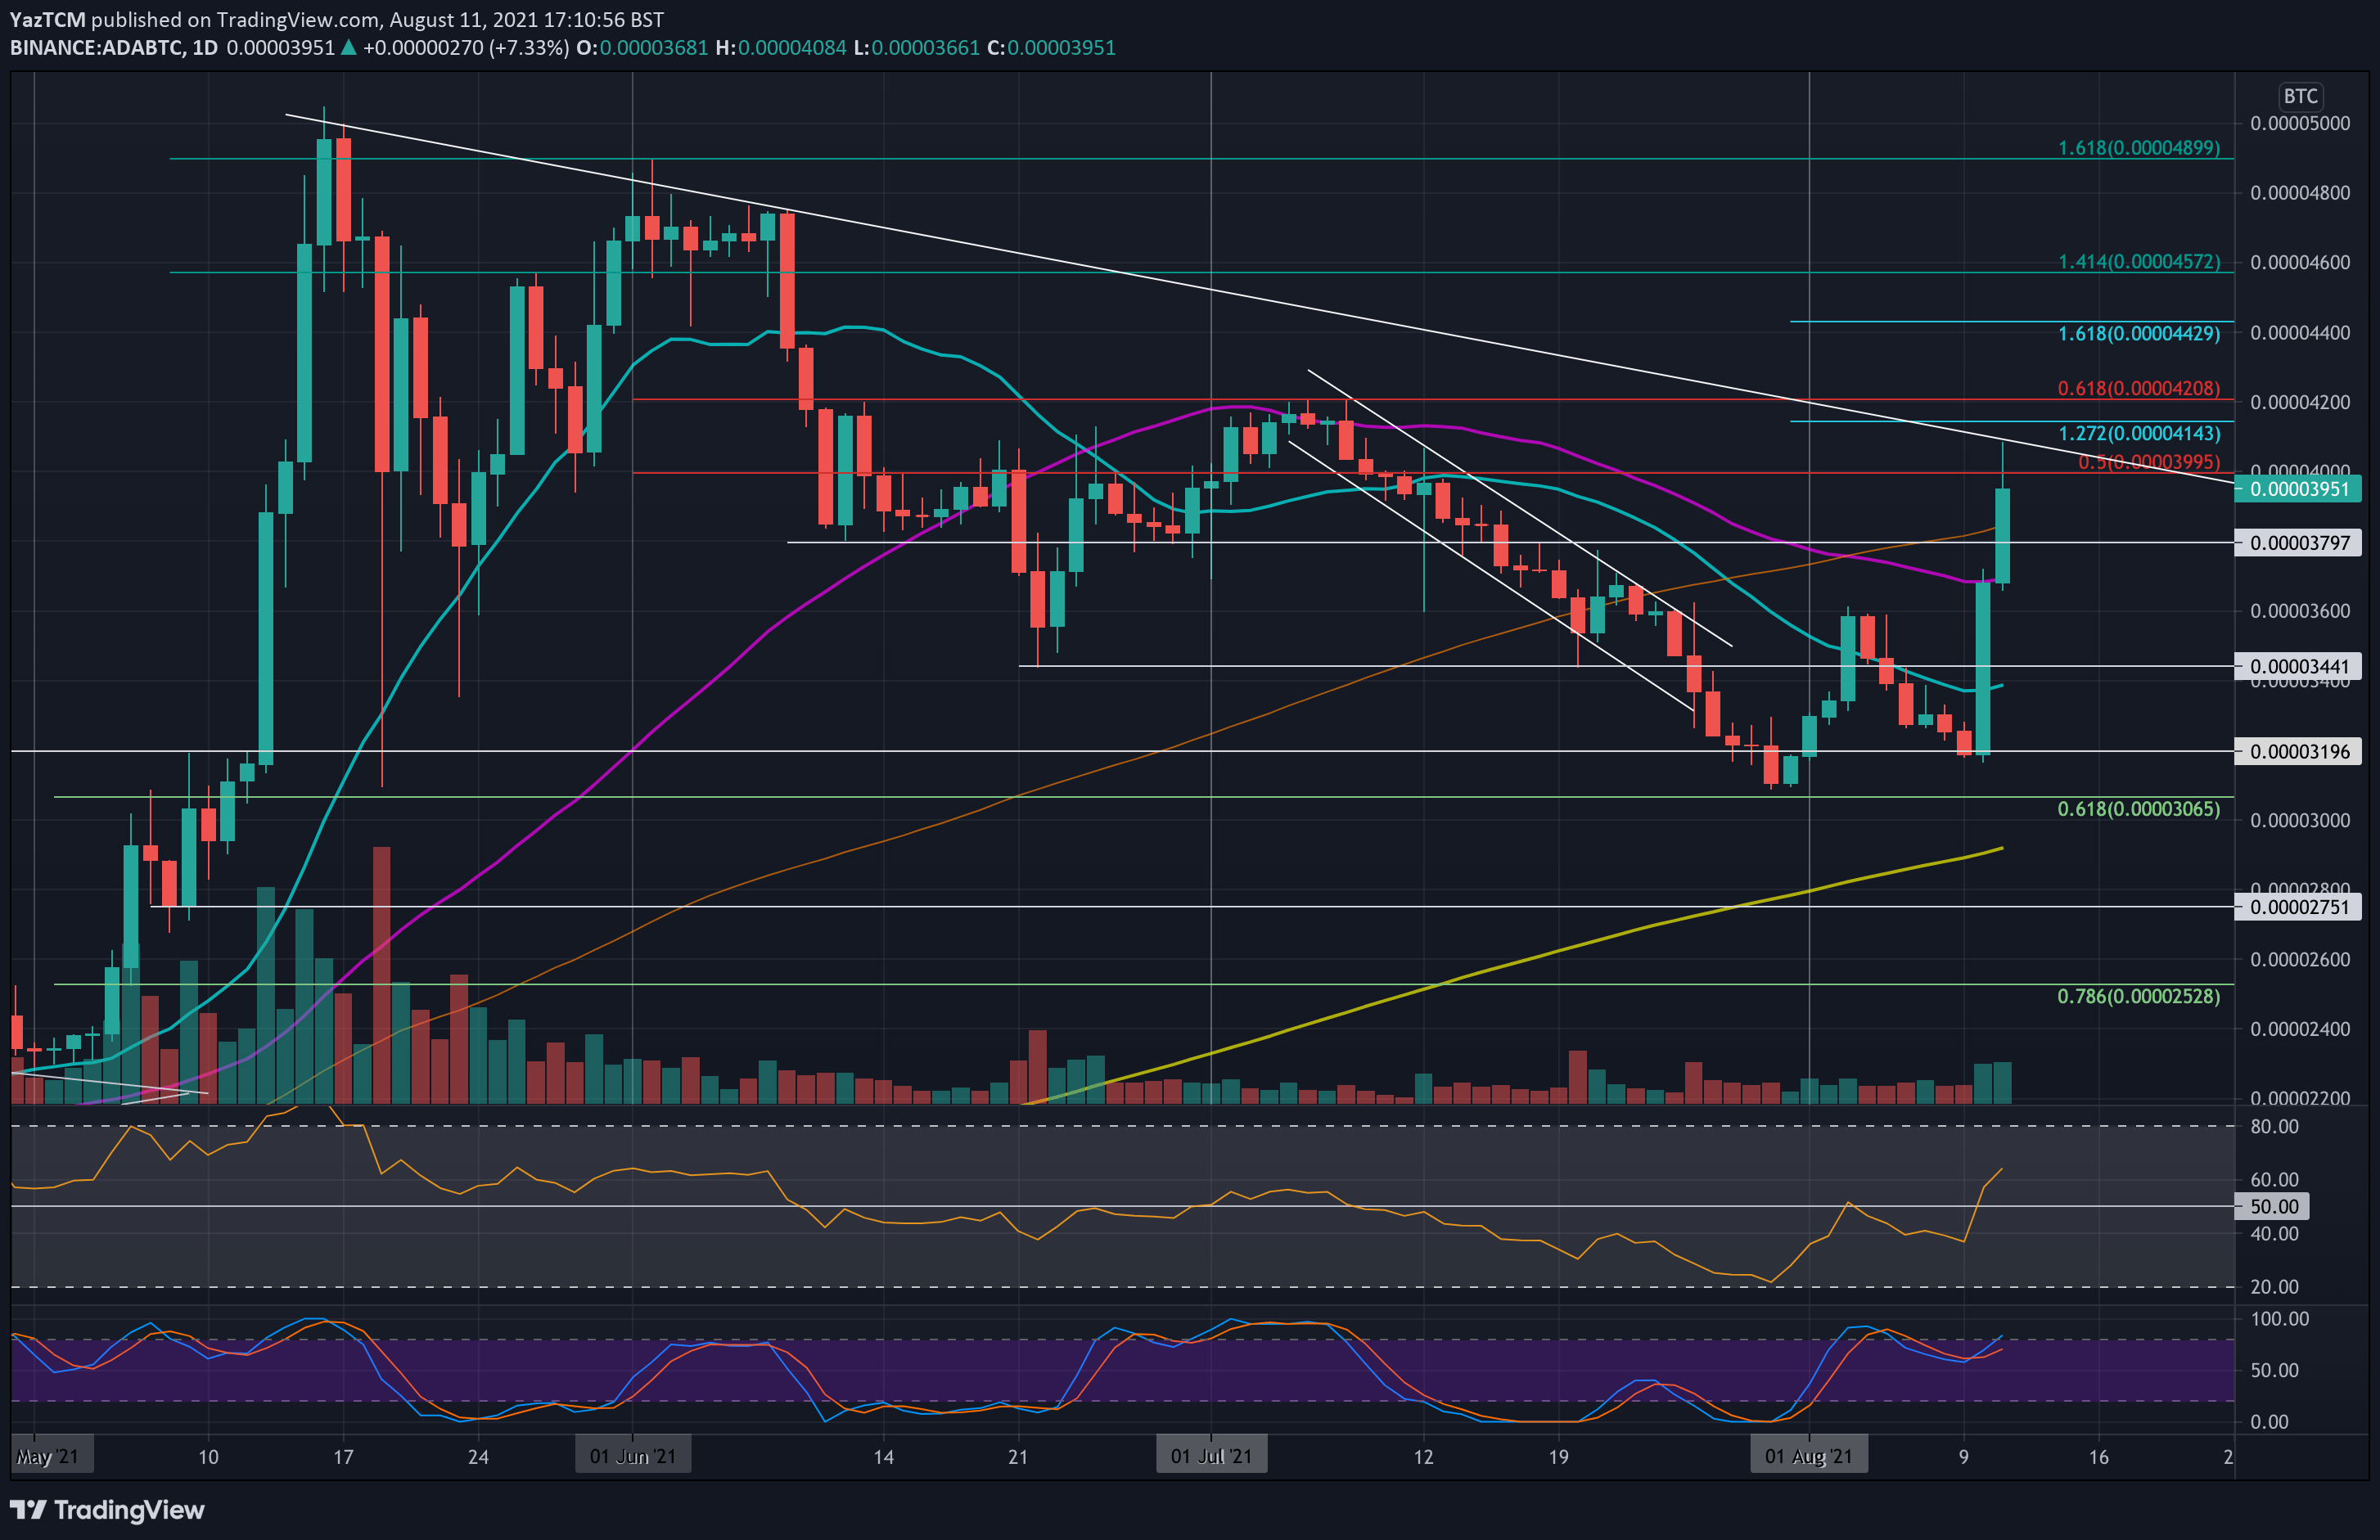
Key Support Levels: 3700 SAT, 3440 SAT, 3200 SAT.
Key Resistance Levels: 4000 SAT, 4140 SAT, 4200 SAT.
ADA struggled in the first week of August as it slipped beneath the 20-day MA and fell to 3200 SAT. Luckily, it rebounded from 3200 SAT yesterday to hit the resistance at the 50-day MA at around 3700 SAT.
Today, ADA continued beyond the 20-day MA and hit 4100 SAT to climb above the 100-day MA level and hit resistance at a long-term descending trend line. It has since dropped from the trend line as it sits around 3950 SAT.
ADA would still need to break the July high around 4200 SAT to turn bullish.
Moving forward, the first resistance lies at 4000 SAT (bearish .5 Fib). This is followed by 4140 SAT (1.272 Fib Extension & falling trend line), 4200 SAT (bearish .618 Fib), and 4430 SAT (1.618 Fib Extension).
On the other side, the first support lies at 3700 SAT (50-day MA). This is followed by 3440 SAT (20-day MA), 3200 SAT (weekly support), and 3000 SAT.
The RSI recently climbed above the midline as the buyers take control of the market momentum for the first time since early July.