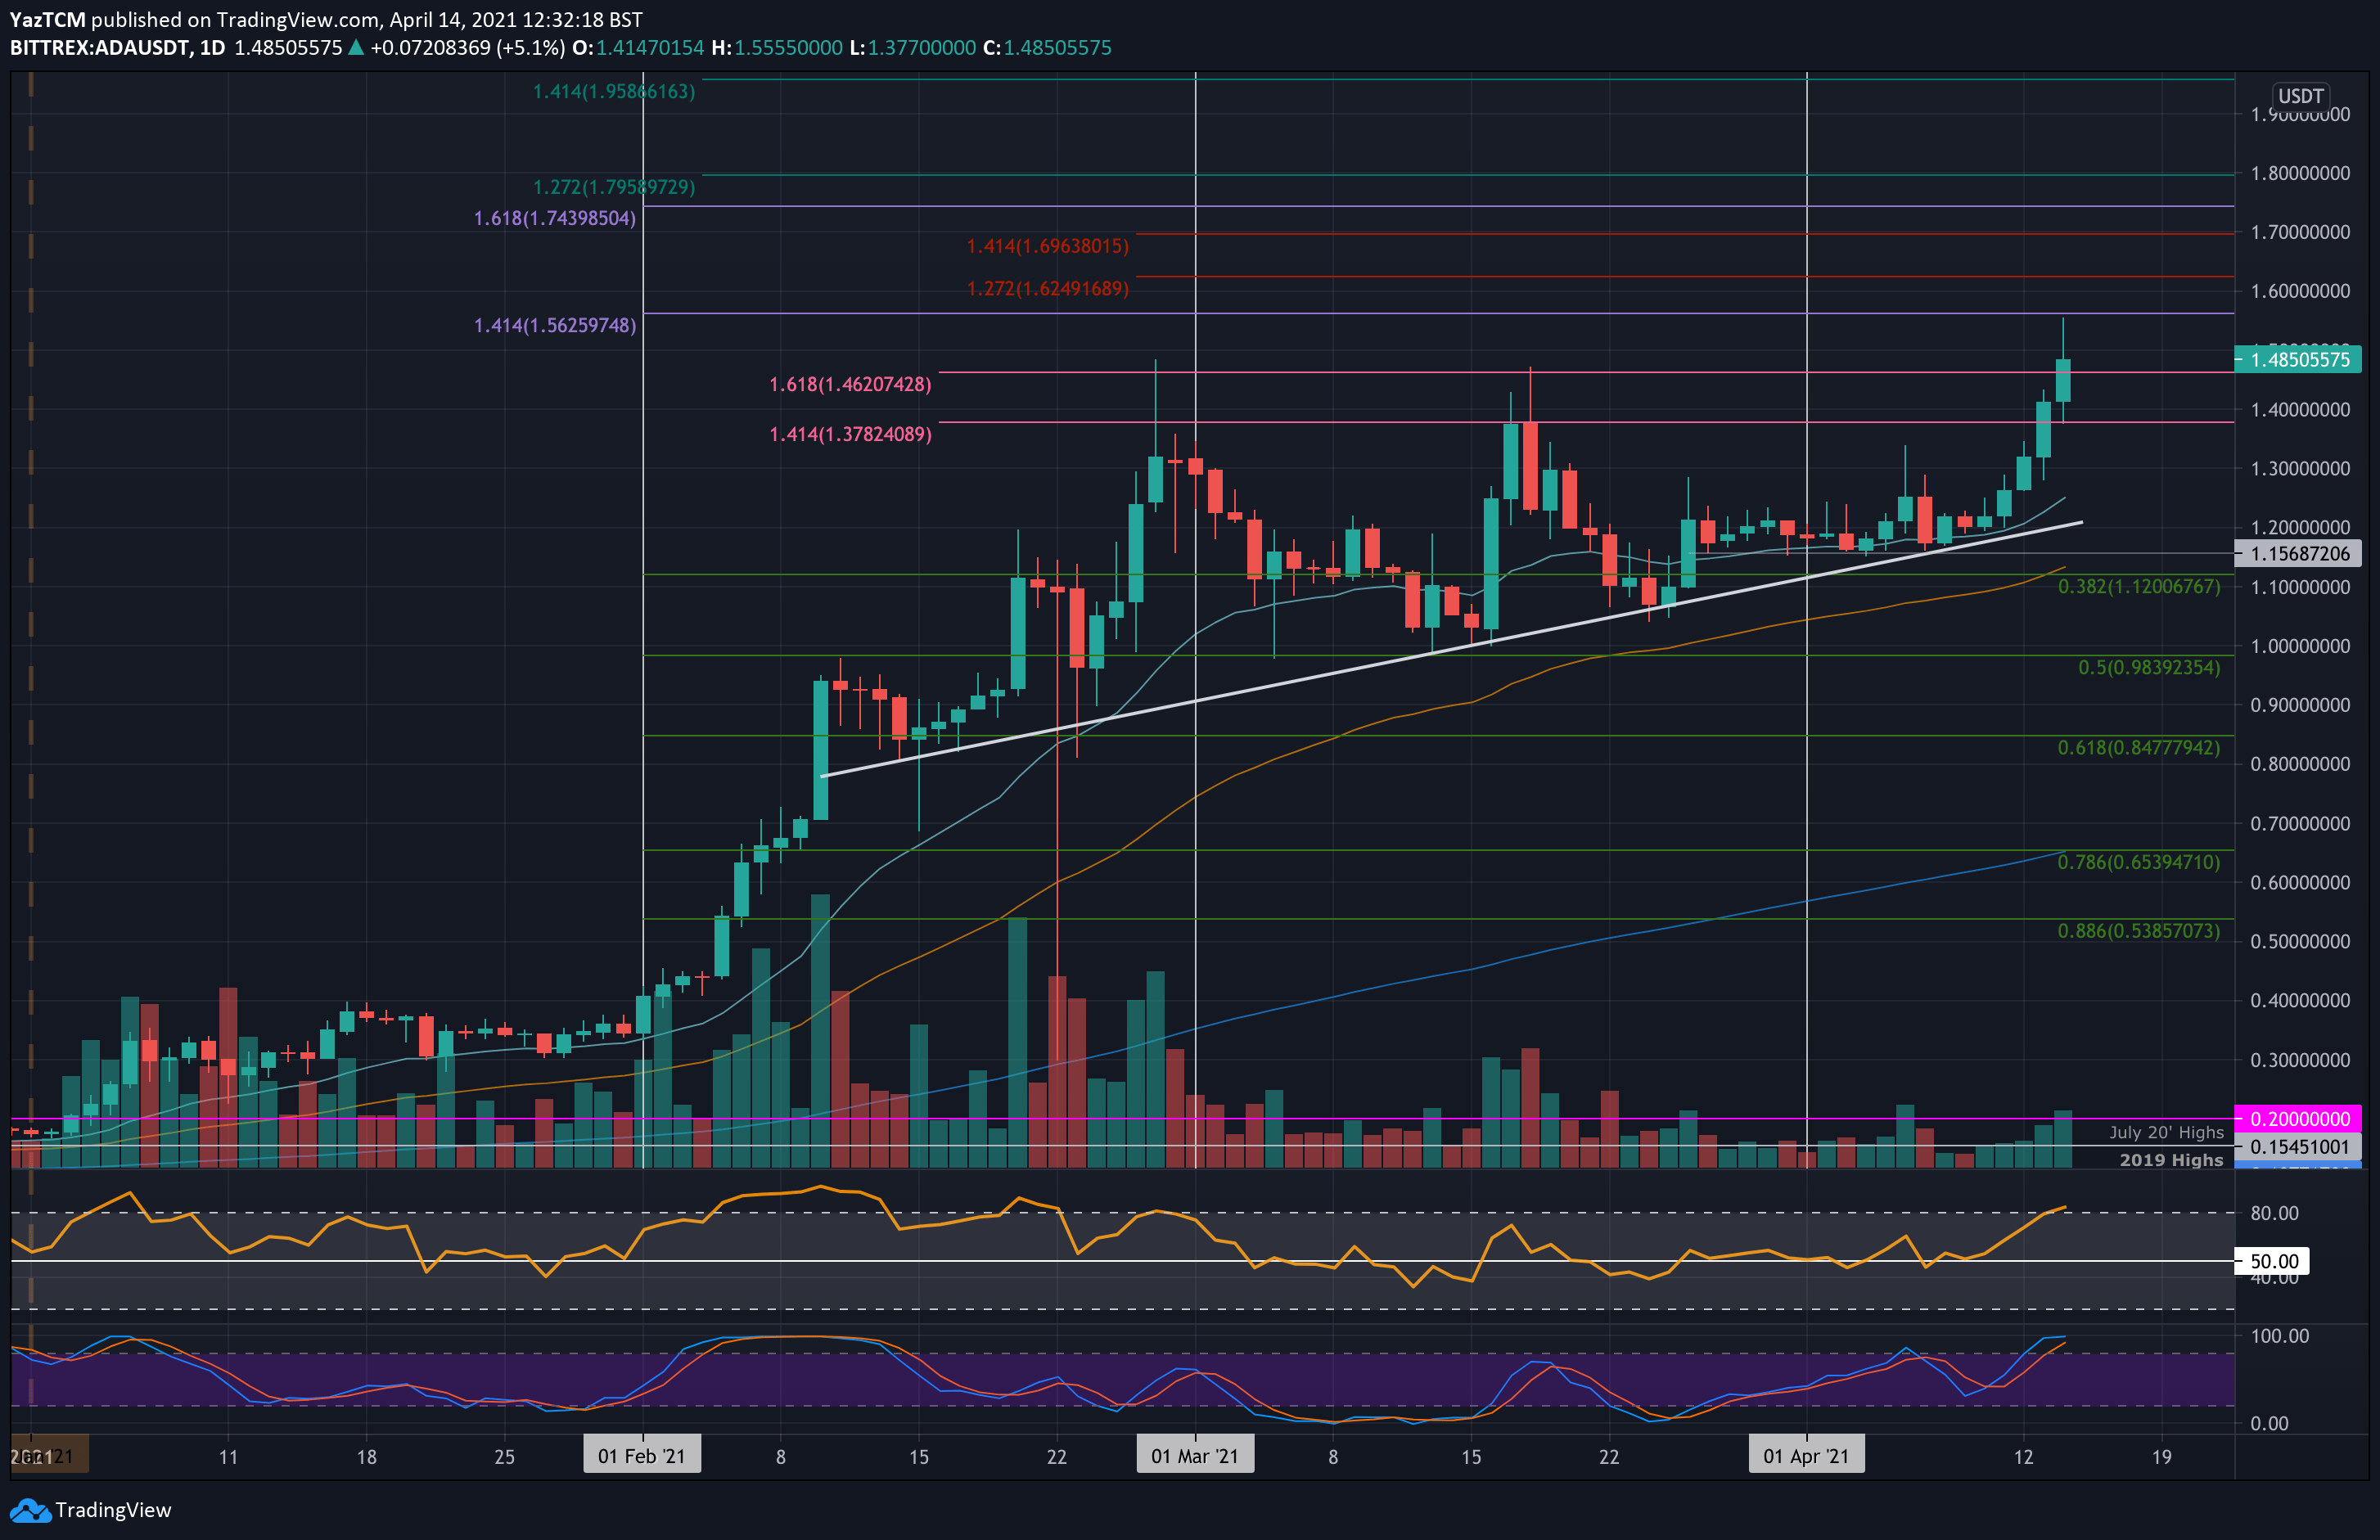
ADA/USD Daily Chart. Source: TradingView
Key Support Levels: $1.37, $1.20, $1.15.
Key Resistance Levels: $1.56, $1.62, $1.69.
Cardano saw a strong 17% price surge this week, allowing the cryptocurrency to finally break $1.50 and set a new ATH at $1.56.
Before this price move, ADA struggled to close a daily candle above $1.37 (1.414 Fib Extension). It had reversed from $1.37 toward mid-March and dropped until support was found at an ascending trend line.
In the first few days of April, ADA established strong support at $1.15 as it started to push higher again. The resistance at $1.37 was not penetrated until yesterday as ADA surged to $1.40. Today, it continued above $1.40 to reach as high as $1.56, where it met resistance at $1.56 (1.414 Fib Extension – purple).
Looking ahead, the first resistance lies at $1.56. Above this comes $1.62 (short-term 1.272 Fib Extension), $1.69 (short term 1.414 Fib Extension), and $1.74 (1.618 Fib Extension – purple). Added resistance lies at $1.80 and $1.95.
On the other side, the first support lies at $1.37. This is followed by $1.20, $1.15 (.382 Fib), and $1.00.
The RSI has reached overbought conditions, but there is still space to push higher before becoming extremely overbought. This suggests that the market can be expected to still make higher highs before stalling again.
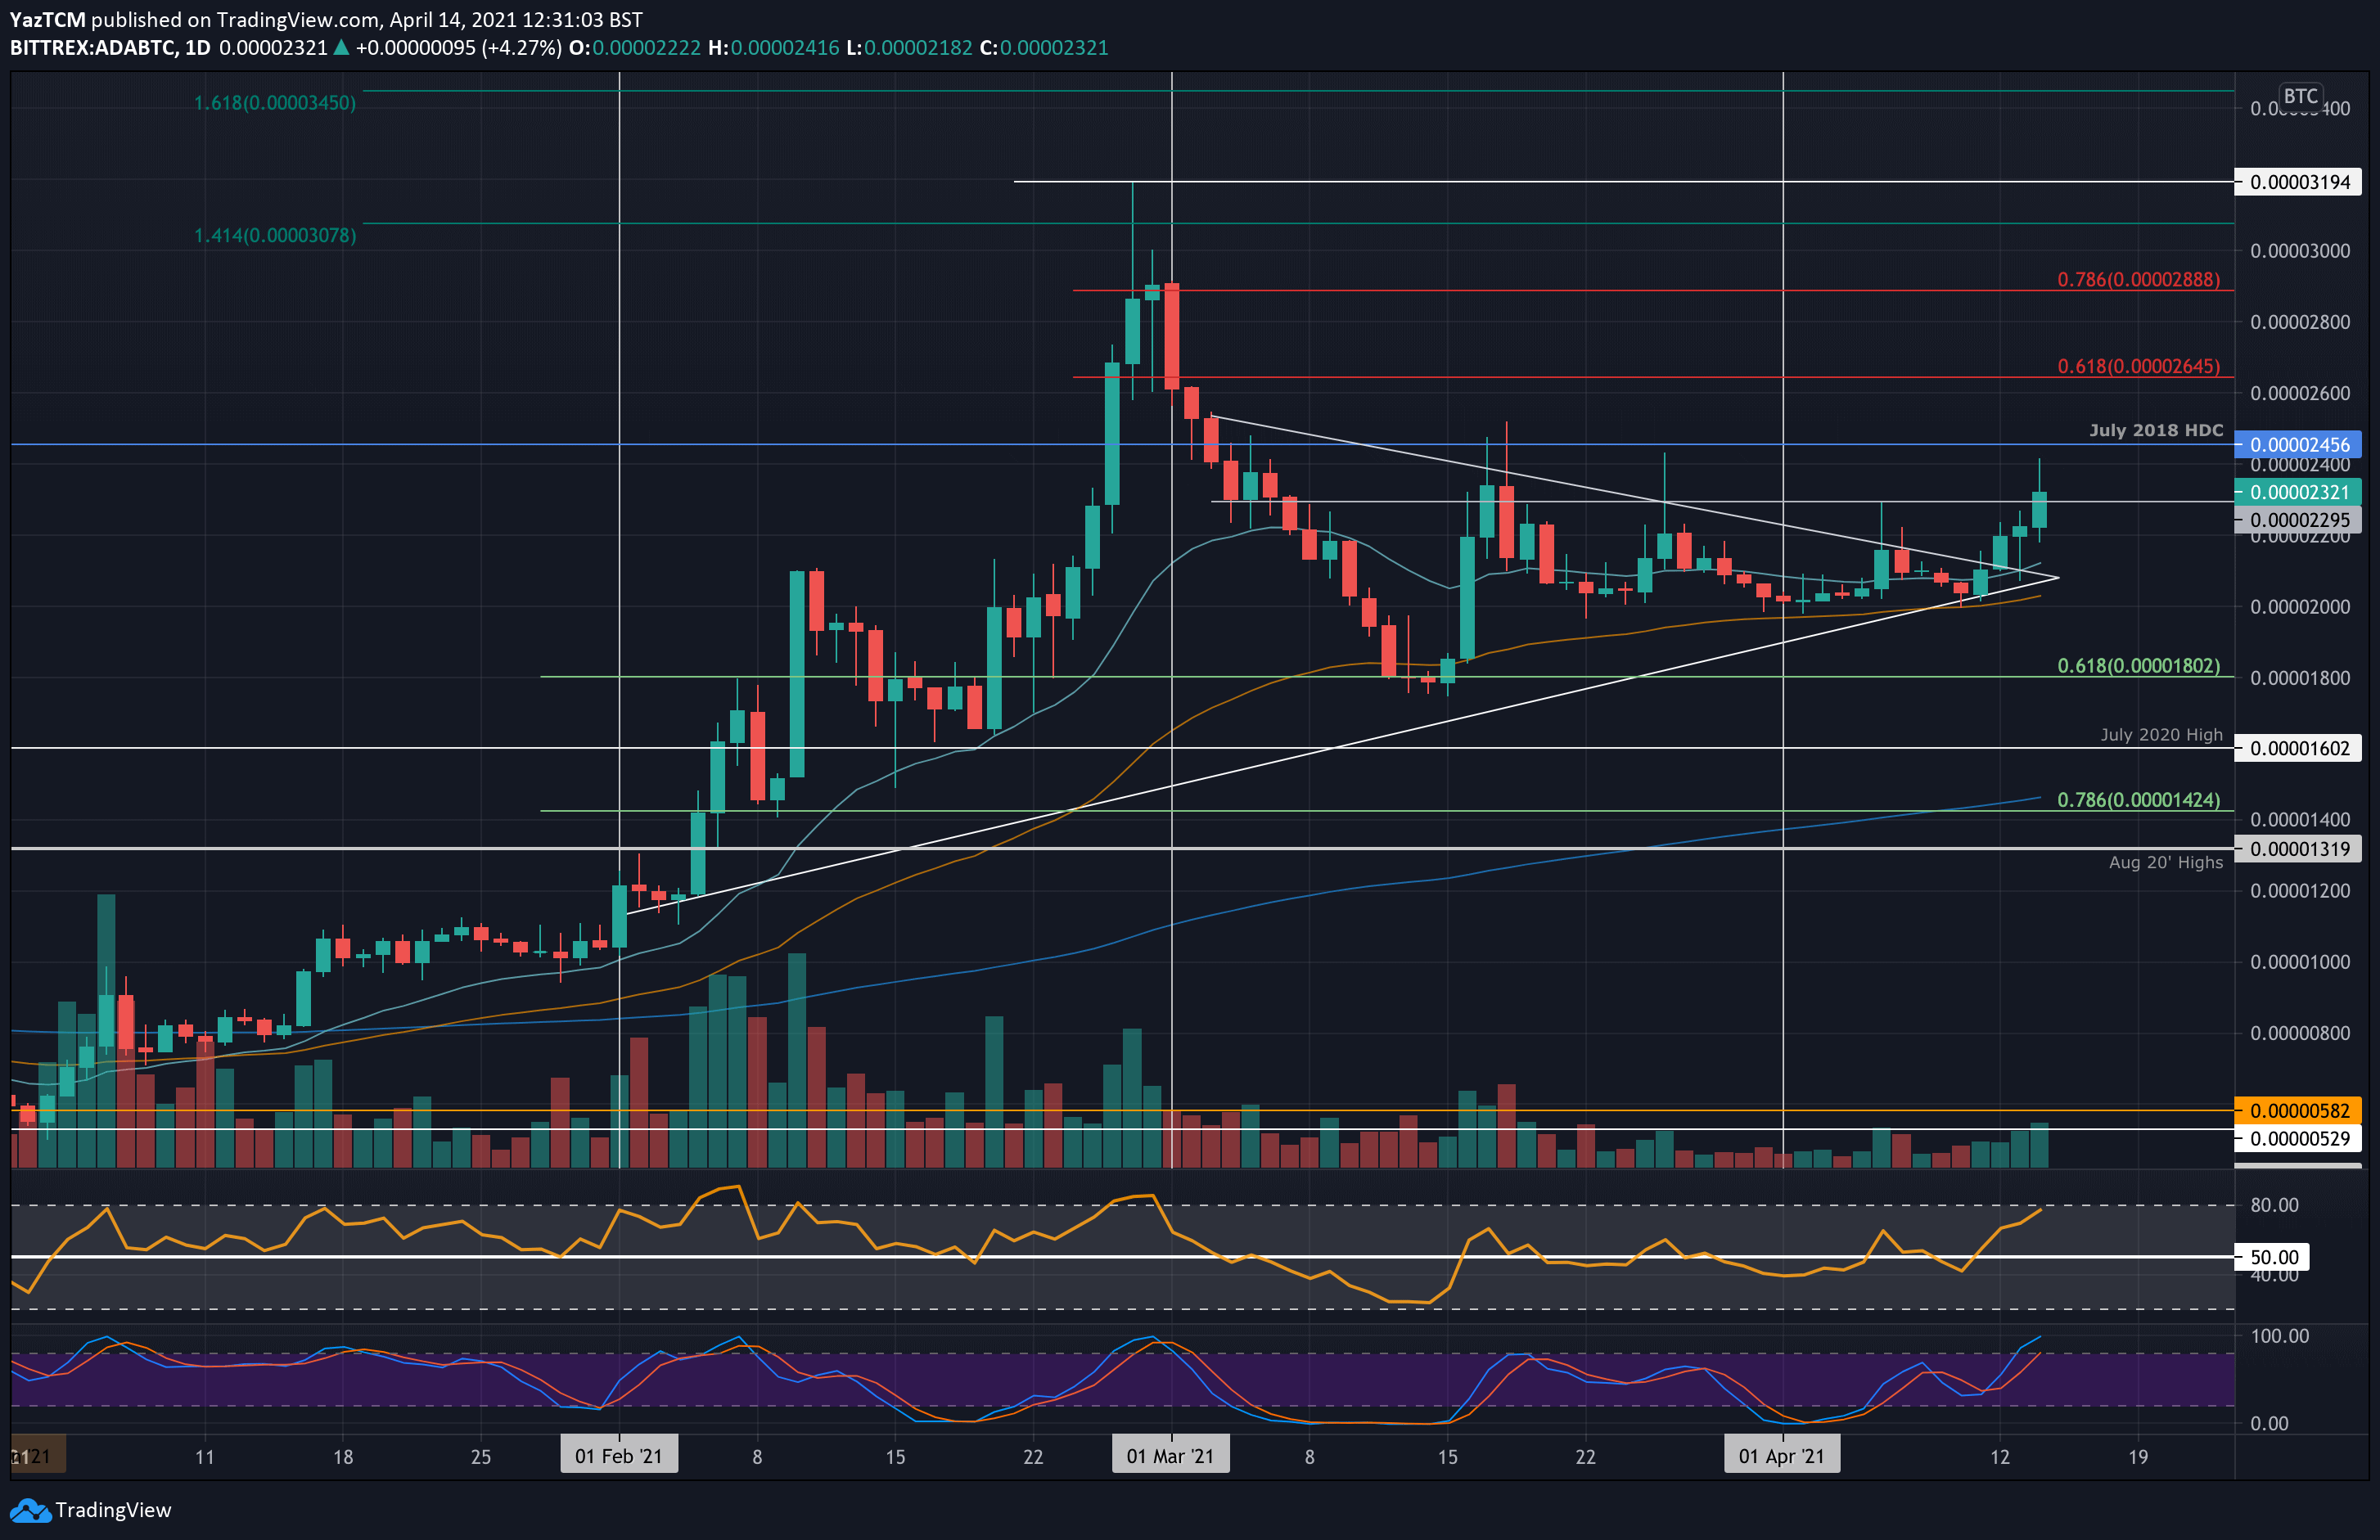
Key Support Levels: 2200 SAT, 2000 SAT, 1800 SAT.
Key Resistance Levels: 2456 SAT, 2645 SAT, 2800 SAT.
Against Bitcoin, ADA was trading inside a symmetrical triangle pattern since the start of March. It made three attempts to break above the triangle during March and a further two tries to penetrate it in the first few days of April – all of them failed.
The breakout did not occur until Monday after ADA bounced from the lower boundary of the triangle on Sunday and pushed above it on Monday to reach 2200 SAT. The coin continued higher over the past couple of days to break 2300 SAT and reach as high as 2400 SAT today.
The breakout toward the upside is the first signal that the market is ready to go on another bull run moving forward.
Looking ahead, the first strong resistance lies at 2456 SAT (July 2018 High-day Closing price). This is followed by 2645 SAT (bearish .618 Fib), 2800 SAT, and 2888 SAT (bearish .786 Fib).
On the other side, the first support lies at 2200 SAT. This is followed by 2000 SAT (50-day EMA), 1800 SAT (.618 Fib), and 1600 SAT (July 2020 High).
The RSI has not quite hit overbought conditions here but is firmly on the side of the bulls. It still has room to continue higher before becoming extremely overbought.