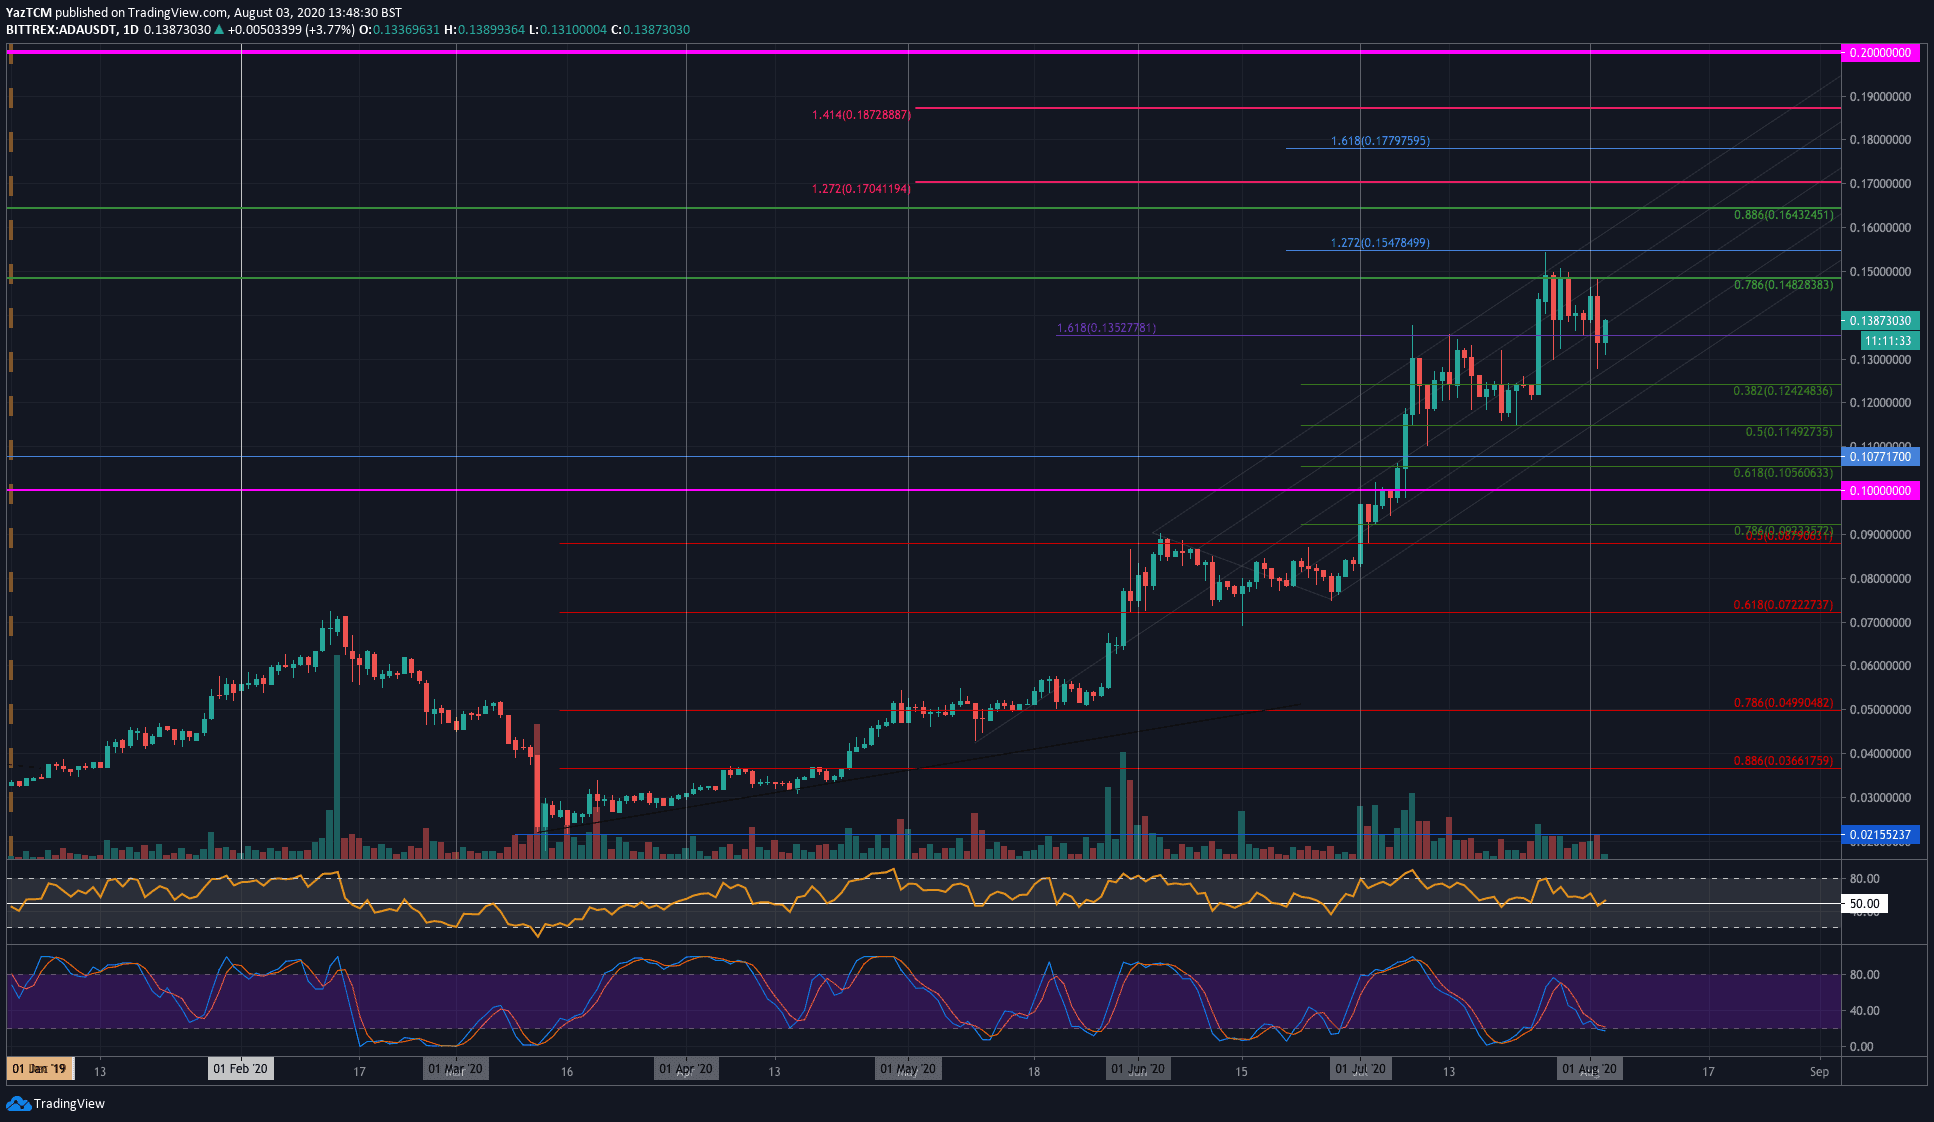
Key Support Levels: $0.13, $0.124, $0.12.
Key Resistance Levels: $0.148, $0.15, $0.155.
Cardano has been surging over the past three months as it increased by a whopping 180%. This price hike allowed Cardano to reach the number 6th ranked position as it holds a $4.36 billion market cap.
The coin started to trade at $0.09 in July. Throughout the month, ADA pushed higher to reach $0.15 by the end of July and mark a 2-year high. It was unable to overcome this resistance, which made it roll over and drop as low as $0.13 this weekend.
Yesterday, ADA did attempt to break the resistance at $0.148 (bearish .786 Fib Retracement), but the volatility (provided by Bitcoin) proved to be too strong as the coin dropped to $0.13. It has since rebounded as it trades at $0.138.
The last thing to point out is the fact that Cardano has also been trading within a pitchfork formation over these past two months. This provides fantastic areas of support and resistance when the market is trending like Cardano.
Looking ahead, if the buyers push higher, the first level of resistance to overcome lies at $0.148 (bearish .786 Fib Retracement). If the bulls continue above $0.15, resistance lies at $0.155 (1.272 Fib Extension), $0.16, and $0.164 (bearish .886 Fib Retracement).
On the other side, the first level of support lies at $0.13. Beneath this, added support is found at $0.124 (.382 Fib Retracement), $0.12, and $0.115 (.5 Fib Retracement).
The RSI recently rebounded from the 50 line after falling from overbought conditions. This shows that the buyers are unwilling to give up their control of the market momentum and have taken enough of a break to recover. Additionally, the Stochastic RSI is primed for a bullish crossover signal that should send the market higher.
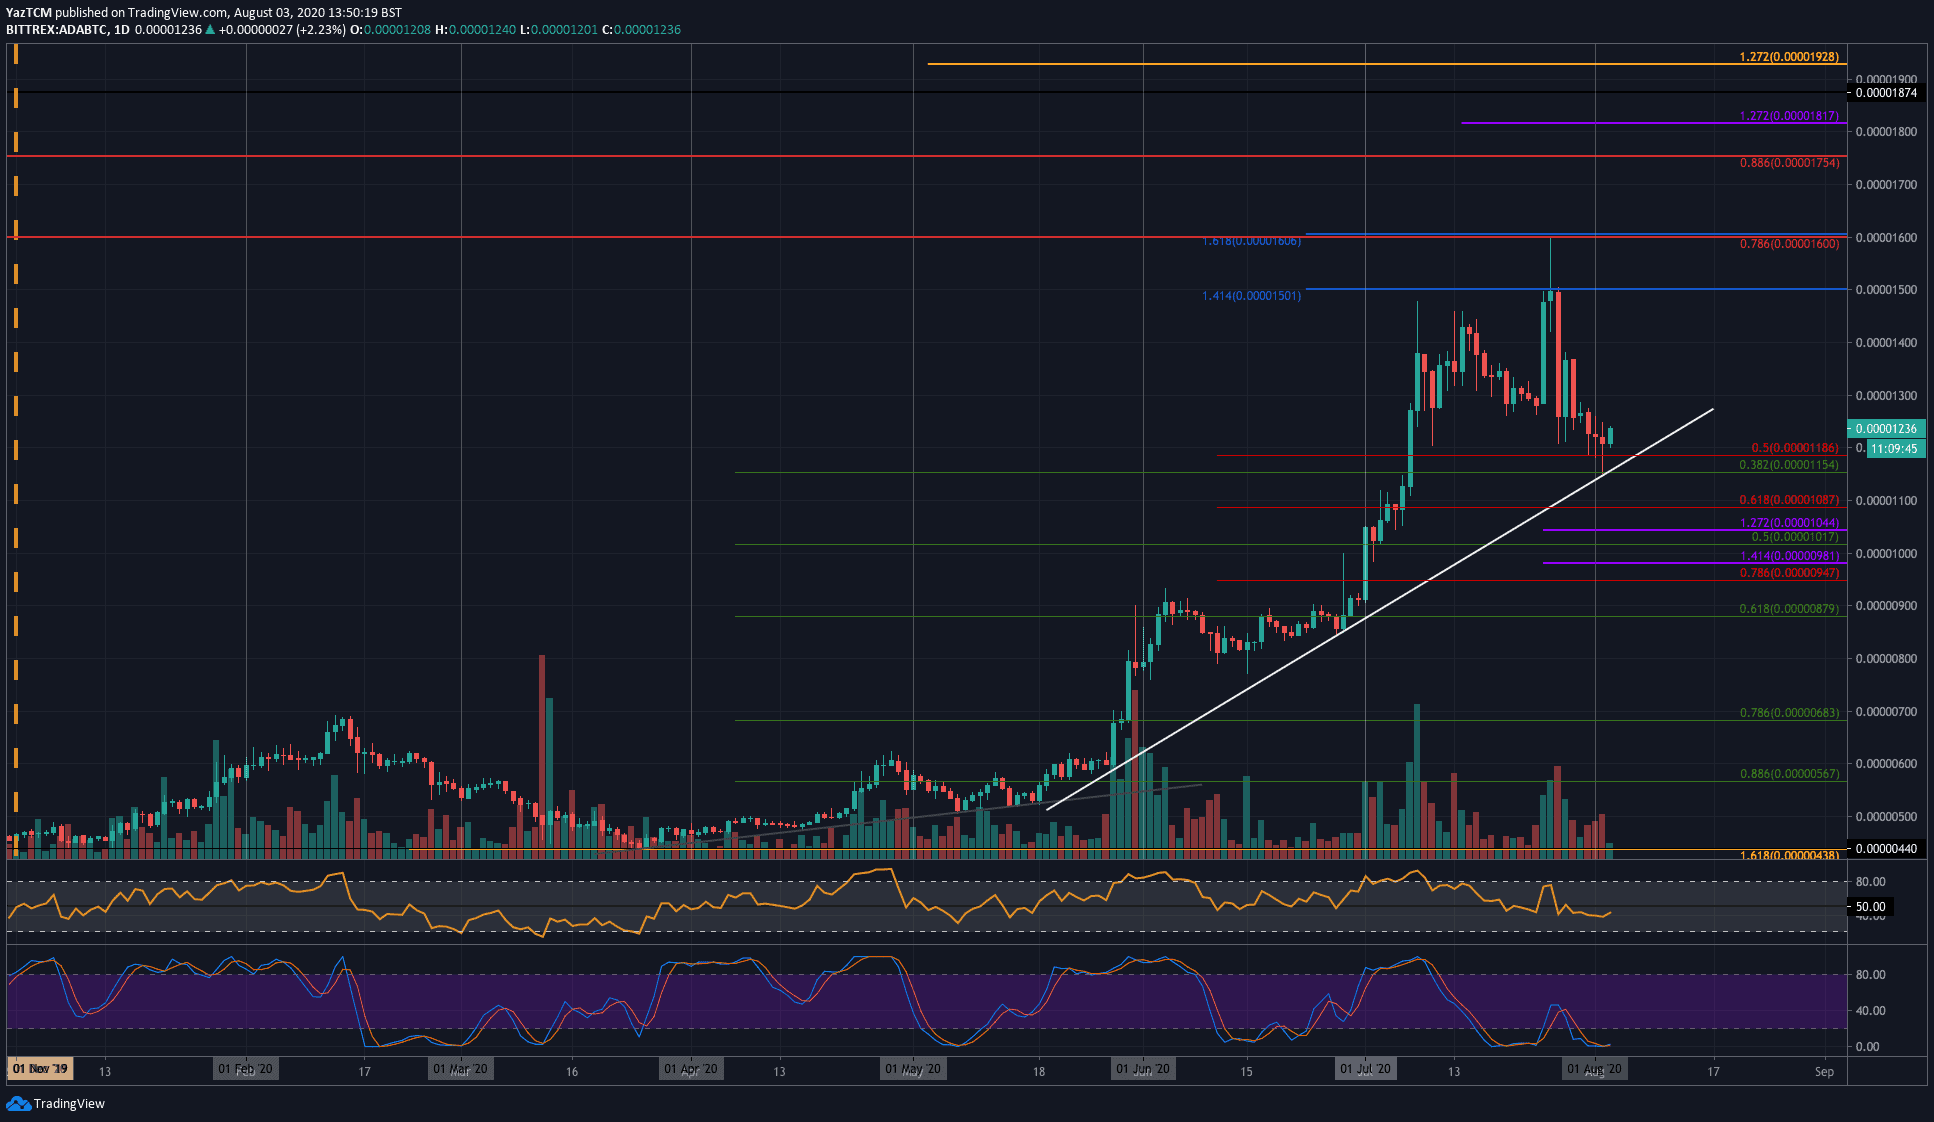
Key Support Levels: 1154 SAT, 1100 SAT, 1017 SAT.
Key Resistance Levels: 1300 SAT, 1400 SAT, 1500 SAT.
Cardano has been performing very well against Bitcoin over the previous months. It started July at around 900 SAT as it began to push aggressively higher. Toward the end of the month, ADA had reached as high as 1600 SAT (bearish .786 Fib Retracement). More specifically, ADA was unable to break the resistance at 1500 SAT (1.414 Fib Extension).
The coin rolled over from here and started to fall until support was found at the rising support line yesterday. The support here is further bolstered by the .382 Fib Retracement level at 1154 SAT. ADA rebounded from here today as it trades at 1235 SAT.
Moving forward, if the buyers start to push higher again, resistance is expected at 1300 SAT, 1400 SAT, and 1500 SAT (1.414 Fib Extension). This is followed by resistance at 1600 SAT (bearish .786 Fib Retracement) and 1754 SAT (bearish .886 Fib Retracement).
On the other side, support lies at 1154 SAT (.382 Fib Retracement). Beneath the trend line, added support is found at 1100 SAT, 1017 SAT (.5 Fib Retracement), and 950 SAT.
The RSI is beneath the 50 line in this market, which shows the bears are in control of the momentum. For a push higher, ADA must break above the 50 line to indicate bullish momentum.