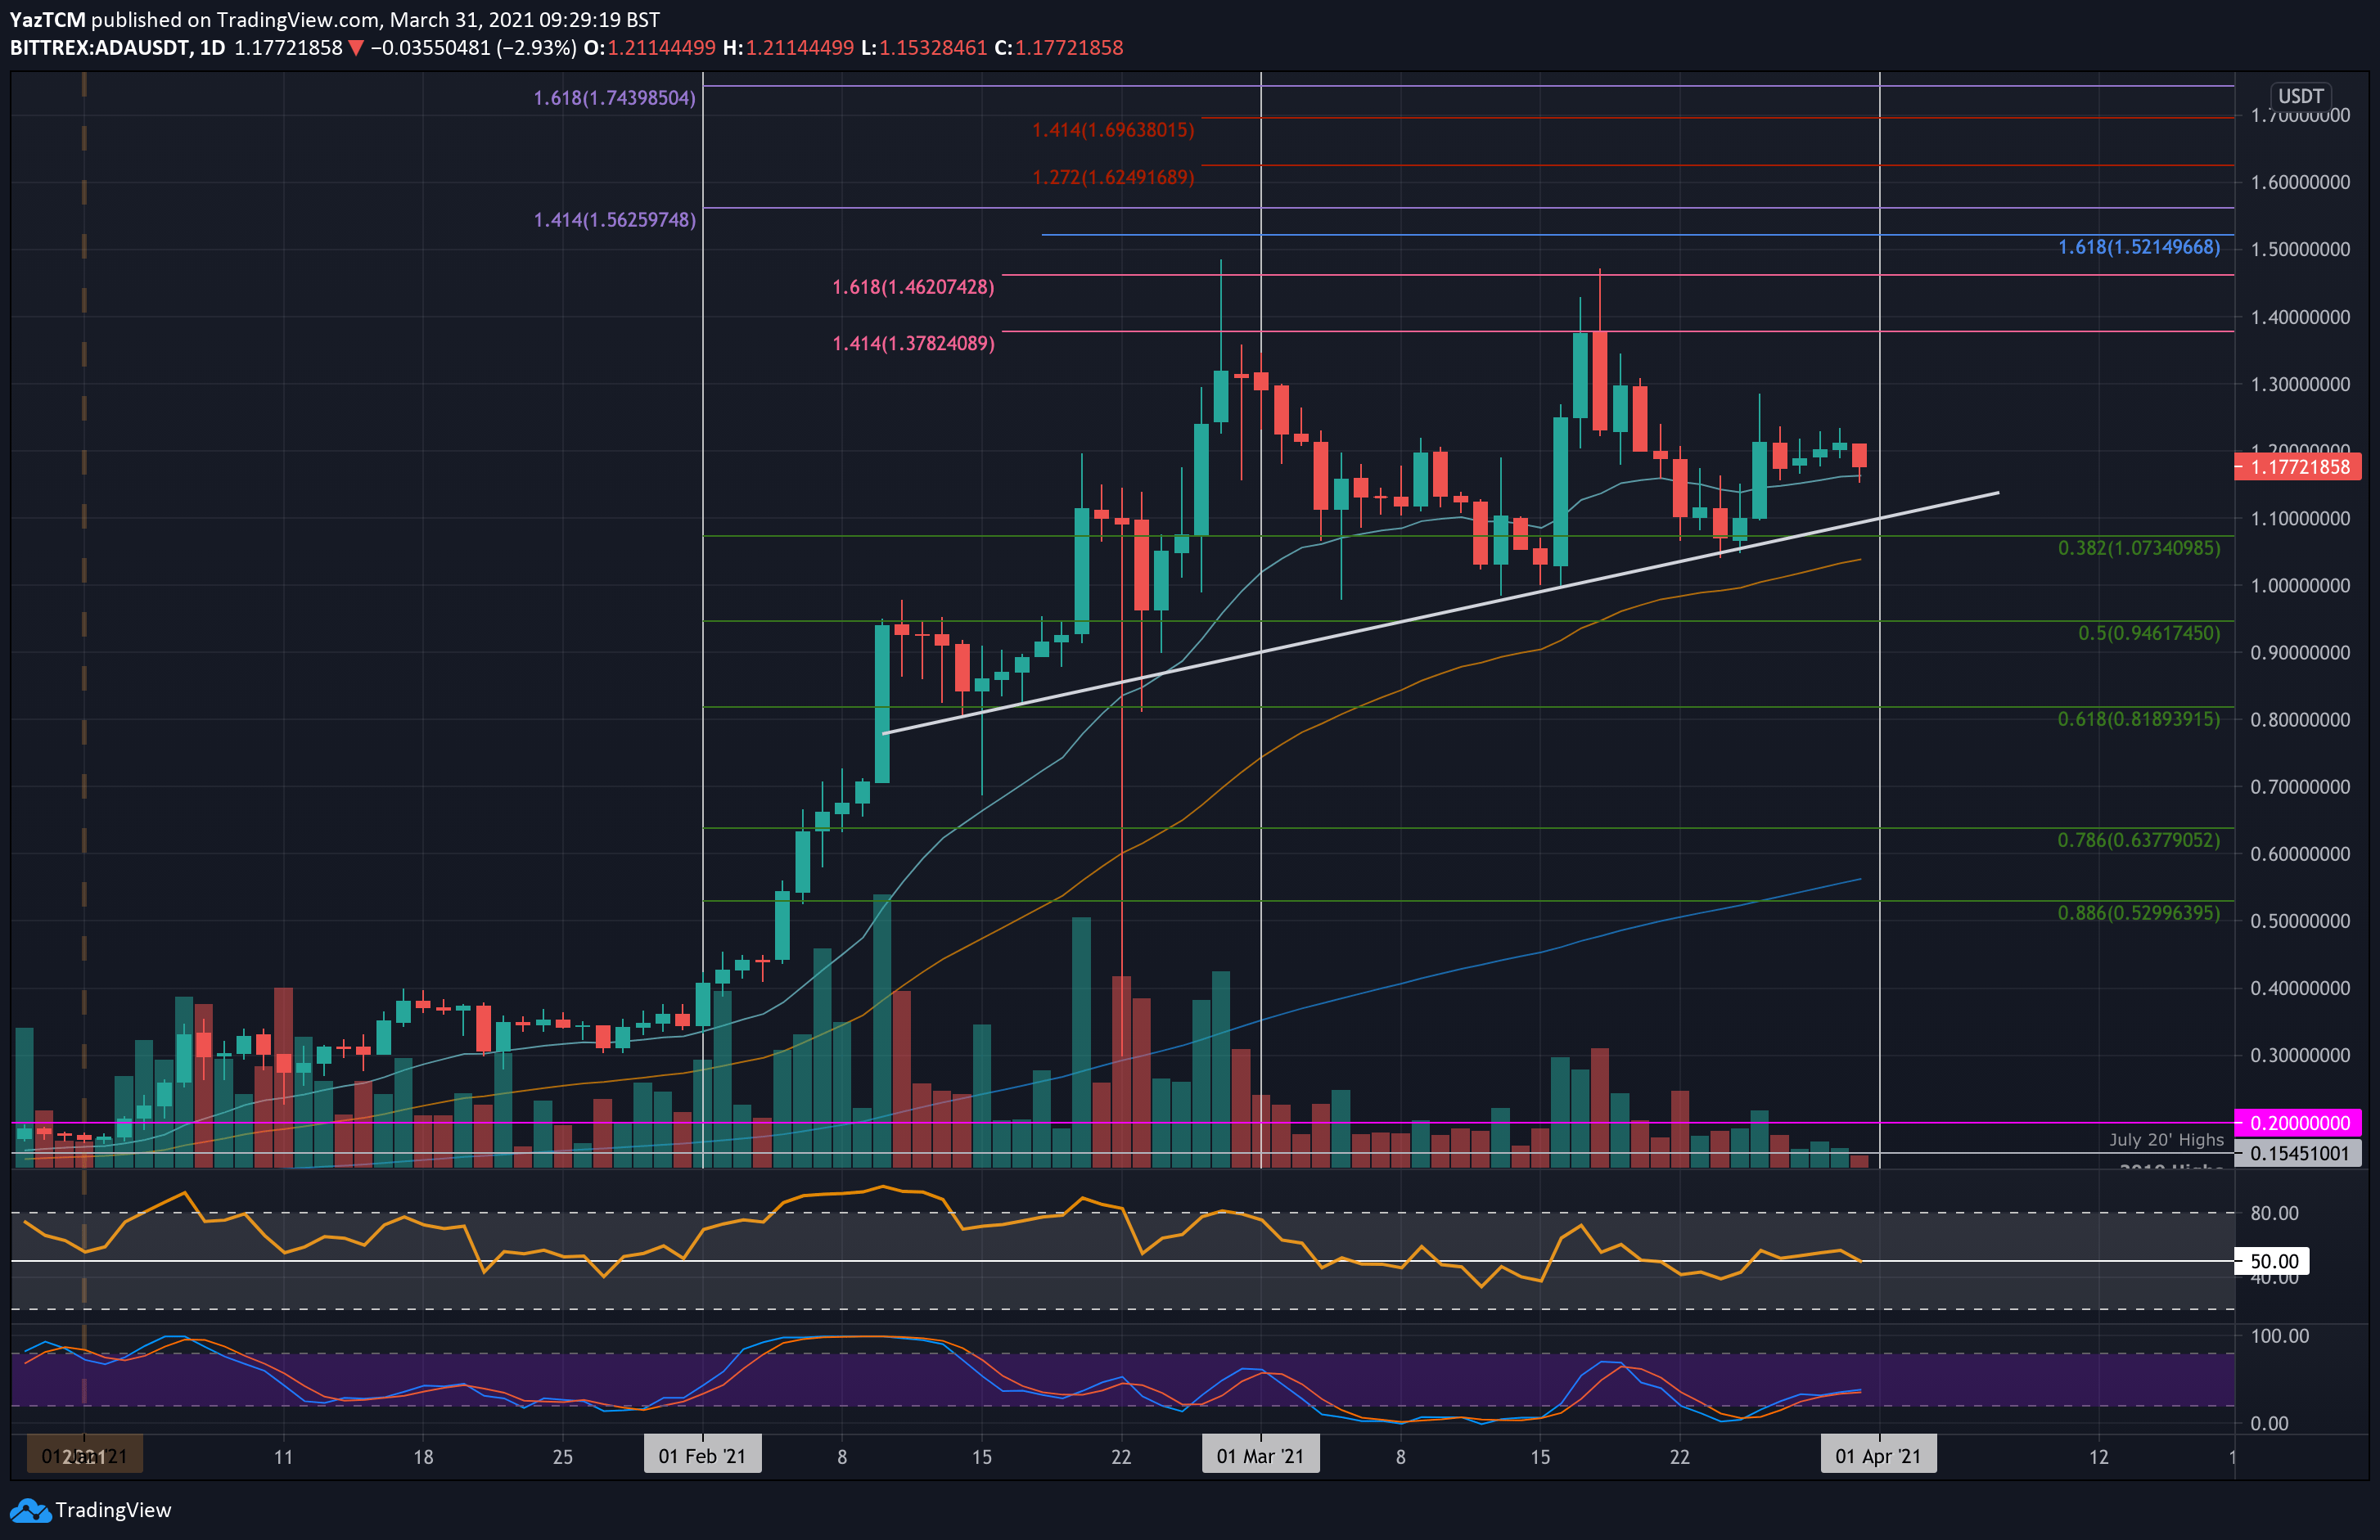
ADA/USD Daily Chart. Source: https://www.tradingview.com/x/oVLltrT5/
Key Support Levels: $1.10, $1.00, $0.95.
Key Resistance Levels: $1.20, $1.30, $1.37.
ADA dropped by a total of 3% today as the cryptocurrency continues to fall short at $1.20. It had bounced from support around $1.07 (.382 Fib) last week but struggled to close a daily candle above the $1.20 resistance since rebounding.
ADA has now been rangebound between $1.37 and $1.00 for the entire period of March 2021, and a breakout of one of these two boundaries will be the next indicator as to which direction it would head toward next.
Looking ahead, the first level of support lies at $1.10, which is provided by a 2-month rising trend line. This is followed by $1.00 (50-day EMA), $0.95 (.5 Fib), and $0.90.
On the other side, the first resistance lies at $1.20. This is followed by $1.30, $1.37 (1.414 Fib Extension & March High-day closing price), and $1.46 (1.618 Fib Extension).
The RSI is straddling the midline as indecision looms within the market. To break $1.20 and head toward the upper March boundary, the RSI must start to push higher to indicate increased bullish momentum.
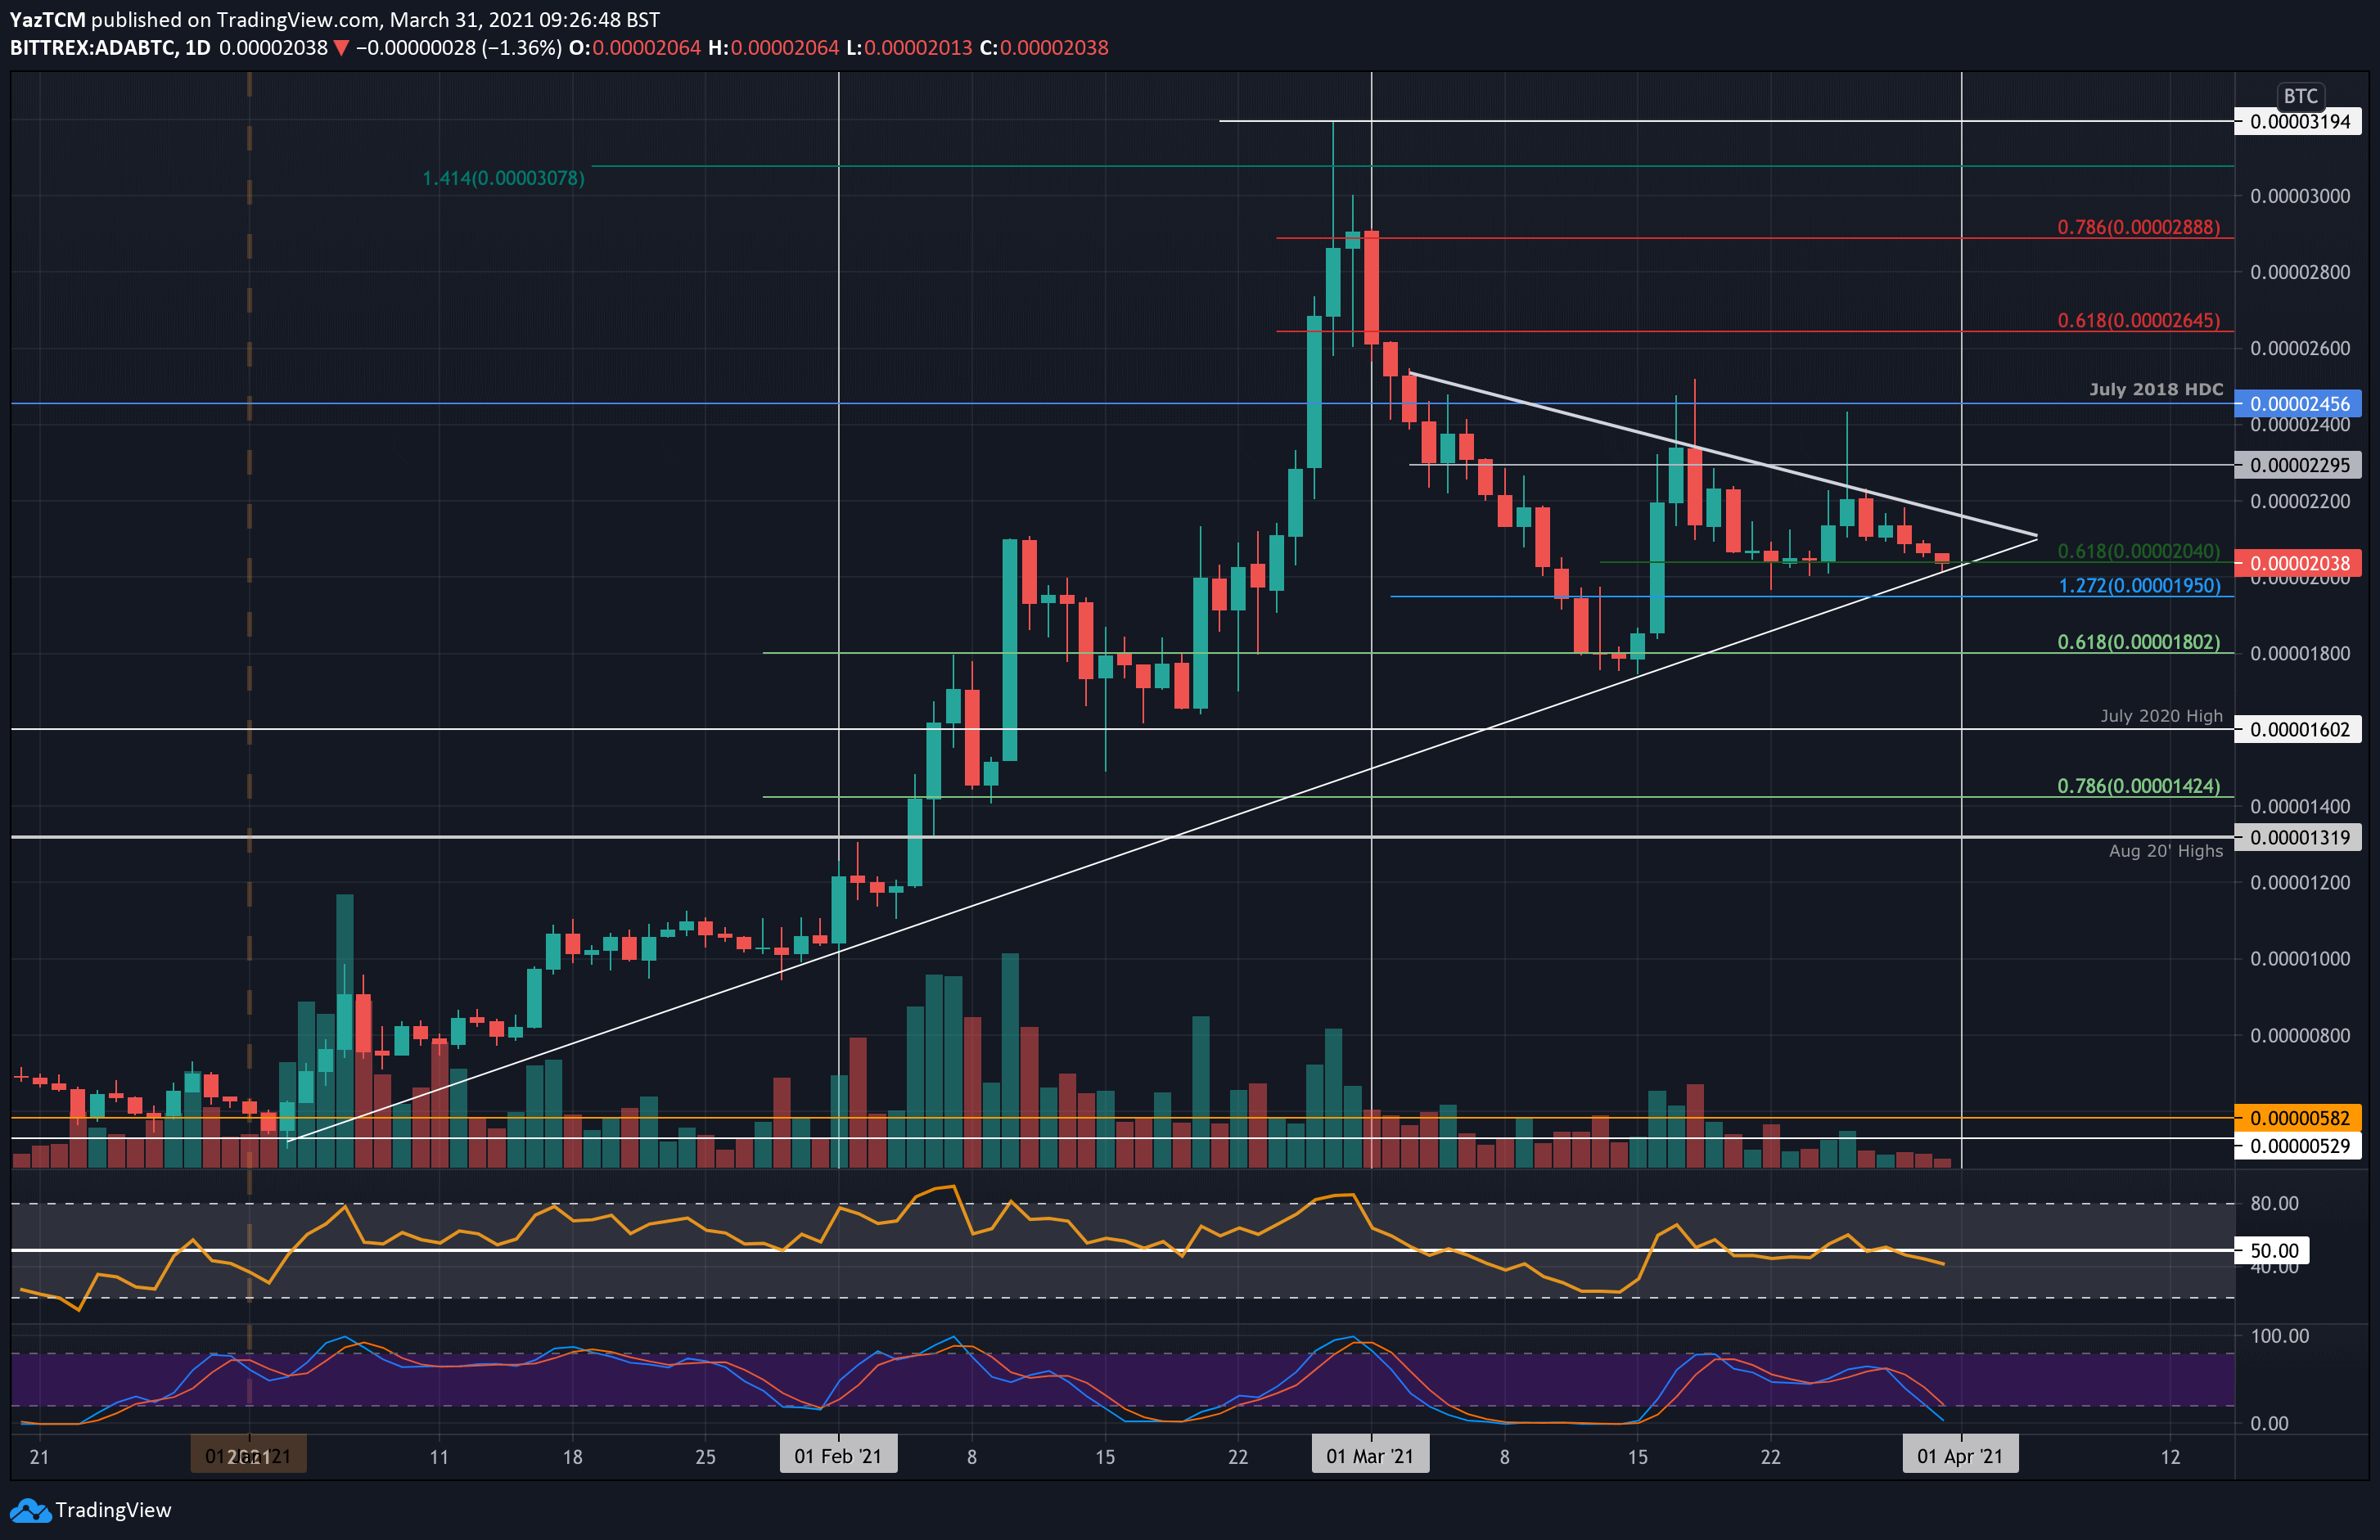
Key Support Levels: 2000 SAT, 1950 SAT, 1800 SAT.
Key Resistance Levels: 2200 SAT, 2300 SAT, 2455 SAT.
Against Bitcoin, ADA has formed somewhat of a symmetrical triangle pattern during the second half of March. The cryptocurrency rebounded from 2000 SAT last week but was unable to close a daily candle above 2200 SAT, where lies the upper boundary of this triangle.
It has since dropped lower slightly as the bulls attempt to defend 2000 SAT. They managed to defend this support last week, and the lower boundary of the triangle also lies here.
Looking ahead, if the sellers break beneath 2000 SAT and fall beneath the triangle, the first support lies at 1950 SAT (downside 1.272 Fib Extension). This is followed by 1800 SAT (.618 Fib), 1600 SAT (July 2020 Highs), and 1500 SAT.
On the other side, the first resistance lies at the upper boundary of the triangle. This is followed by 2200 SAT, 200 SAT, and 2455 SAT (July 2018 High-day Closing price).
The RSI has dipped beneath the midline here, indicating the bears are attempting to take control of the market momentum. If it continues to drop, the bearish momentum is likely to force ADA beneath the current triangle.