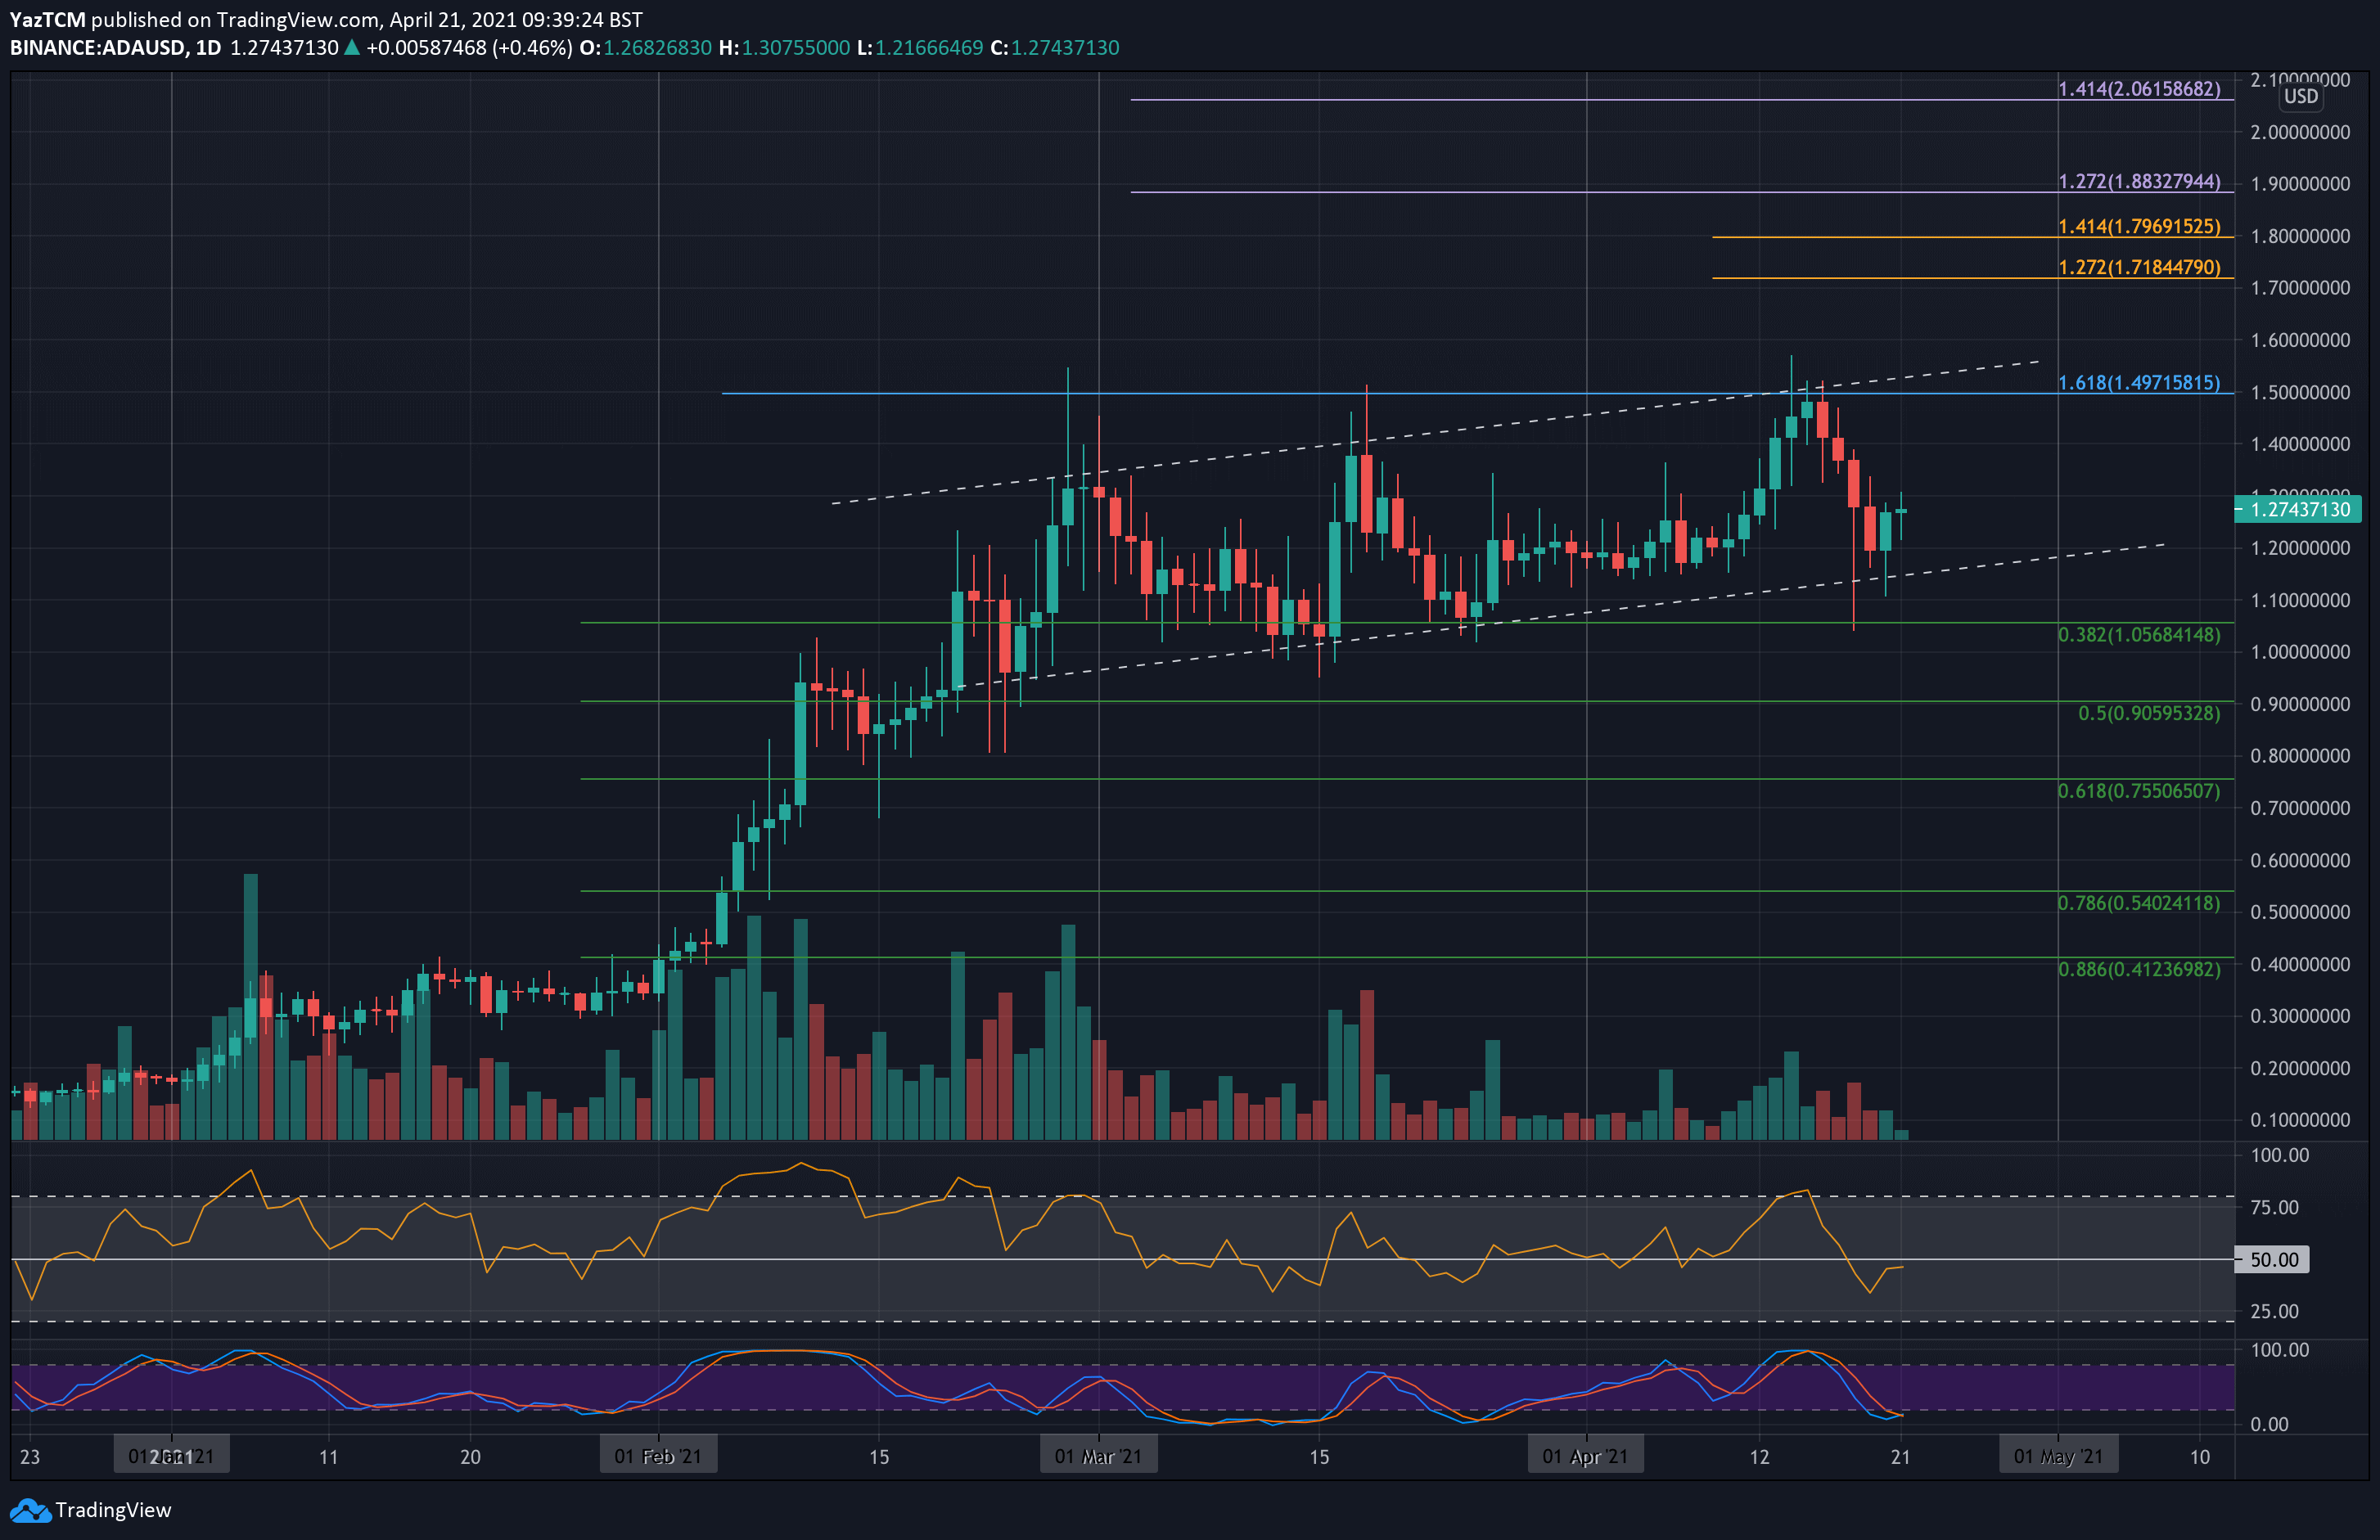
ADA/USD Daily Chart. Source: TradingView
Key Support Levels: $1.05, $1.00, $0.9.
Key Resistance Levels: $1.30, $1.50, $1.72.
ADA had set a new ATH at $1.57 last week but could not overcome resistance at $1.50, provided by a 1.618 Fib Extension level. From there, it rolled over and started to head lower again.
During the Sunday crash, ADA dropped as low as $1.05, where it found support at a .382 Fib Retracement level. It rebounded from there but failed to increase over the past two days, and reached $1.10 yesterday.
ADA is still trading inside a shallow rising price channel and a breakout of this channel should dictate the next direction for the coin.
Looking ahead, the first resistance lies at $1.30. This is followed by $1.50 (1.618 Fib Extension), $1.72 (1.272 Fib Extension – orange), $1.80 (1.414 Fib Extension – orange), and $1.88 (1.272 Fib Extension – purple).
On the other side, the first support lies at the lower boundary of the price channel. This is followed by $1.05 (.382 Fib), $1.00, and $0.9 (.5 Fib).
The RSI dipped beneath the midline over the weekend but is now battling to climb back above it – indicating indecision within the market. Luckily, the Stochastic RSI is in oversold conditions and is primed for a bullish crossover signal.
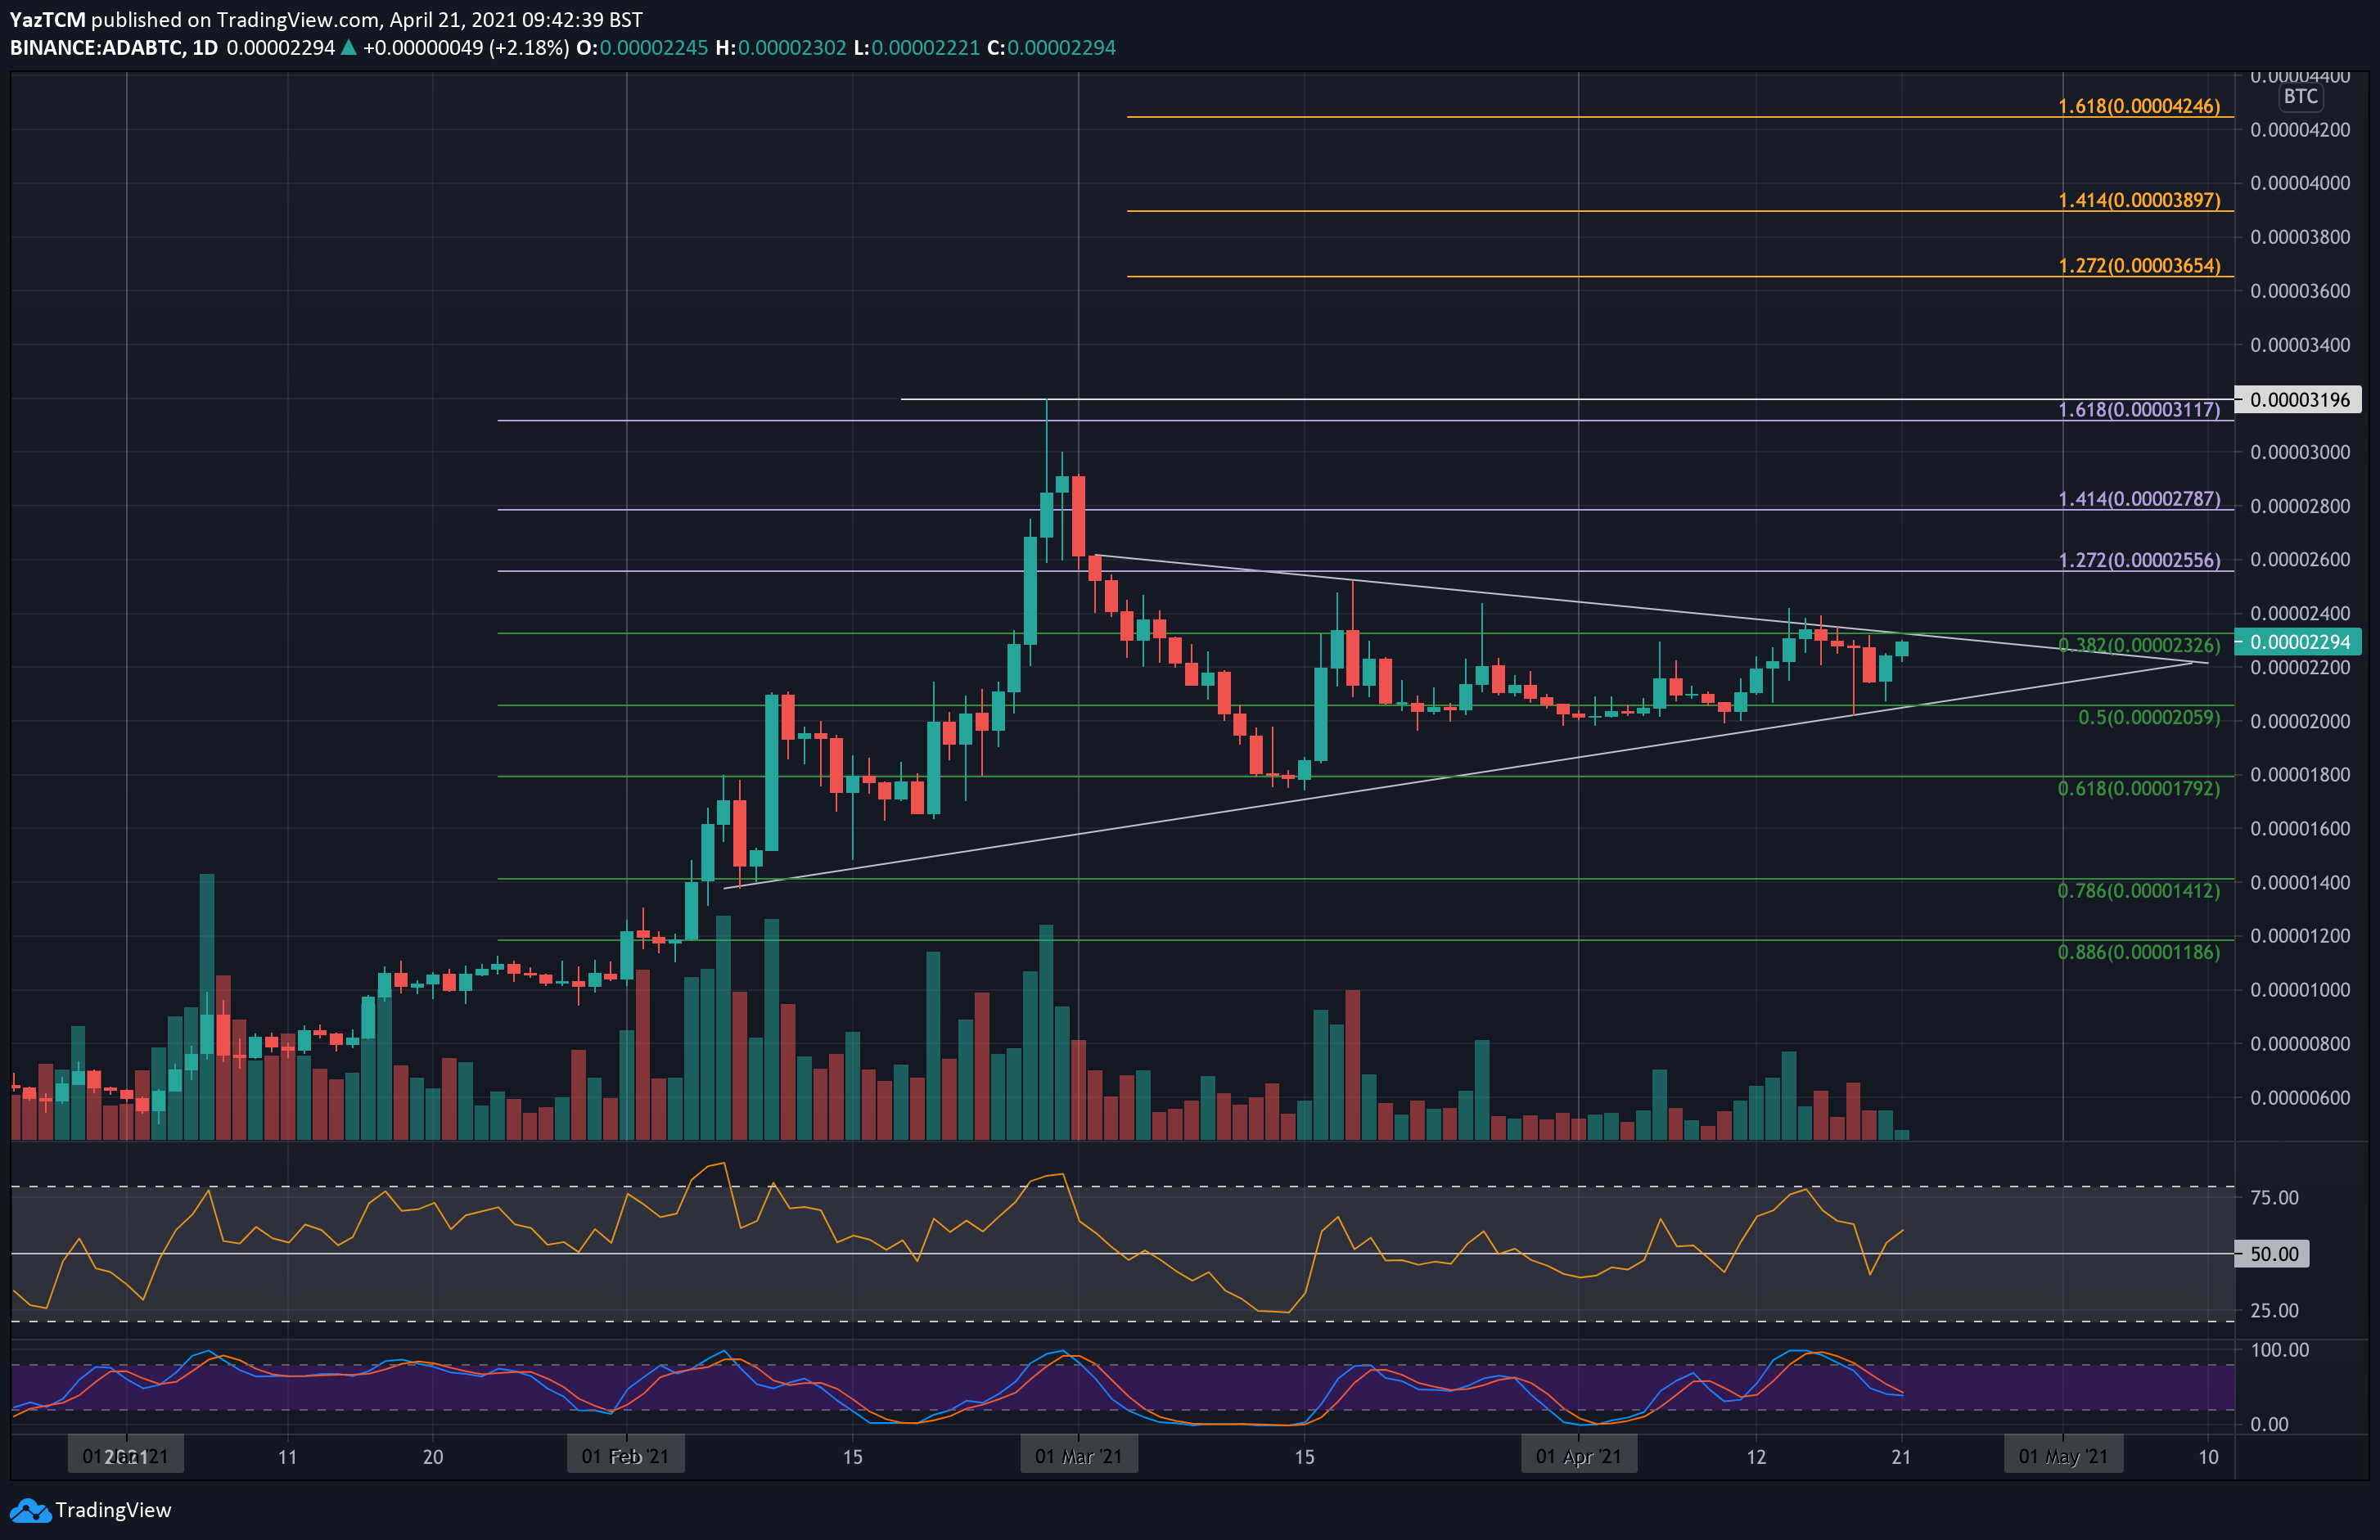
Key Support Levels: 2060 SAT, 1800 SAT, 1600 SAT.
Key Resistance Levels: 2250 SAT, 2555 SAT, 2790 SAT.
Against Bitcoin, ADA has been trading inside a symmetrical triangle pattern since the start of March 2021. The cryptocurrency had attempted to break the upper boundary of the triangle earlier last week but failed.
On Sunday, the crash caused it to drop into the lower boundary of this triangle but the market has since rebounded from there as it makes its way back to the upper boundary again.
A breakout of this triangle will be required to dictate the next direction for the market.
Looking ahead, the first resistance lies at the upper boundary of the triangle at 2350 SAT. This is followed by 2555 SAT (1.272 Fib Extension), 2790 SAT (1.414 Fib Extension), and 3000 SAT.
On the other side, the first support lies at 2060 SAT (.5 Fib & Lower Boundary of the triangle). Beneath the triangle, support lies at 1800 SAT (.618 Fib), 1600 SAT, and 1410 SAT (.786 Fib).
The RSI is above the midline, indicating there is weak bullish momentum within the market.