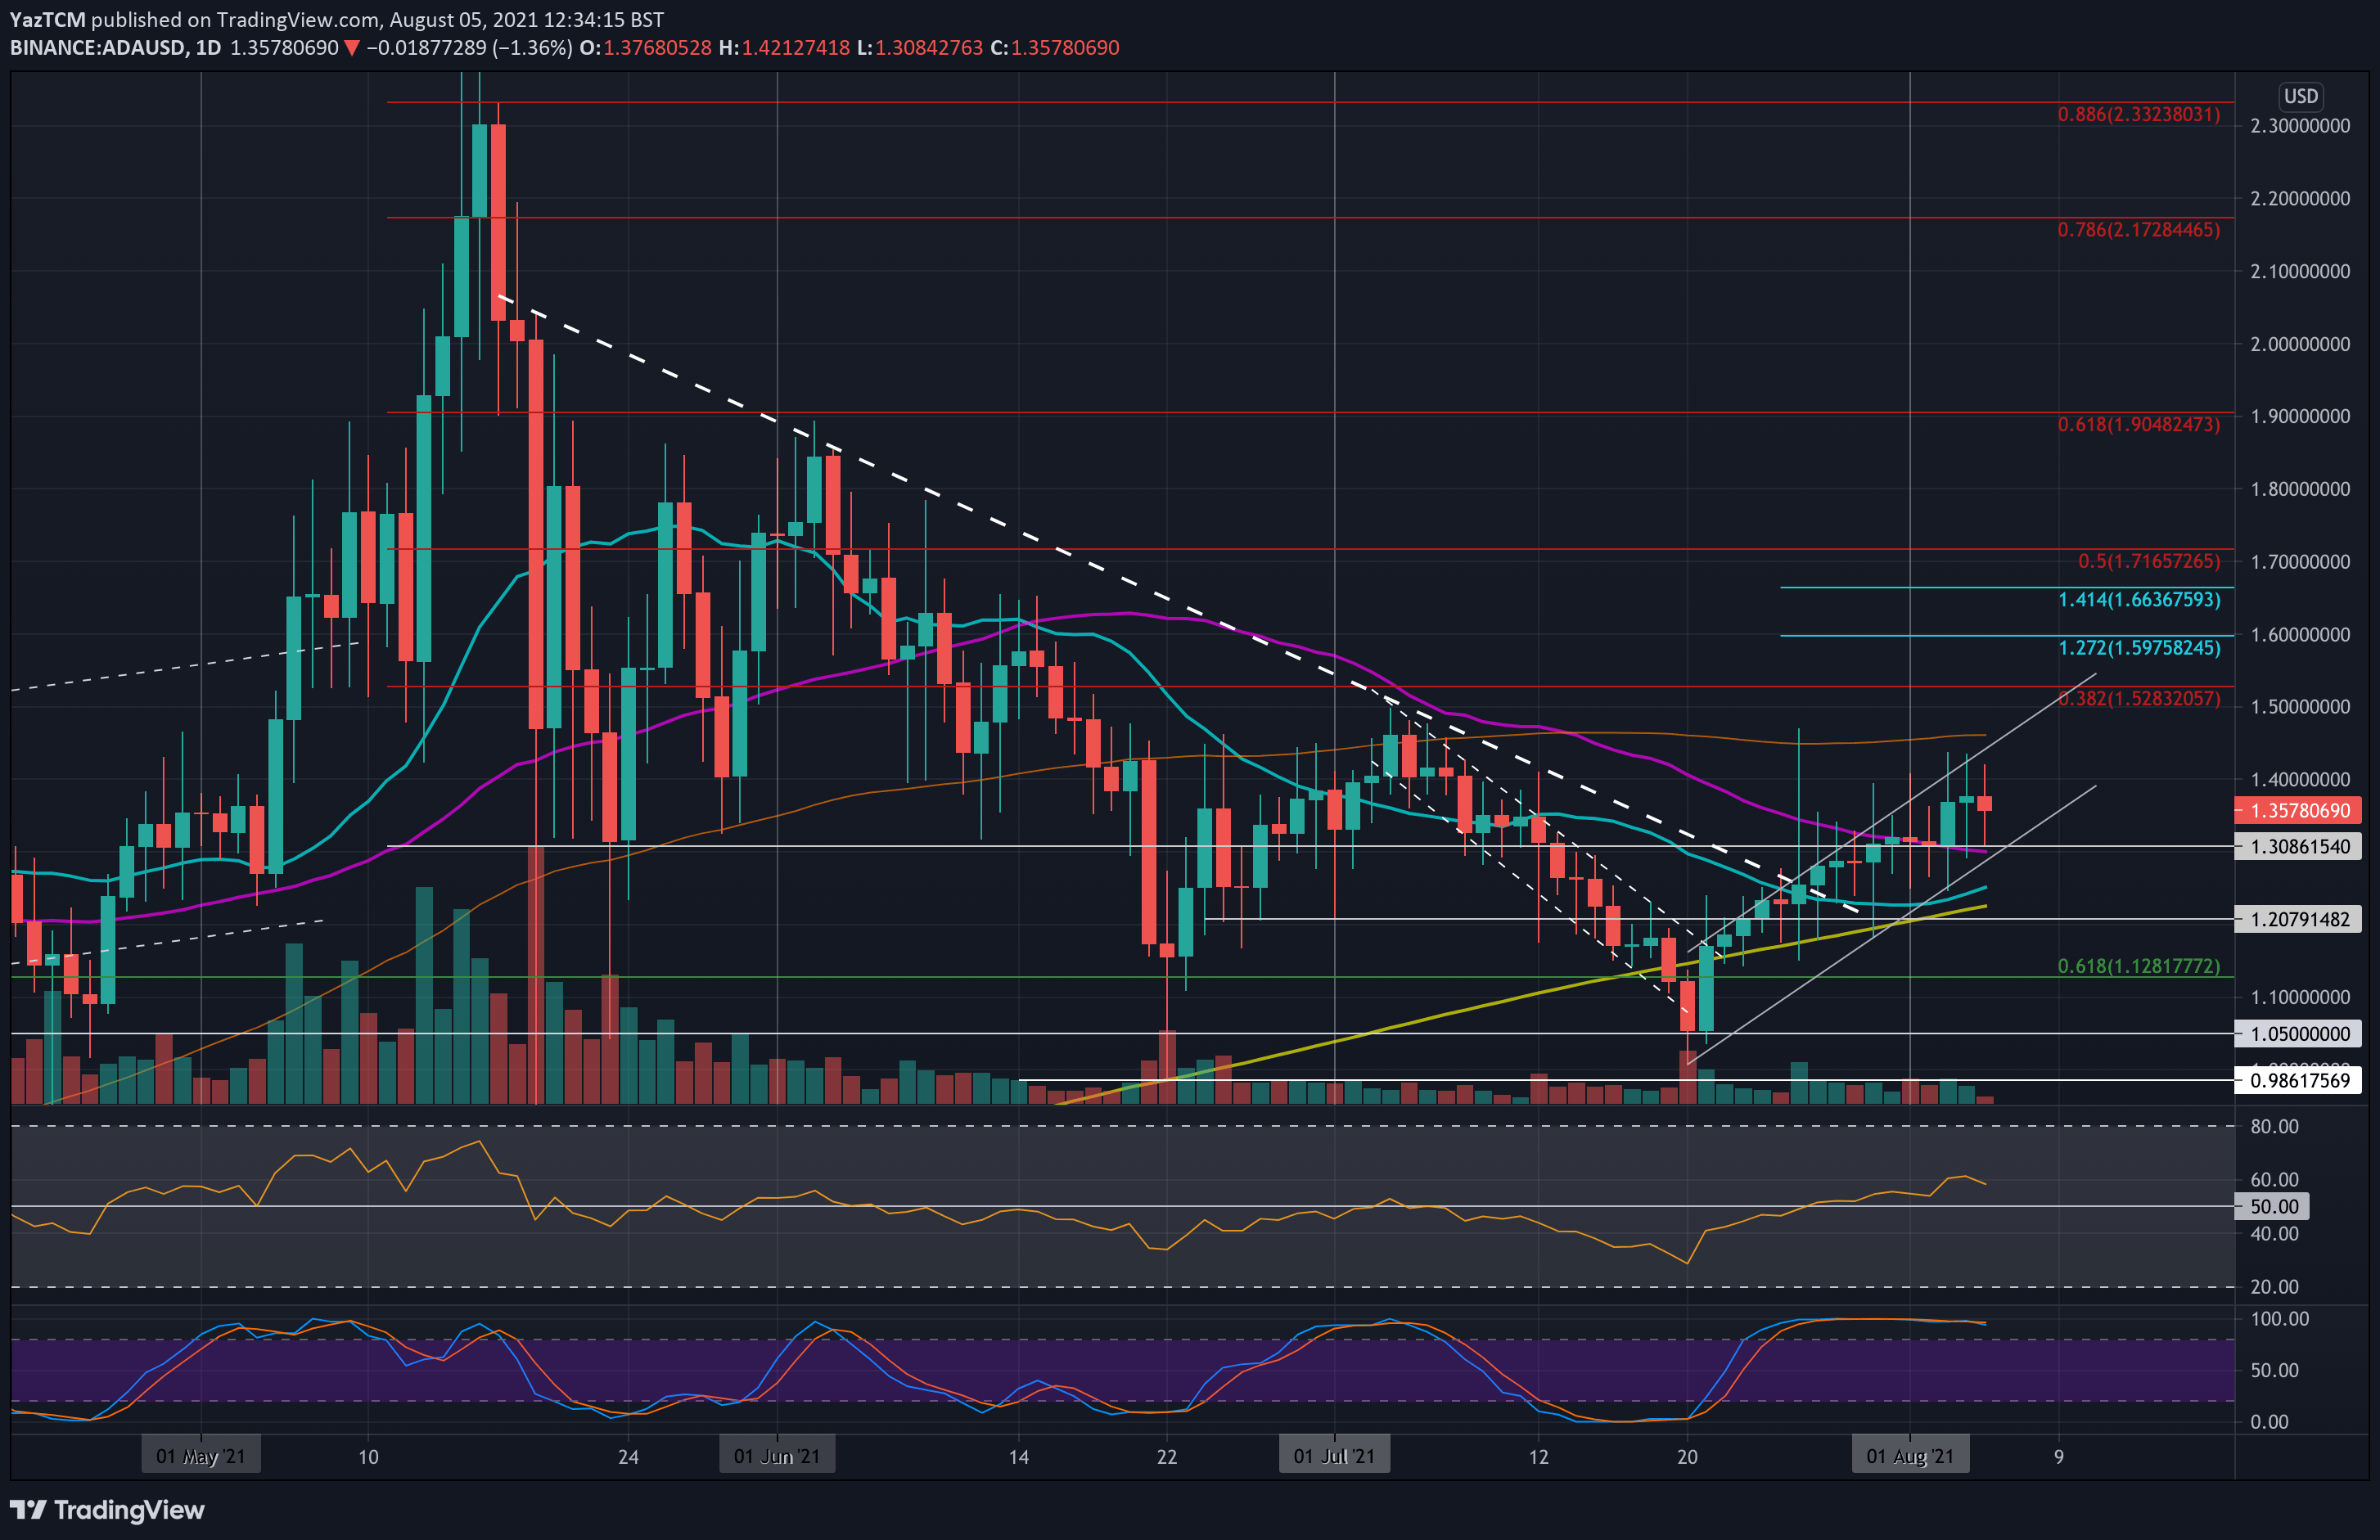
ADA/USD Daily Chart. Source: TradingView.
Key Support Levels: $1.30, $1.22, $1.20.
Key Resistance Levels: $1.40, $1.46, $1.50-$1.52.
ADA is up almost 6% this week as the cryptocurrency finally cleared the 50-day MA at $1.30 on Tuesday to reach the current $1.40 resistance. It had struggled to close a daily candle above the 50-day MA last week, and Tuesday’s clearance was the first time ADA was above the 50-day MA since early June.
It bounced from $1.05 support in the final half of July and has since been trending upward inside an ascending price channel. The lower boundary of the price channel would be a major support to defend to prevent declines back toward the 200-day MA.
Looking ahead, the first resistance lies at $1.40. This is followed by $1.46 (100-day MA & upper angle of ascending price channel), $1.50 – $1.52, and $1.60 (1.272 Fib Extension), and $1.71 (bearish .5 Fib).
On the other side, the first support lies at $1.30 (50-day MA & lower angle of the price channel). This is followed by $1.22 (20-day MA), $1.20 (200-day MA), and $1.12 (.618 Fib).
The daily RSI is above the midline and shows the highest bullish momentum since mid-May – a powerful sign for the buyers.
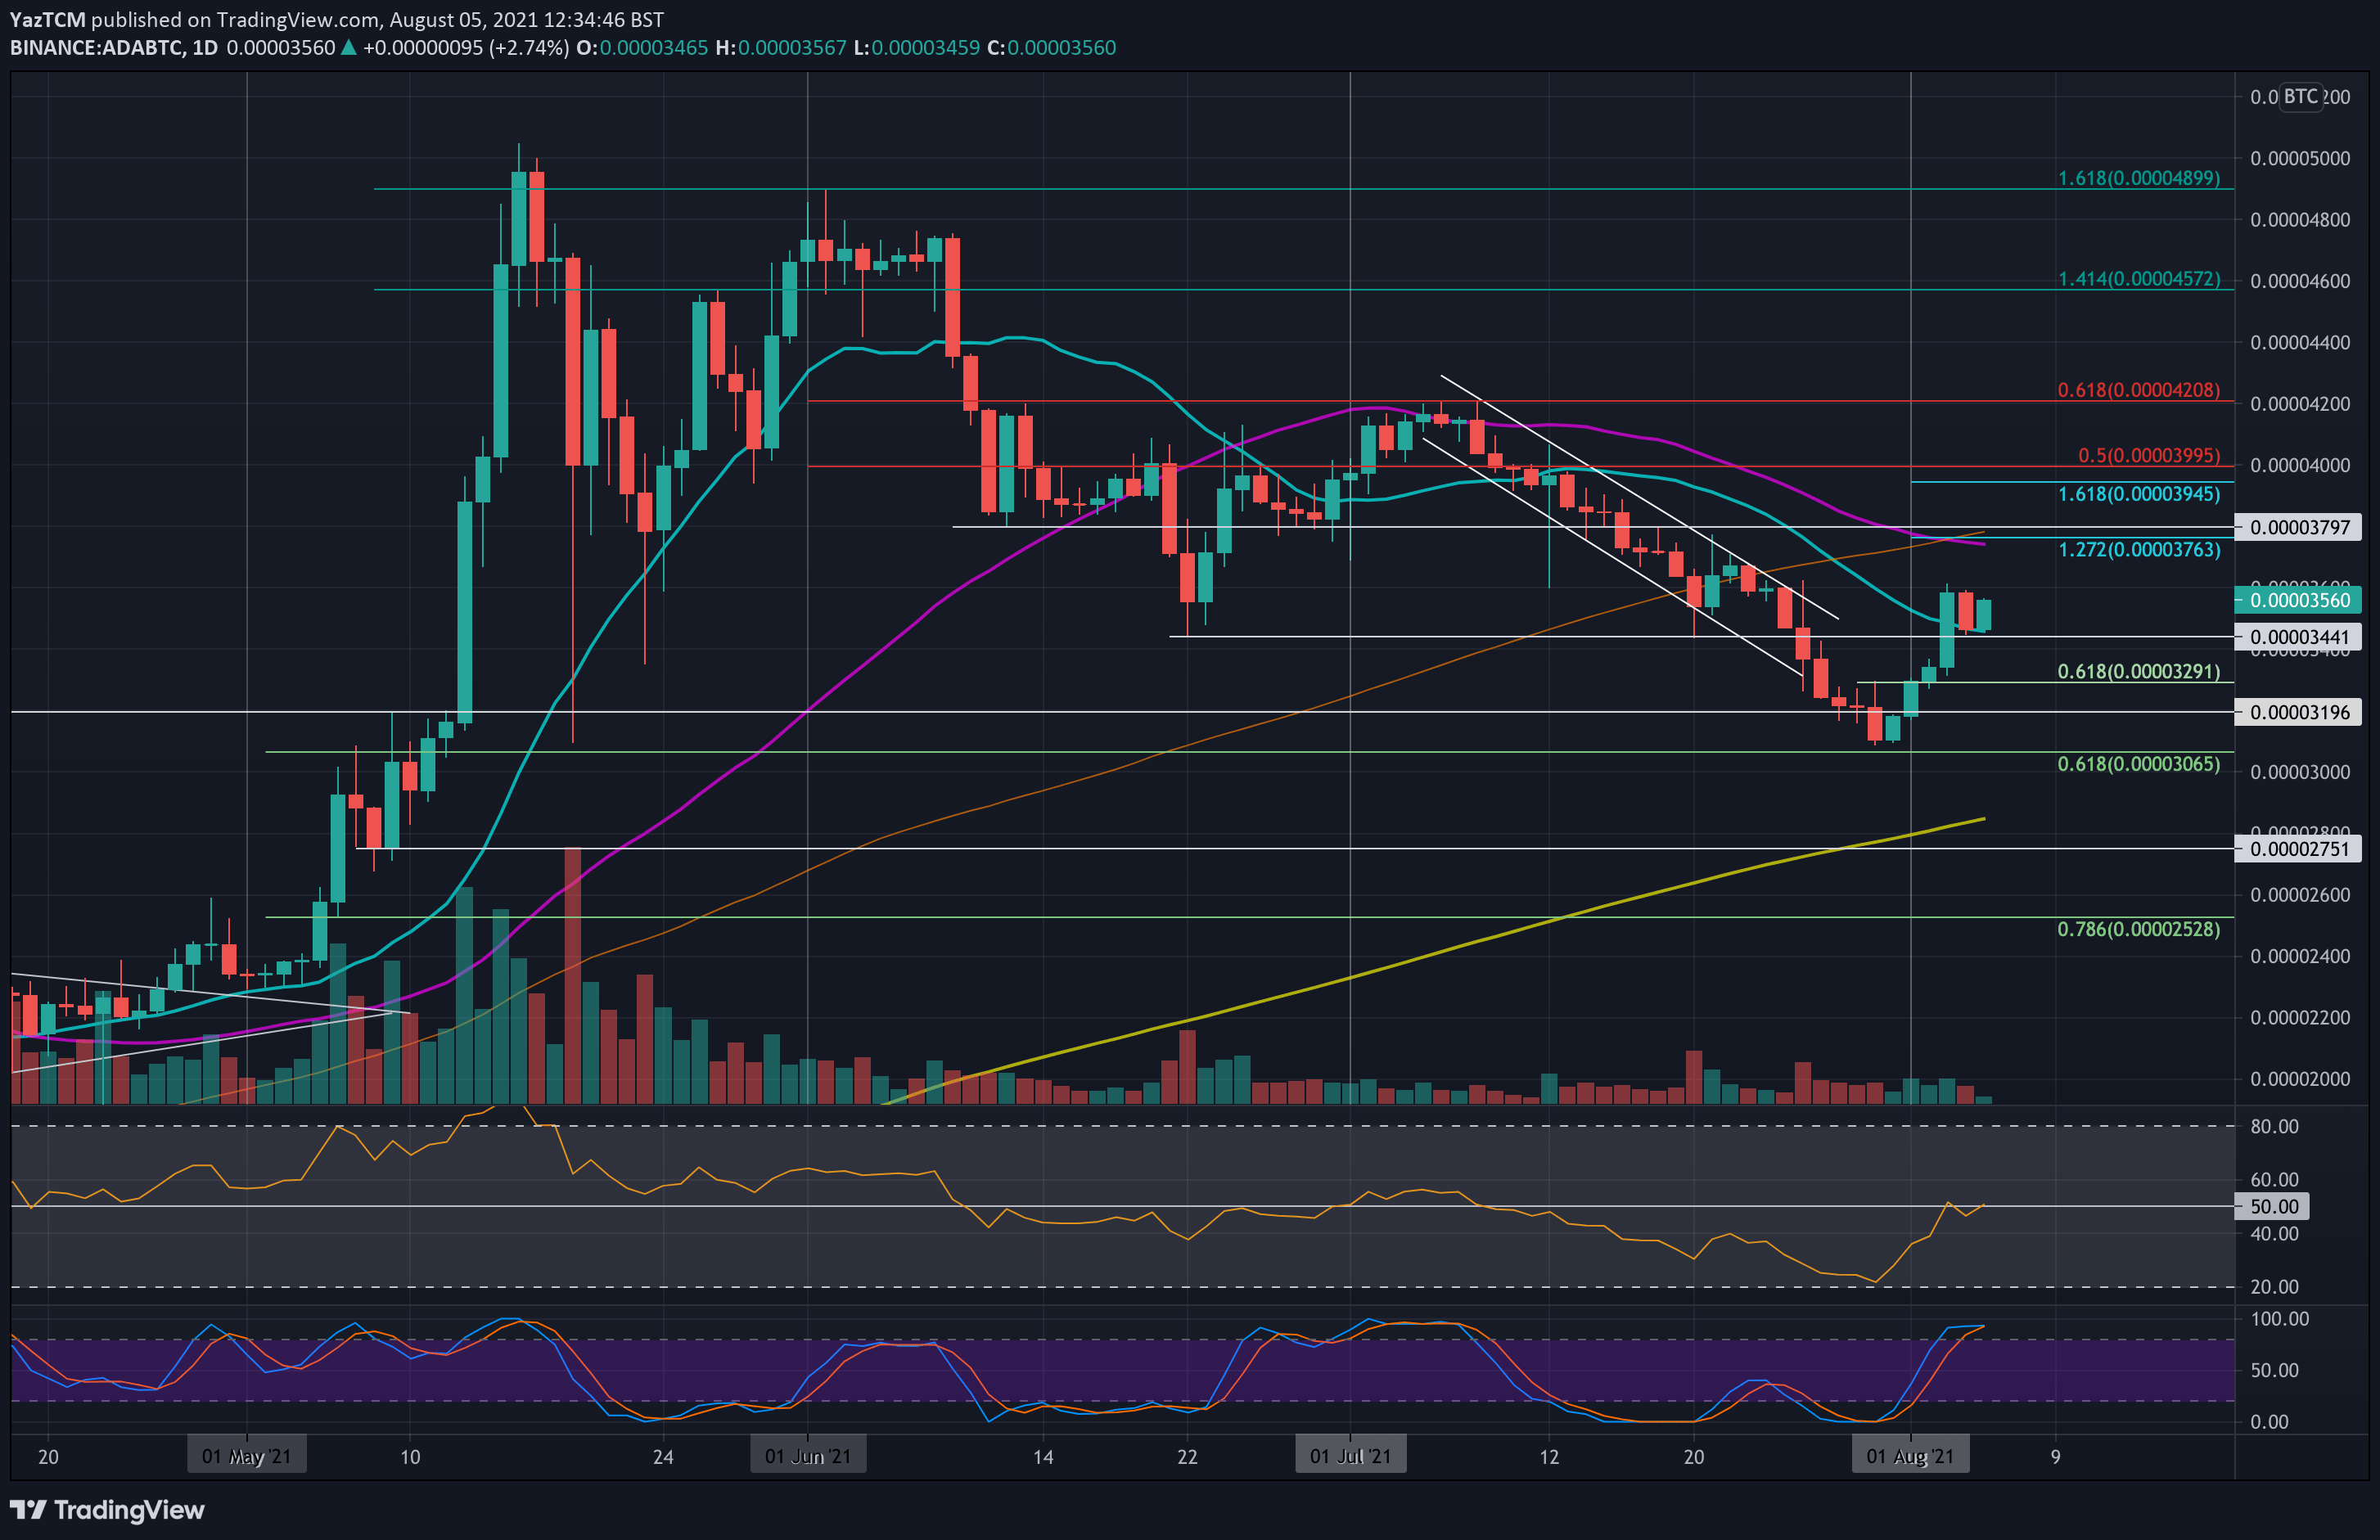
Key Support Levels: 3500 SAT, 3440 SAT, 3300 SAT.
Key Resistance Levels: 3600 SAT, 3765 SAT, 4000 SAT.
ADA rebounded from 3100 SAT at the end of July and has since pushed higher to break the 20-day MA on Tuesday and reach as high as 3600 SAT.
Unfortunately, it dropped from 3600 SAT yesterday but managed to maintain the 20-day MA as support today. It has since bounced higher and is heading back toward 3600 SAT.
Moving forward, the first support lies at 3500 SAT (20-day MA). This is followed by 3440 SAT (late-June low) and 3300 SAT (.618 Fib).
On the other side, the first resistance lies at 3600 SAT. This is followed by 3765 SAT (50-day and 100-day EMA levels) and 4000 SAT (bearish .5 Fib).
The RSI is back in the neutral territory, indicating the previous bearish momentum has completely faded. The next move is critical, and the RSI would need to rise beyond 50 to indicate that bullish momentum has been established.