Cardano has been on somewhat of a bull-run recently after rising by 11% over the previous 24 hours. The cryptocurrency has now seen a 28% increase over the past seven days and a significant 50% price surge over the past 30 days.
The recent price increase can be related to the Altcoin season 2019, as well as to the Cardano’s Mainnet 1.5 milestone, which released exactly a week ago.
The recent price increase has pushed Cardano back into the top 10 largest cryptocurrencies by market cap, ahead of Tron, as it currently holds a market cap value of $1.75 billion.
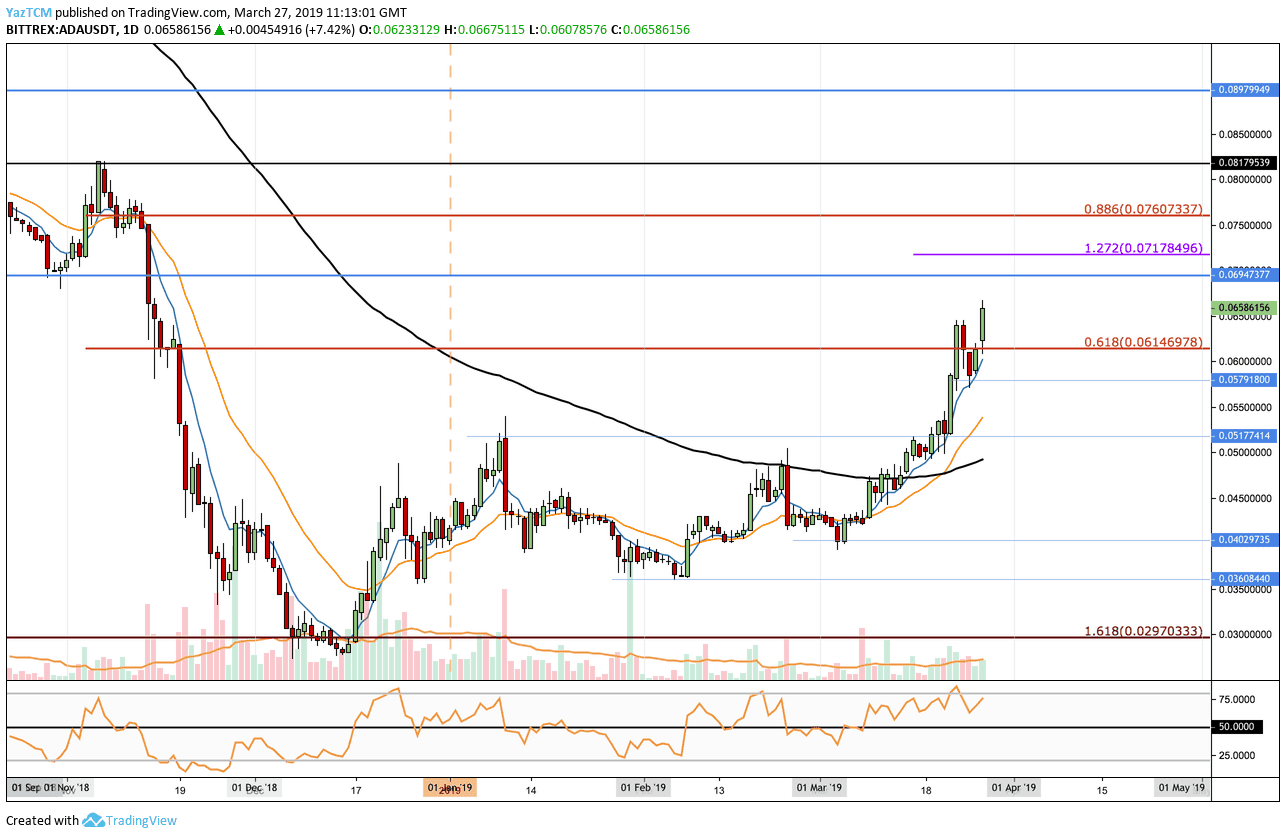
Looking at the ADA/USD 1-Day Chart:
- Analyzing the ADA/USD market we can see that price action has been surging during this month of March 2019. Toward mid-March, the coin had broken above the 100-day moving average and continued to surge further higher. The recent price gains in today’s trading session has caused ADA/USD to reach a new 2019 high.
- From above: The nearest resistance now lies at $0.06947 – $0.7 which was the October 2018 low day’s closing price. Further above this, the next level of resistance lies at $0.0760, along with the bearish .886 Fibonacci Retracement measured from the November 2018 high to the December 2018 low. Further above $0.080 – $0.08179 area and $0.08979.
- From below: The nearest level of support now lies at $0.060. Beneath this, we can expect support at $0.05791 and $0.05177. Below $0.050, further support lies at $0.045.
- The trading volume has been gradually increasing during March 2019 and is relatively high.
- The RSI remains above the 50 levels as the bulls control the market momentum.
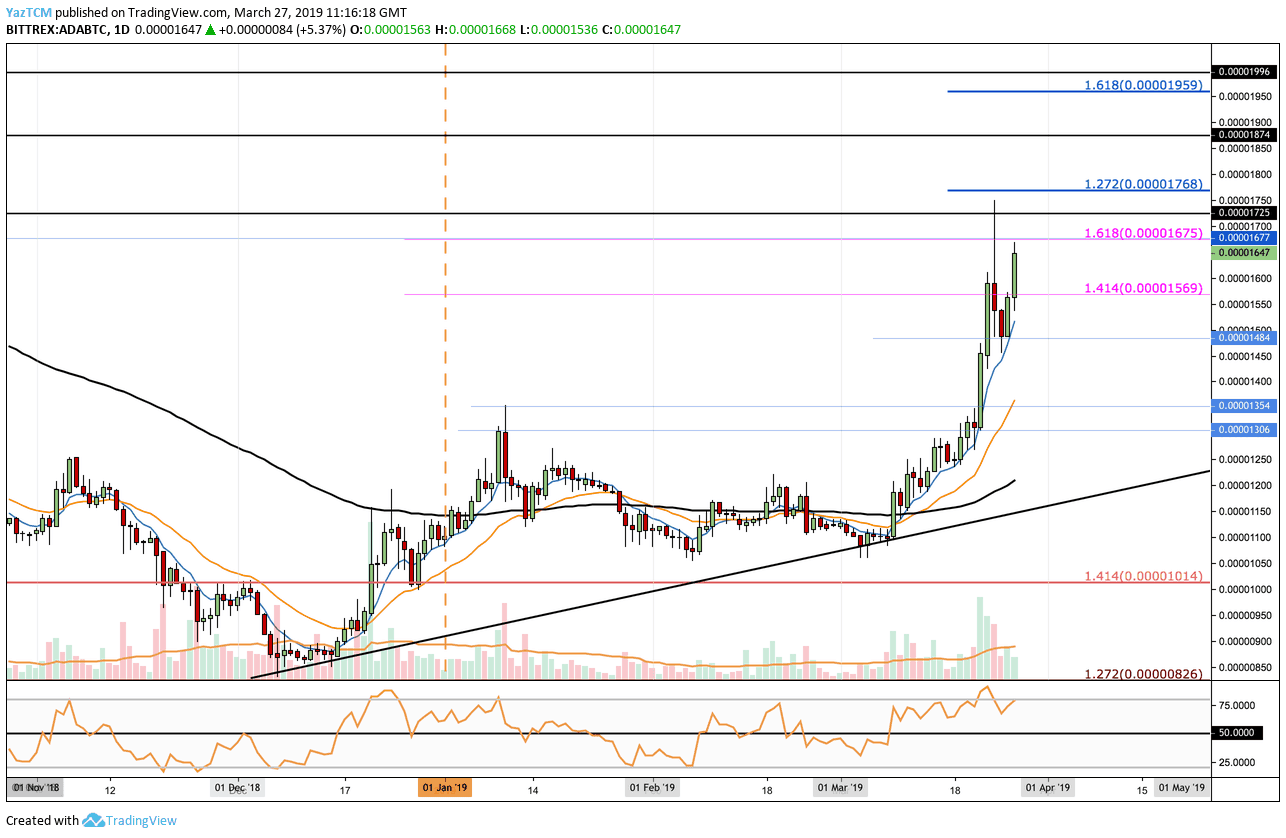
Looking at the ADA/BTC 1 Day Chart:
- Against Bitcoin, we can see that ADA had bounced from a 4-month rising trend line in the beginning of March 2019. The coin continued to rise surpass the 100-day moving average to reach its current high since August 2018 around the 1730 SAT level.
- From above: The nearest resistance lies at current area: 1675- 1725 SAT. Further resistance is located at 1768 SAT where lies a short term 1.272 Fibonacci Extension level. If the buying continues, more resistance then lies at 1874 SAT and 1960 – 2000 SAT.
- From below: The nearest support now lies at 1569 SAT. Beneath this, support lies at 1482 and 1354 SAT.
- The trading volume has significantly increased toward the end of March.
- The RSI is also in bullish territory above 50. However, the RSI is approaching overbought conditions which could signal that the bulls are overextended and correction is coming.
SPECIAL OFFER (Sponsored)
LIMITED OFFER 2024 for CryptoPotato readers at Bybit: Use this link to register and open a $500 BTC-USDT position on Bybit Exchange for free!
Disclaimer: Information found on CryptoPotato is those of writers quoted. It does not represent the opinions of CryptoPotato on whether to buy, sell, or hold any investments. You are advised to conduct your own research before making any investment decisions. Use provided information at your own risk. See Disclaimer for more information.
Cryptocurrency charts by TradingView.