

Ripple’s price has been consolidating over the last few weeks, failing to continue its recovery. Yet, there is still the probability for the market to rise higher.
Technical Analysis
By TradingRage
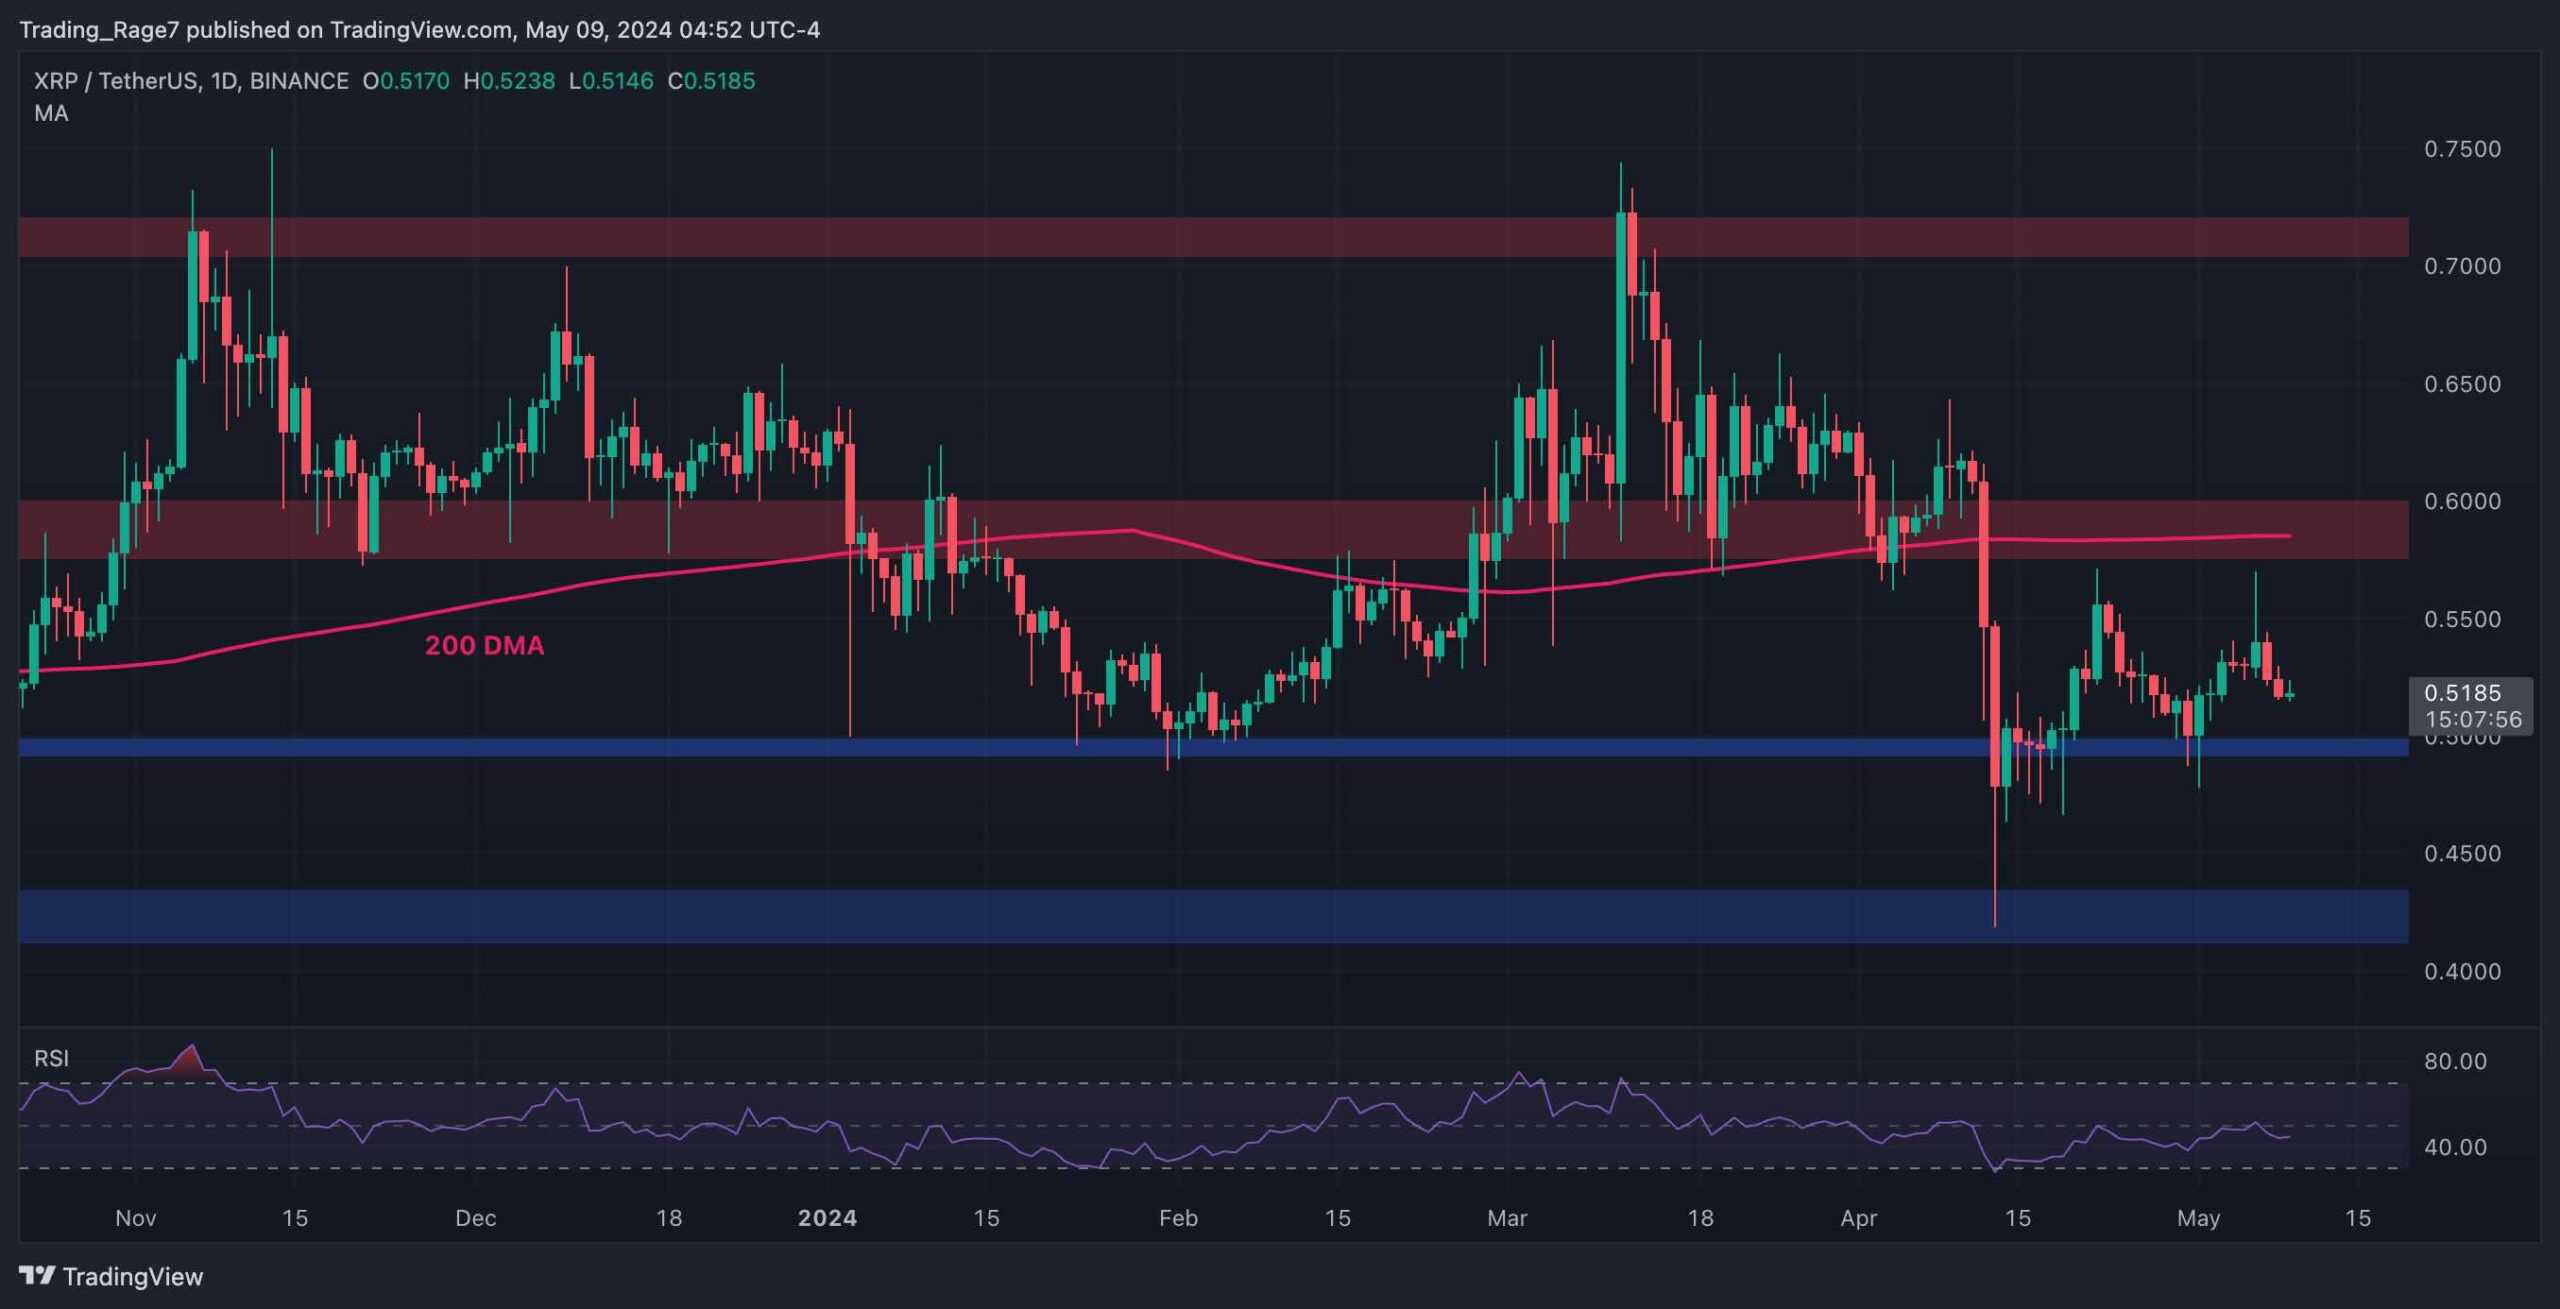
The USDT Paired Chart
On the USDT paired chart, the price has recently rebounded from the $0.4 support zone and climbed above the $0.5 level. Yet, the 200-day moving average, located around the $0.6 mark, is still intact.
The price is currently dropping toward the $0.5 level once more. If the level holds, XRP might rally toward the 200-day moving average. However, with the RSI showing values below 50%, market momentum is still in favor of a bearish move.
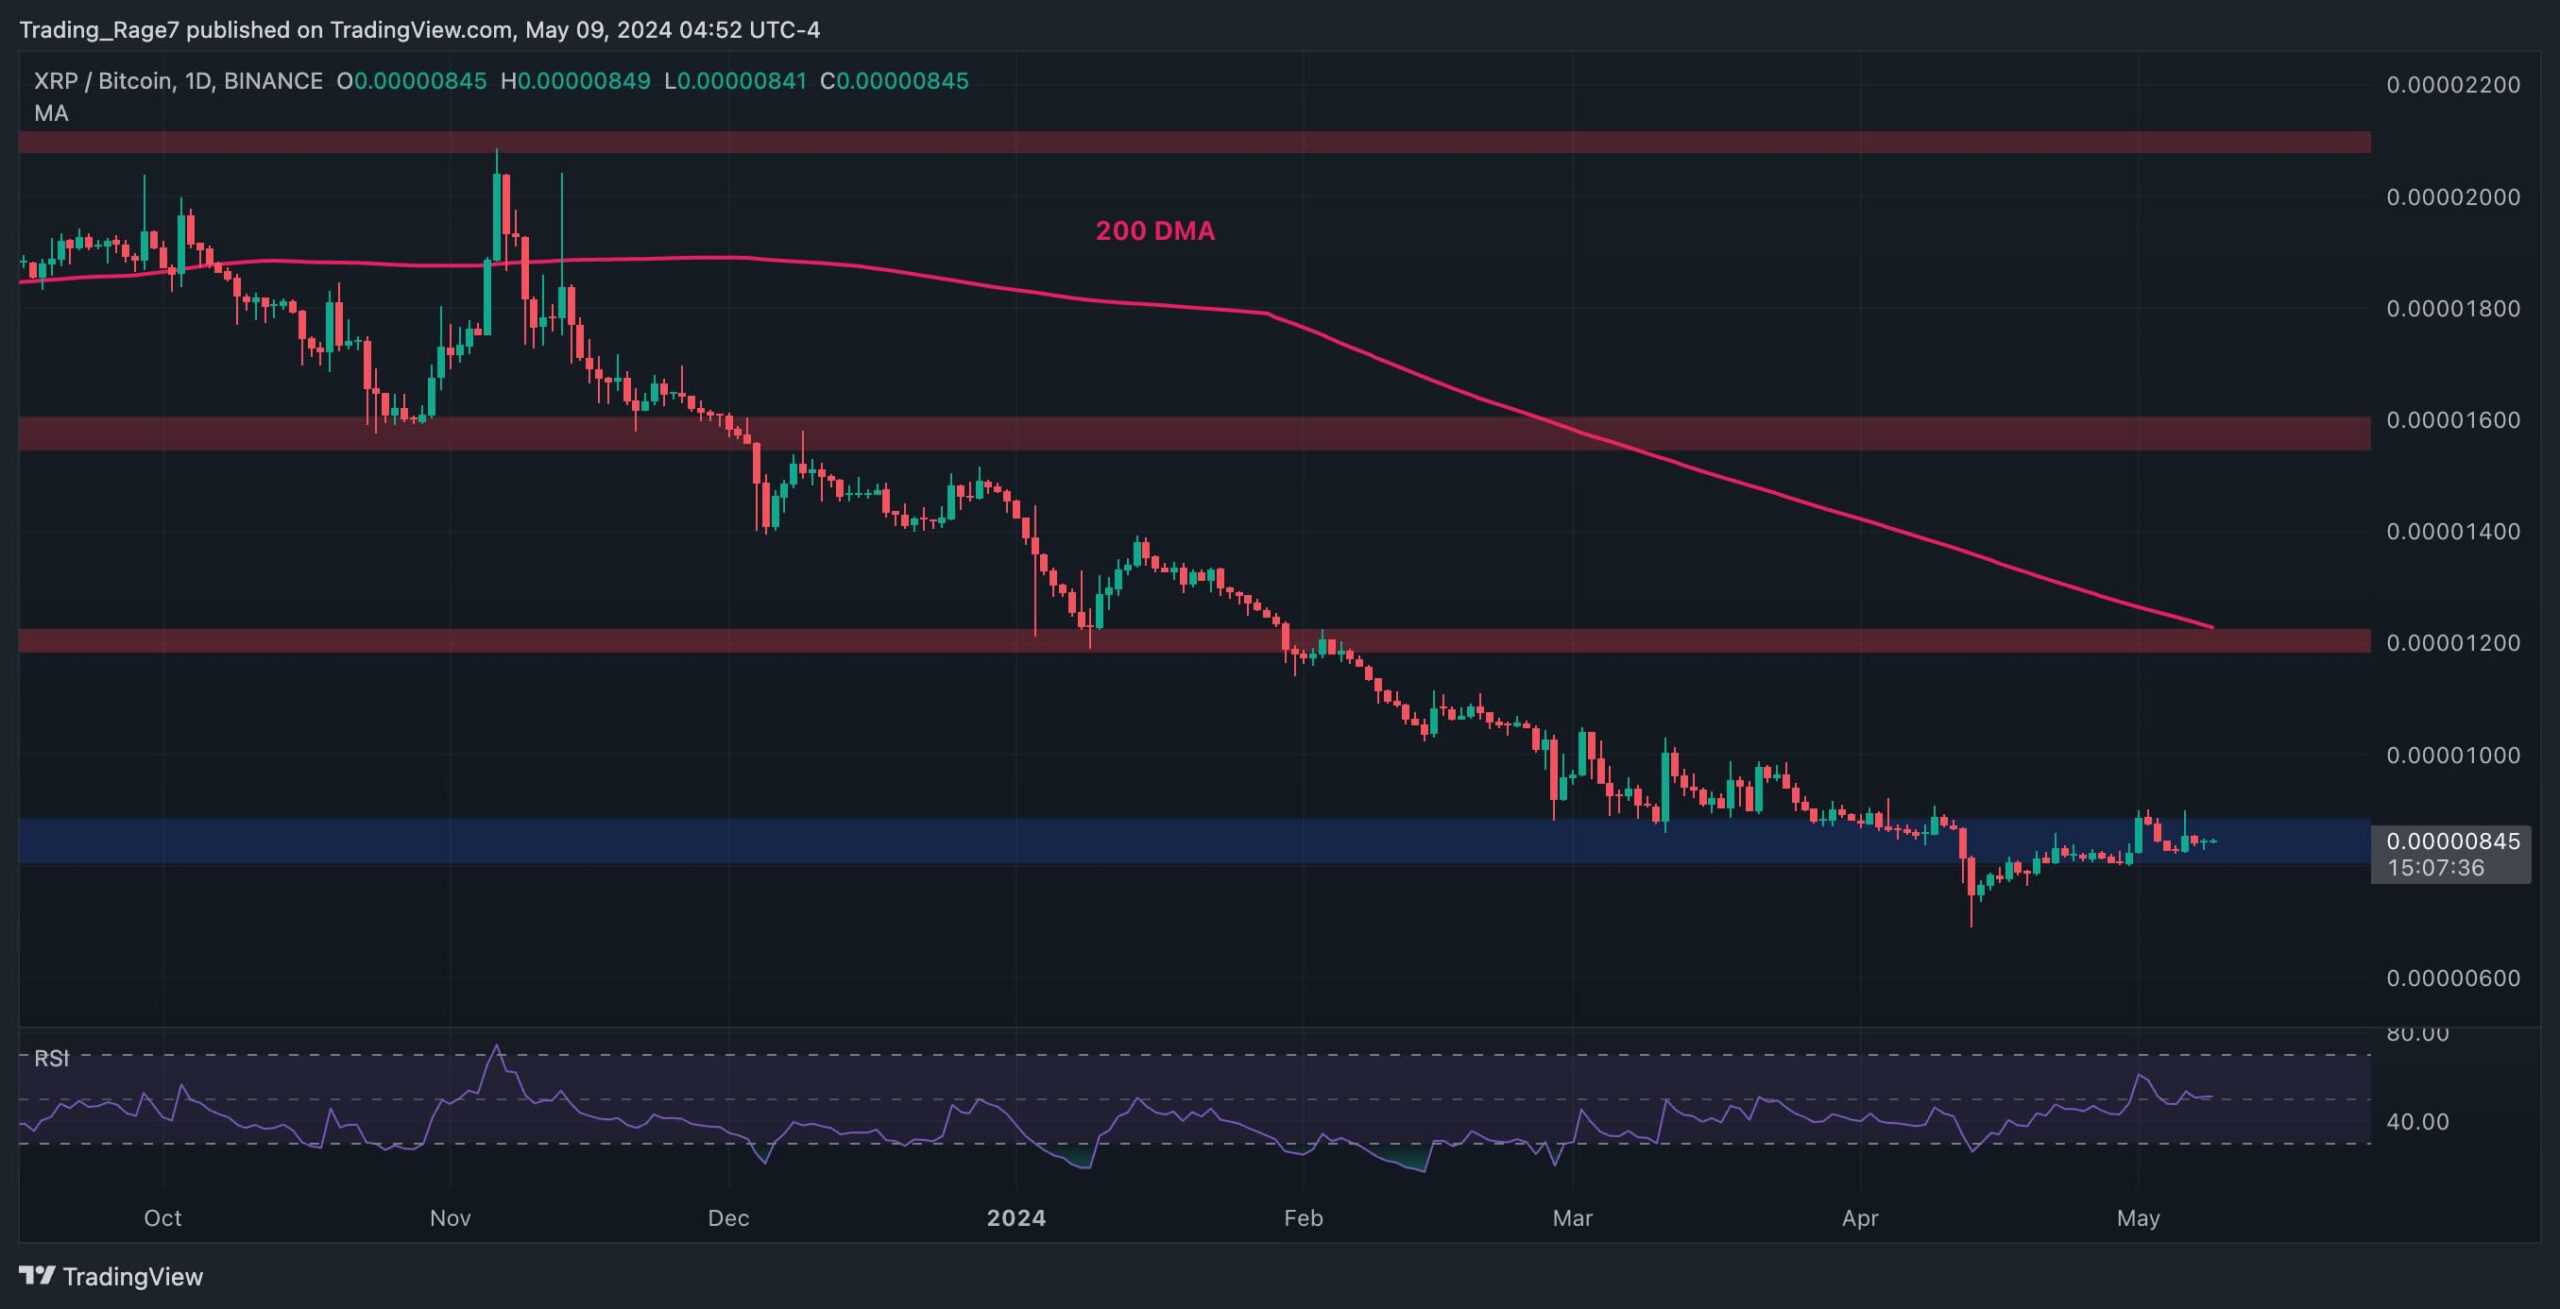
The BTC Paired Chart
Looking at the chart against Bitcoin, it is evident that the market’s downtrend has finally come to a halt, with the 800 SAT level preventing the price from dropping lower. Meanwhile, the Relative Strength Index has been oscillating around the 50% level, indicating that the market is in equilibrium.
If the 800 SAT area holds, investors can be optimistic that the XRP price can climb toward the 1200 SAT resistance level and the 200-day moving average located around the same mark. Yet, while the cryptocurrency remains below the 200-day moving average, the market’s trend cannot be considered bullish.
LIMITED OFFER 2024 at BYDFi Exchange: Up to $2,888 welcome reward, use this link to register and open a 100 USDT-M position for free!
Disclaimer: Information found on CryptoPotato is those of writers quoted. It does not represent the opinions of CryptoPotato on whether to buy, sell, or hold any investments. You are advised to conduct your own research before making any investment decisions. Use provided information at your own risk. See Disclaimer for more information.
Cryptocurrency charts by TradingView.


