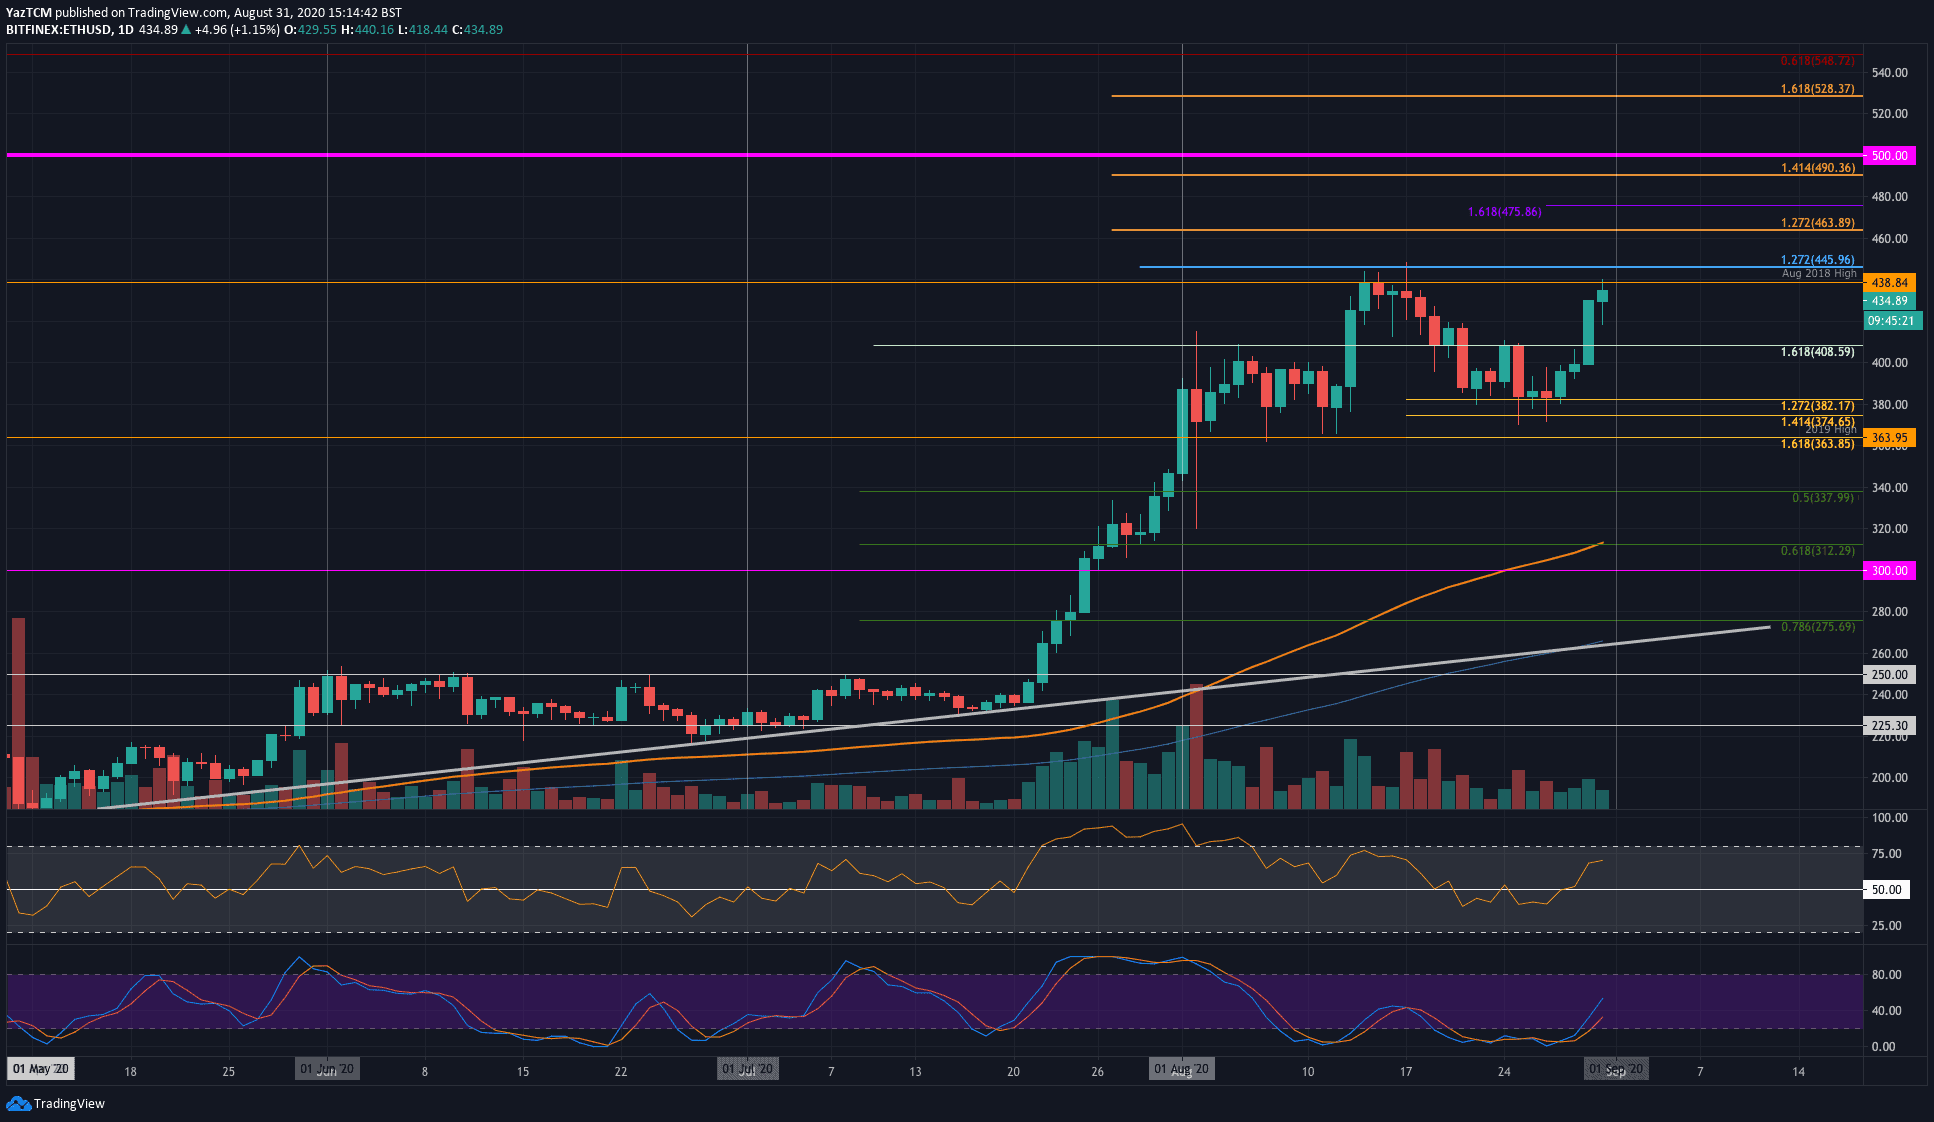
Key Support Levels: $420, $408, $400.
Key Resistance Levels: $438, $450, $463.
Last week, Etheruem fell into the $380 support (downside 1.272 Fib Extension) and rebounded. At the time, it was trading within a falling pitchfork on the 4-hour chart. The bounce from $380 allowed Ethereum to break above this pitchfork over the weekend as it penetrated $400 to reach the $408 resistance.
ETH continued to push past the $408 resistance as it spiked into the August 2018 highs at $438 today. A break above this resistance could see Etheruem heading toward $500 over this week.
Looking ahead on the daily chart, the first range of resistance to overcome lies between $438 (August 2018 high) and $445 (1.272 Fib Extension). Beyond $450, resistance lies at $463, $475, $490, and $500.
On the other side, support lies at $420, $408, $400, and $382.
Looking at the 4HR chart, Ethereum has established a robust short term uptrend since penetrating above the pitchfork.
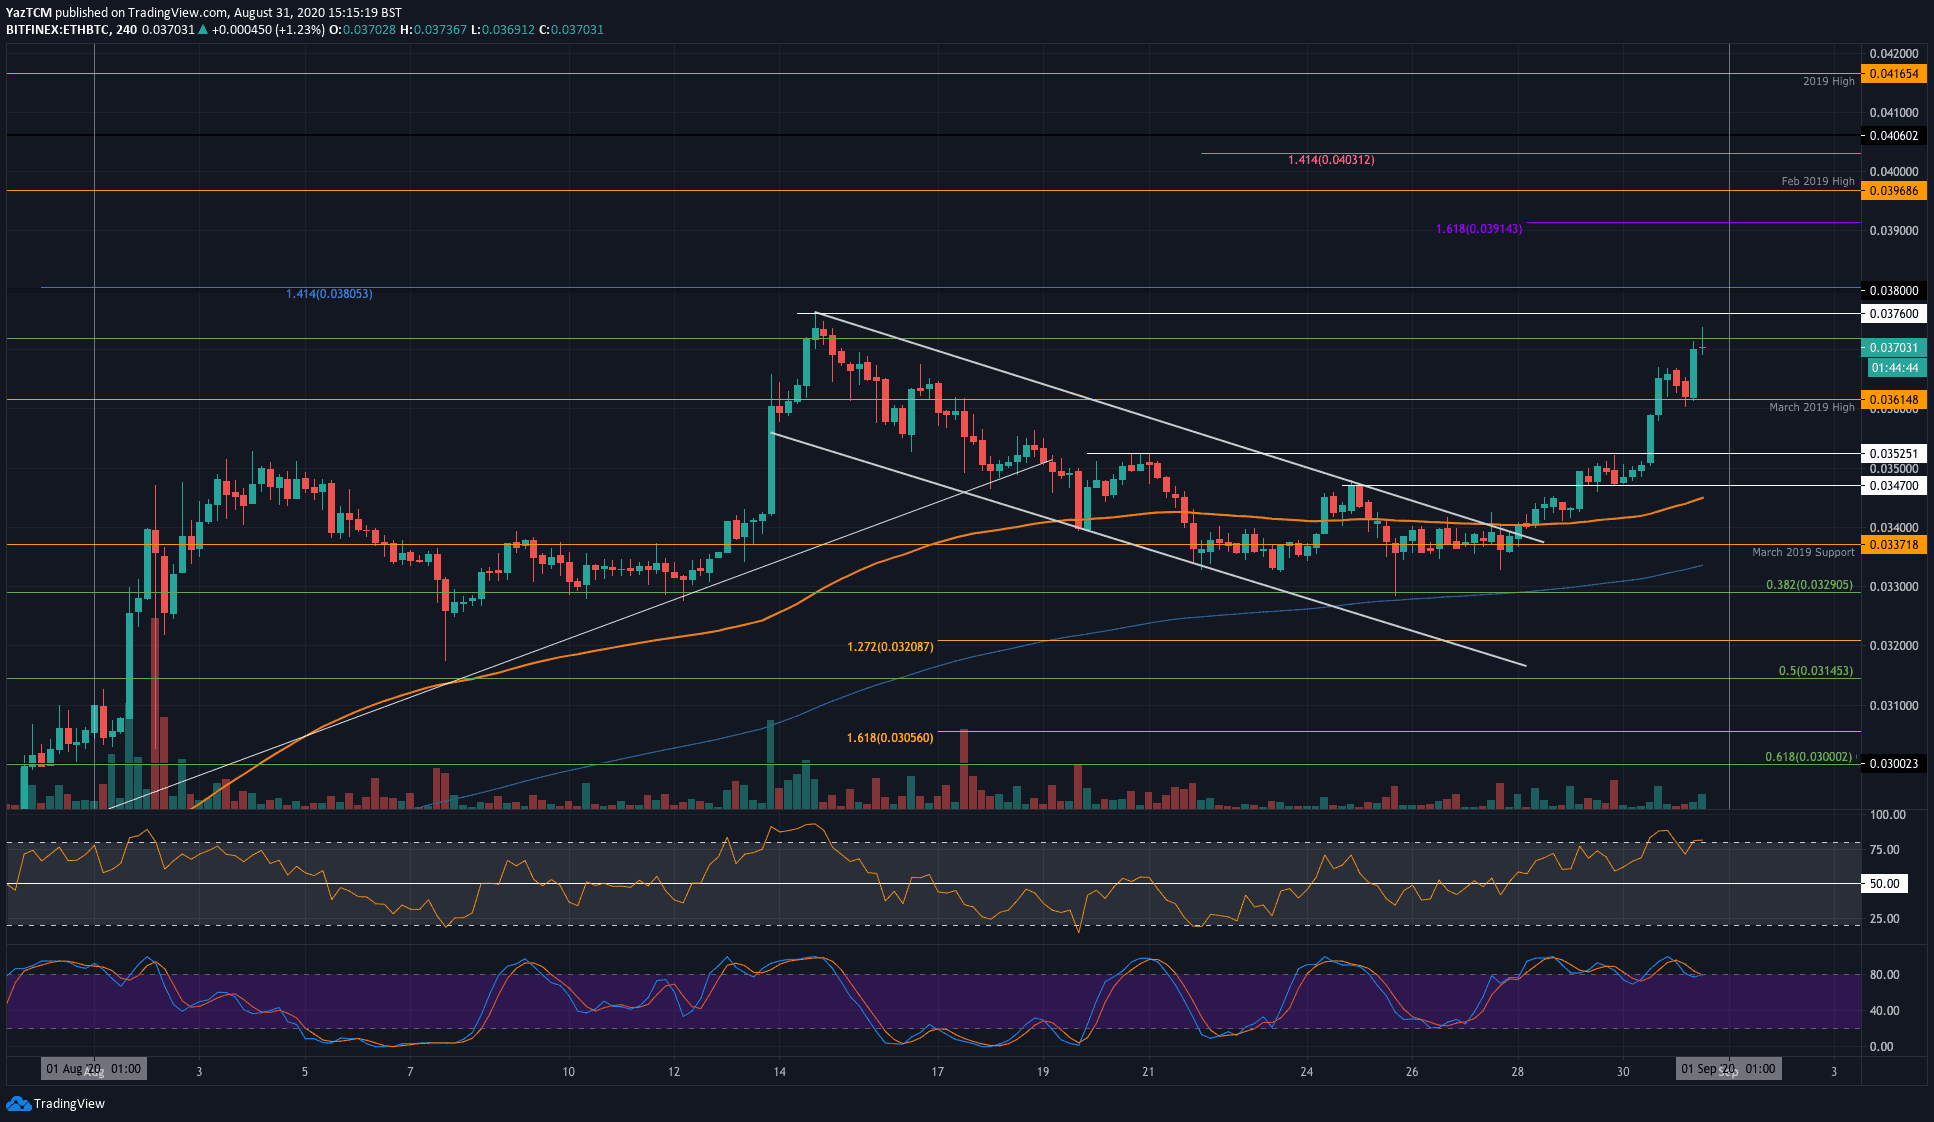
Key Support Levels: 0.0361 BTC, 0.0352 BTC, 0.0337 BTC.
Key Resistance Levels: 0.0376 BTC BTC, 0.038 BTC, 0.0391 BTC.
Ethereum was trading within the confines of a falling price channel against Bitcoin toward the end of last week. Over the weekend, Ethereum penetrated above 0.034 BTC as it climbed toward the upside of this falling channel.
Since the break, Ethereum moved higher as it passed the resistance at 0.035 BTC and 0.0361 BTC (March 2019 Highs) to reach the current 0.0372 BTC resistance. This price level caused Ethereum to stall and reverse on the daily charts during mid-August and, therefore will require a strong push of momentum to break on the second attempt.
Looking ahead, once the 4HR candle closes above 0.0372 BTC, near resistance lies at 0.0376 BTC (2020 highs). Following this, resistance lies at 0.038 BTC, 0.0391 BTC, and 0.04 (Feb 2019 highs).
On the other side, support lies at 0.0361 BTC (March 2019 Highs), 0.0352 BTC, and 0.0337 BTC (March 2019 Support).
The RSI has reached overbought conditions, and there is a divergence between the RSI and price action that is starting to form, which could signal a potential reversal is ahead.