Ethereum’s price has been on the rise over the last few months, breaking through resistance levels one by one. Yet, the cryptocurrency might have reached a potential turning point.
By TradingRage
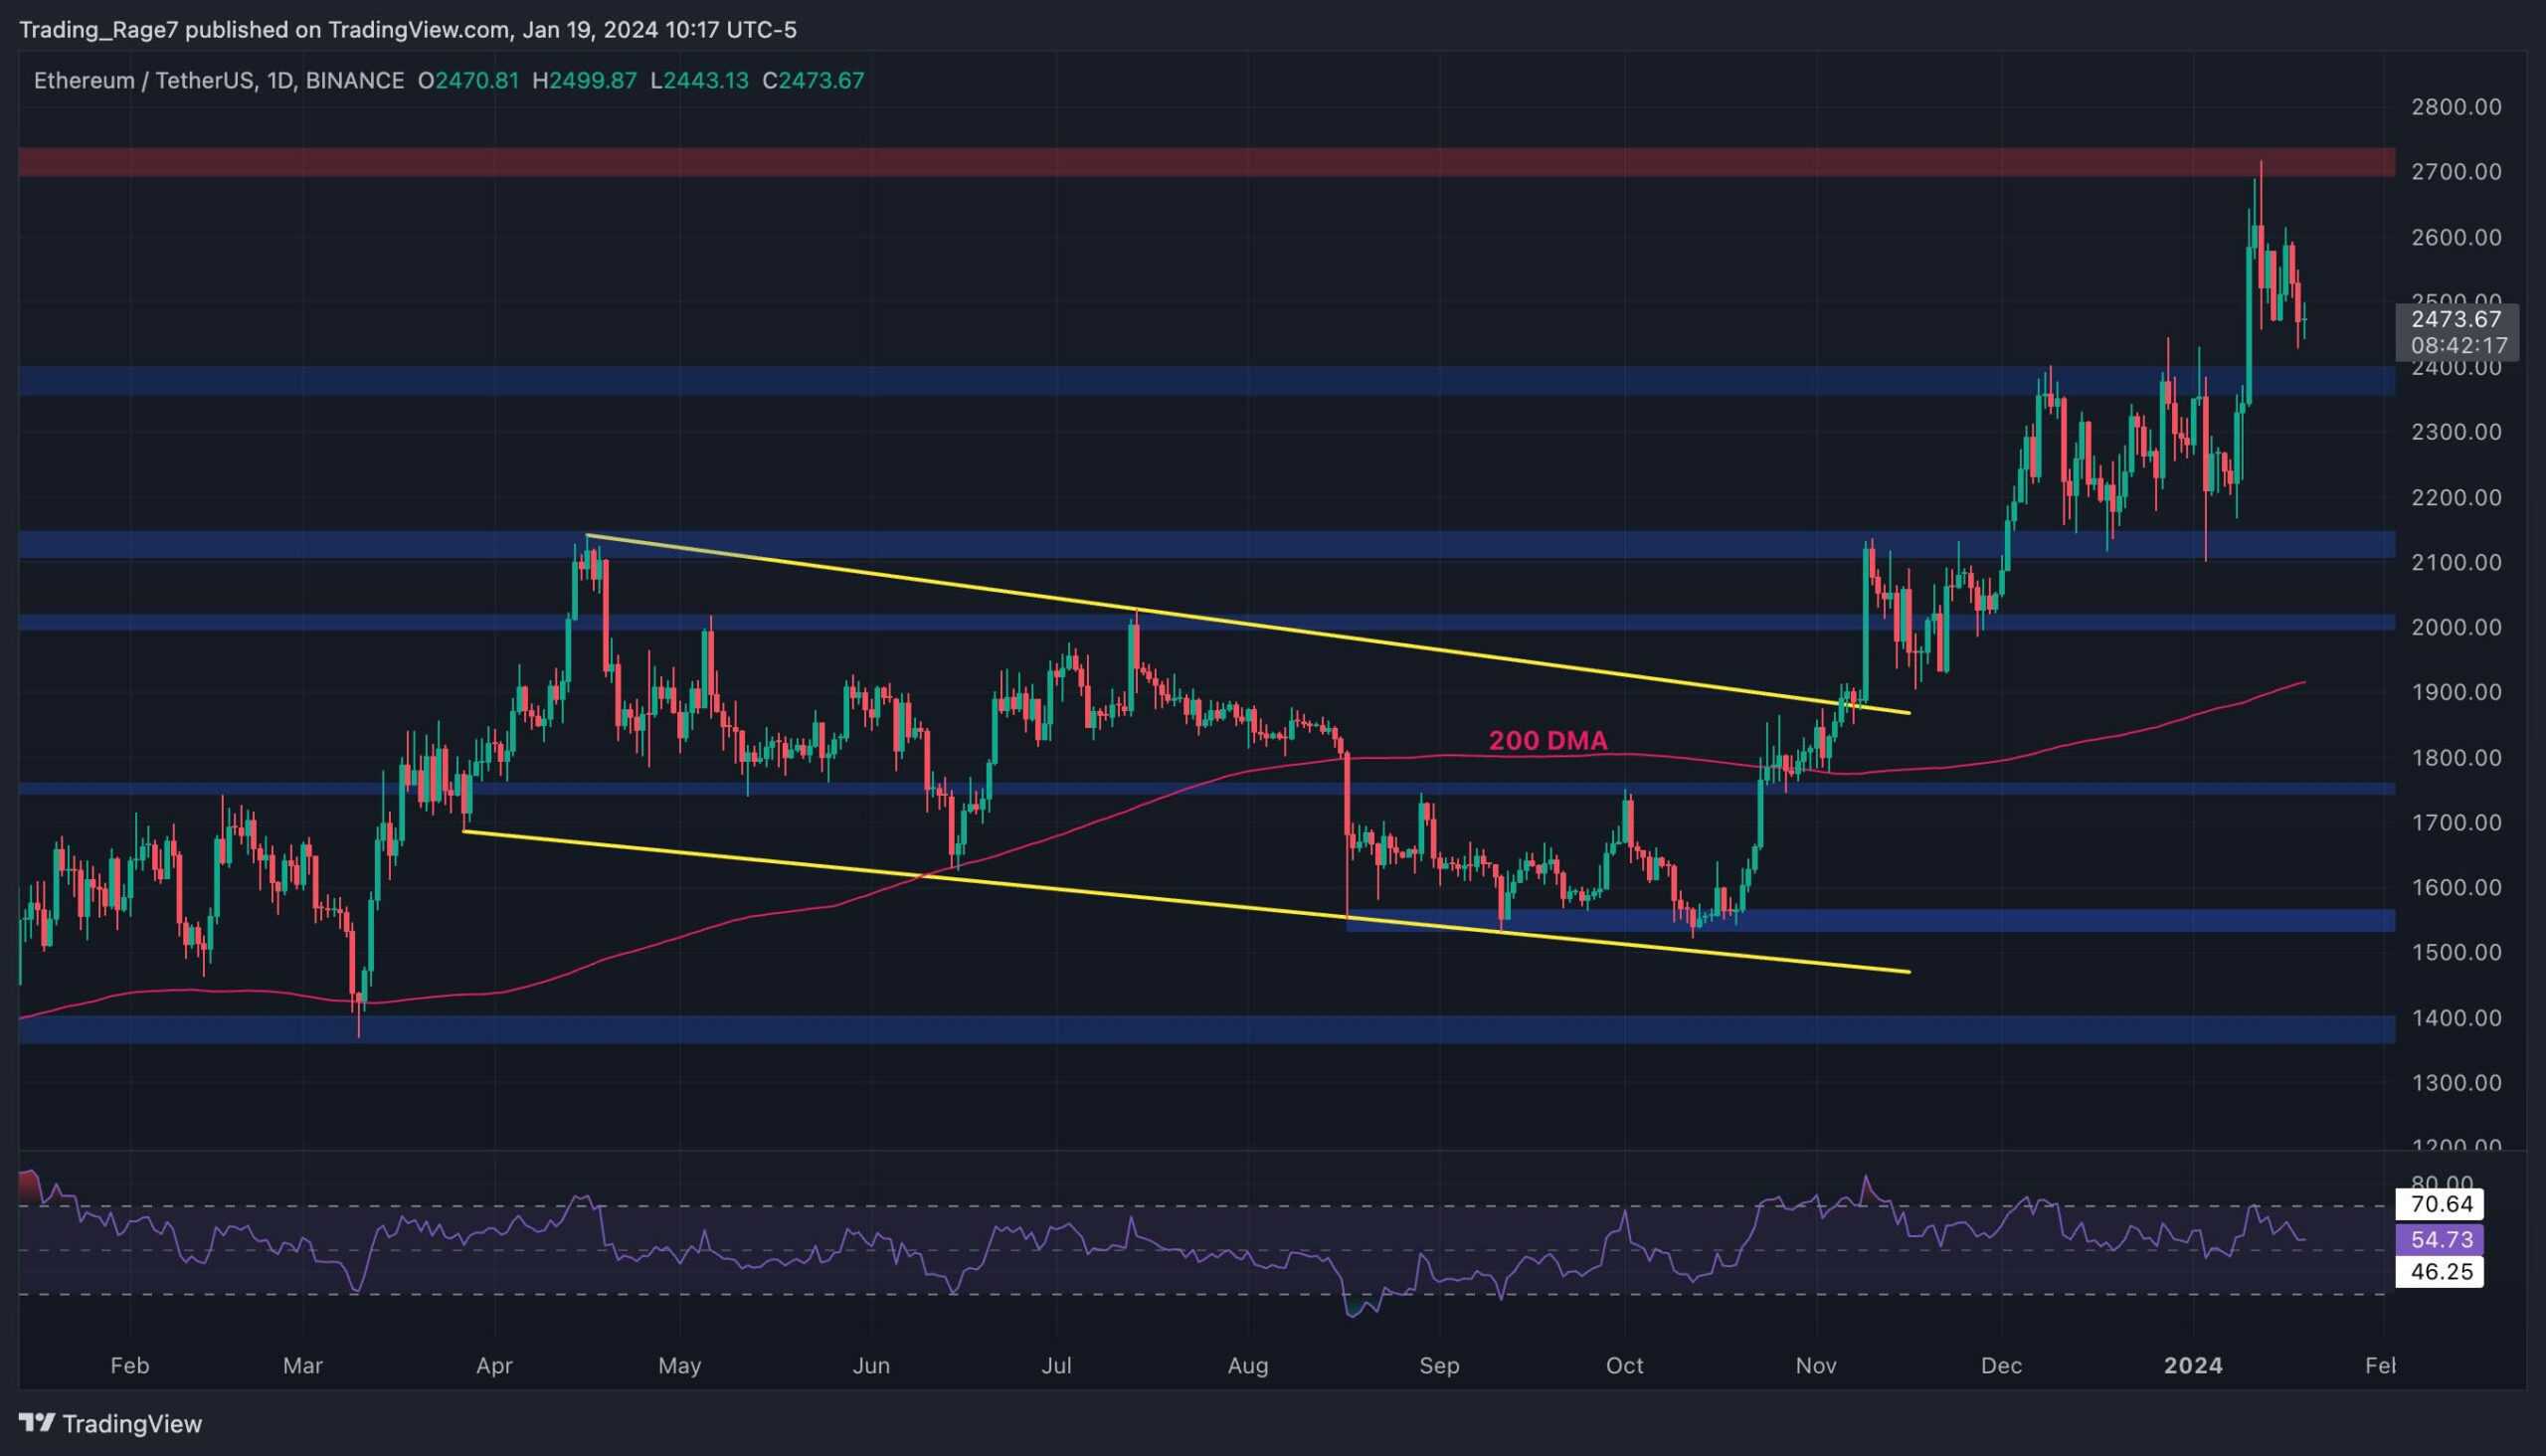
On the daily chart, the market has been acting very bullish since breaking the 200-day moving average to the upside. It has been making consistently higher highs and lows, with the Relative Strength Index showing values above 50% the whole time.
Yet, the $2,700 resistance level decisively rejected the price to the downside last week. The market is currently consolidating below the mentioned level. Meanwhile, considering the availability of several support levels, investors can still be optimistic about the short-term trend.
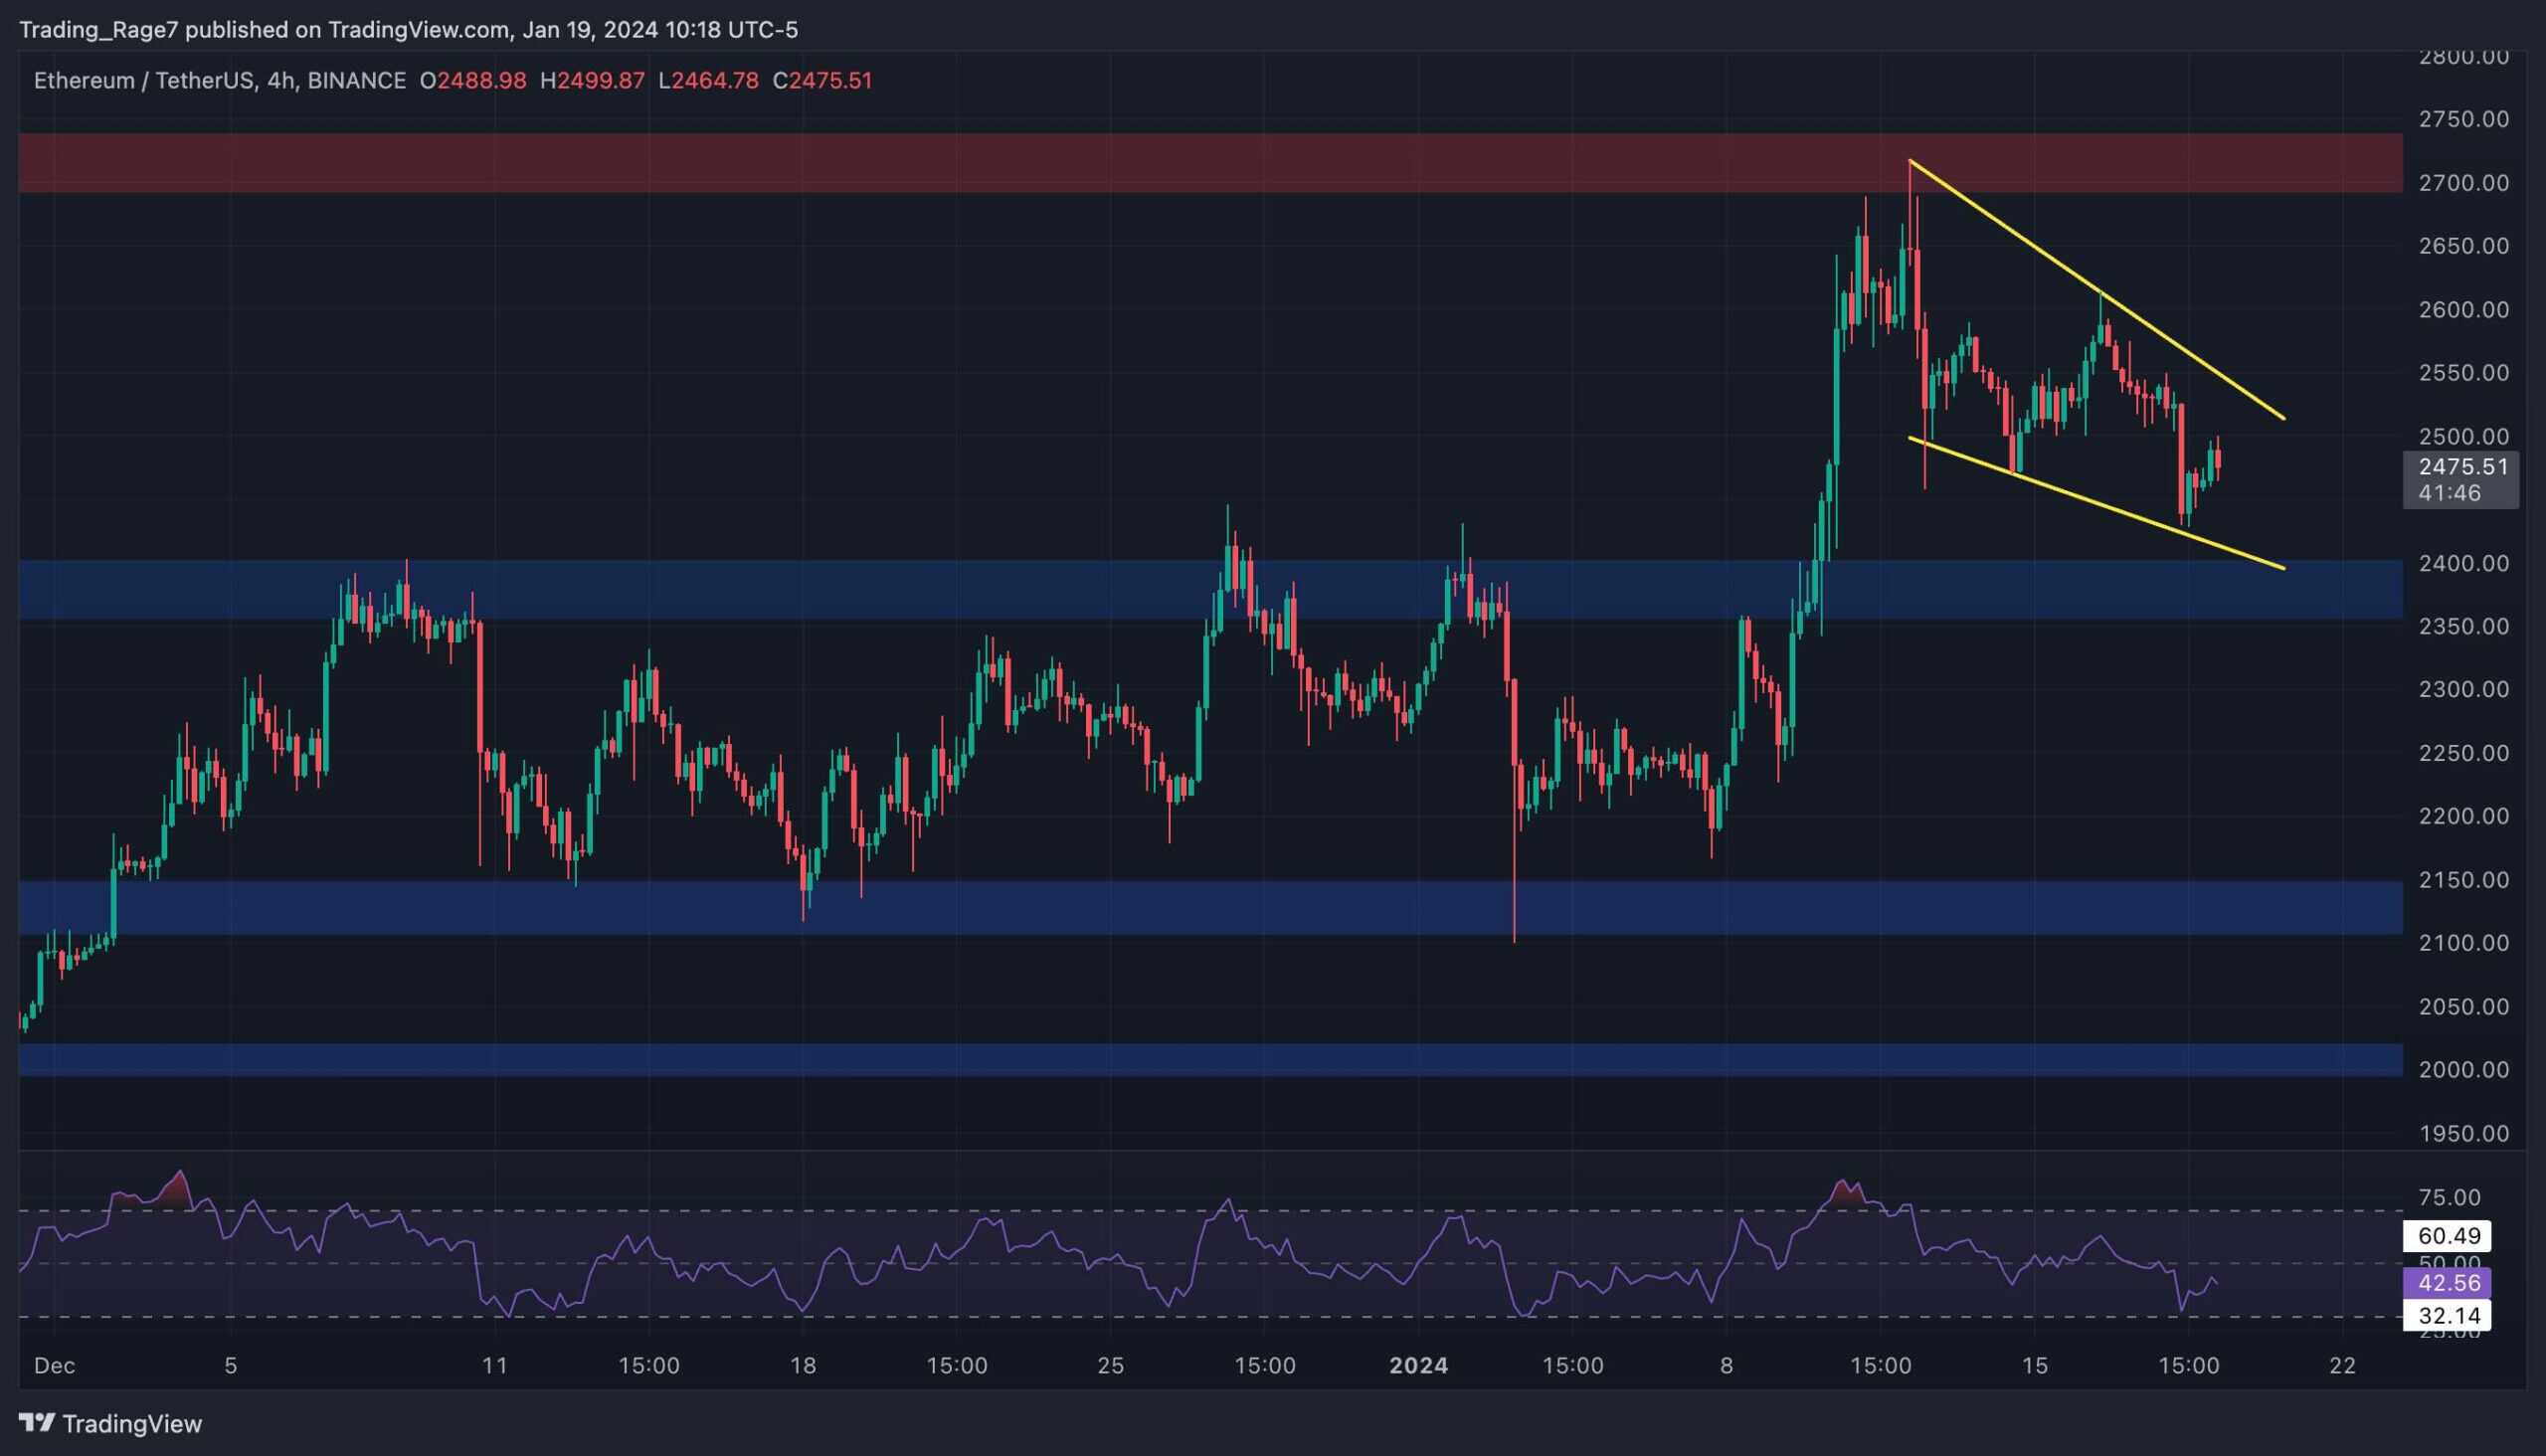
The 4-hour chat paints a more clear picture of the recent price action. The cryptocurrency has been forming a falling wedge pattern since failing to break above the $2,700 resistance area.
A bullish breakout from the wedge can result in a retest of the $2,700 level, while a breakdown would be catastrophic, as the price could drop toward the $2,100 level in no time.
By TradingRage
While Ethereum’s price has been gaining momentum on the upside, market participants have become more optimistic that ETH will eventually make a new all-time high this year. Yet, too much optimism might be a worrying factor.
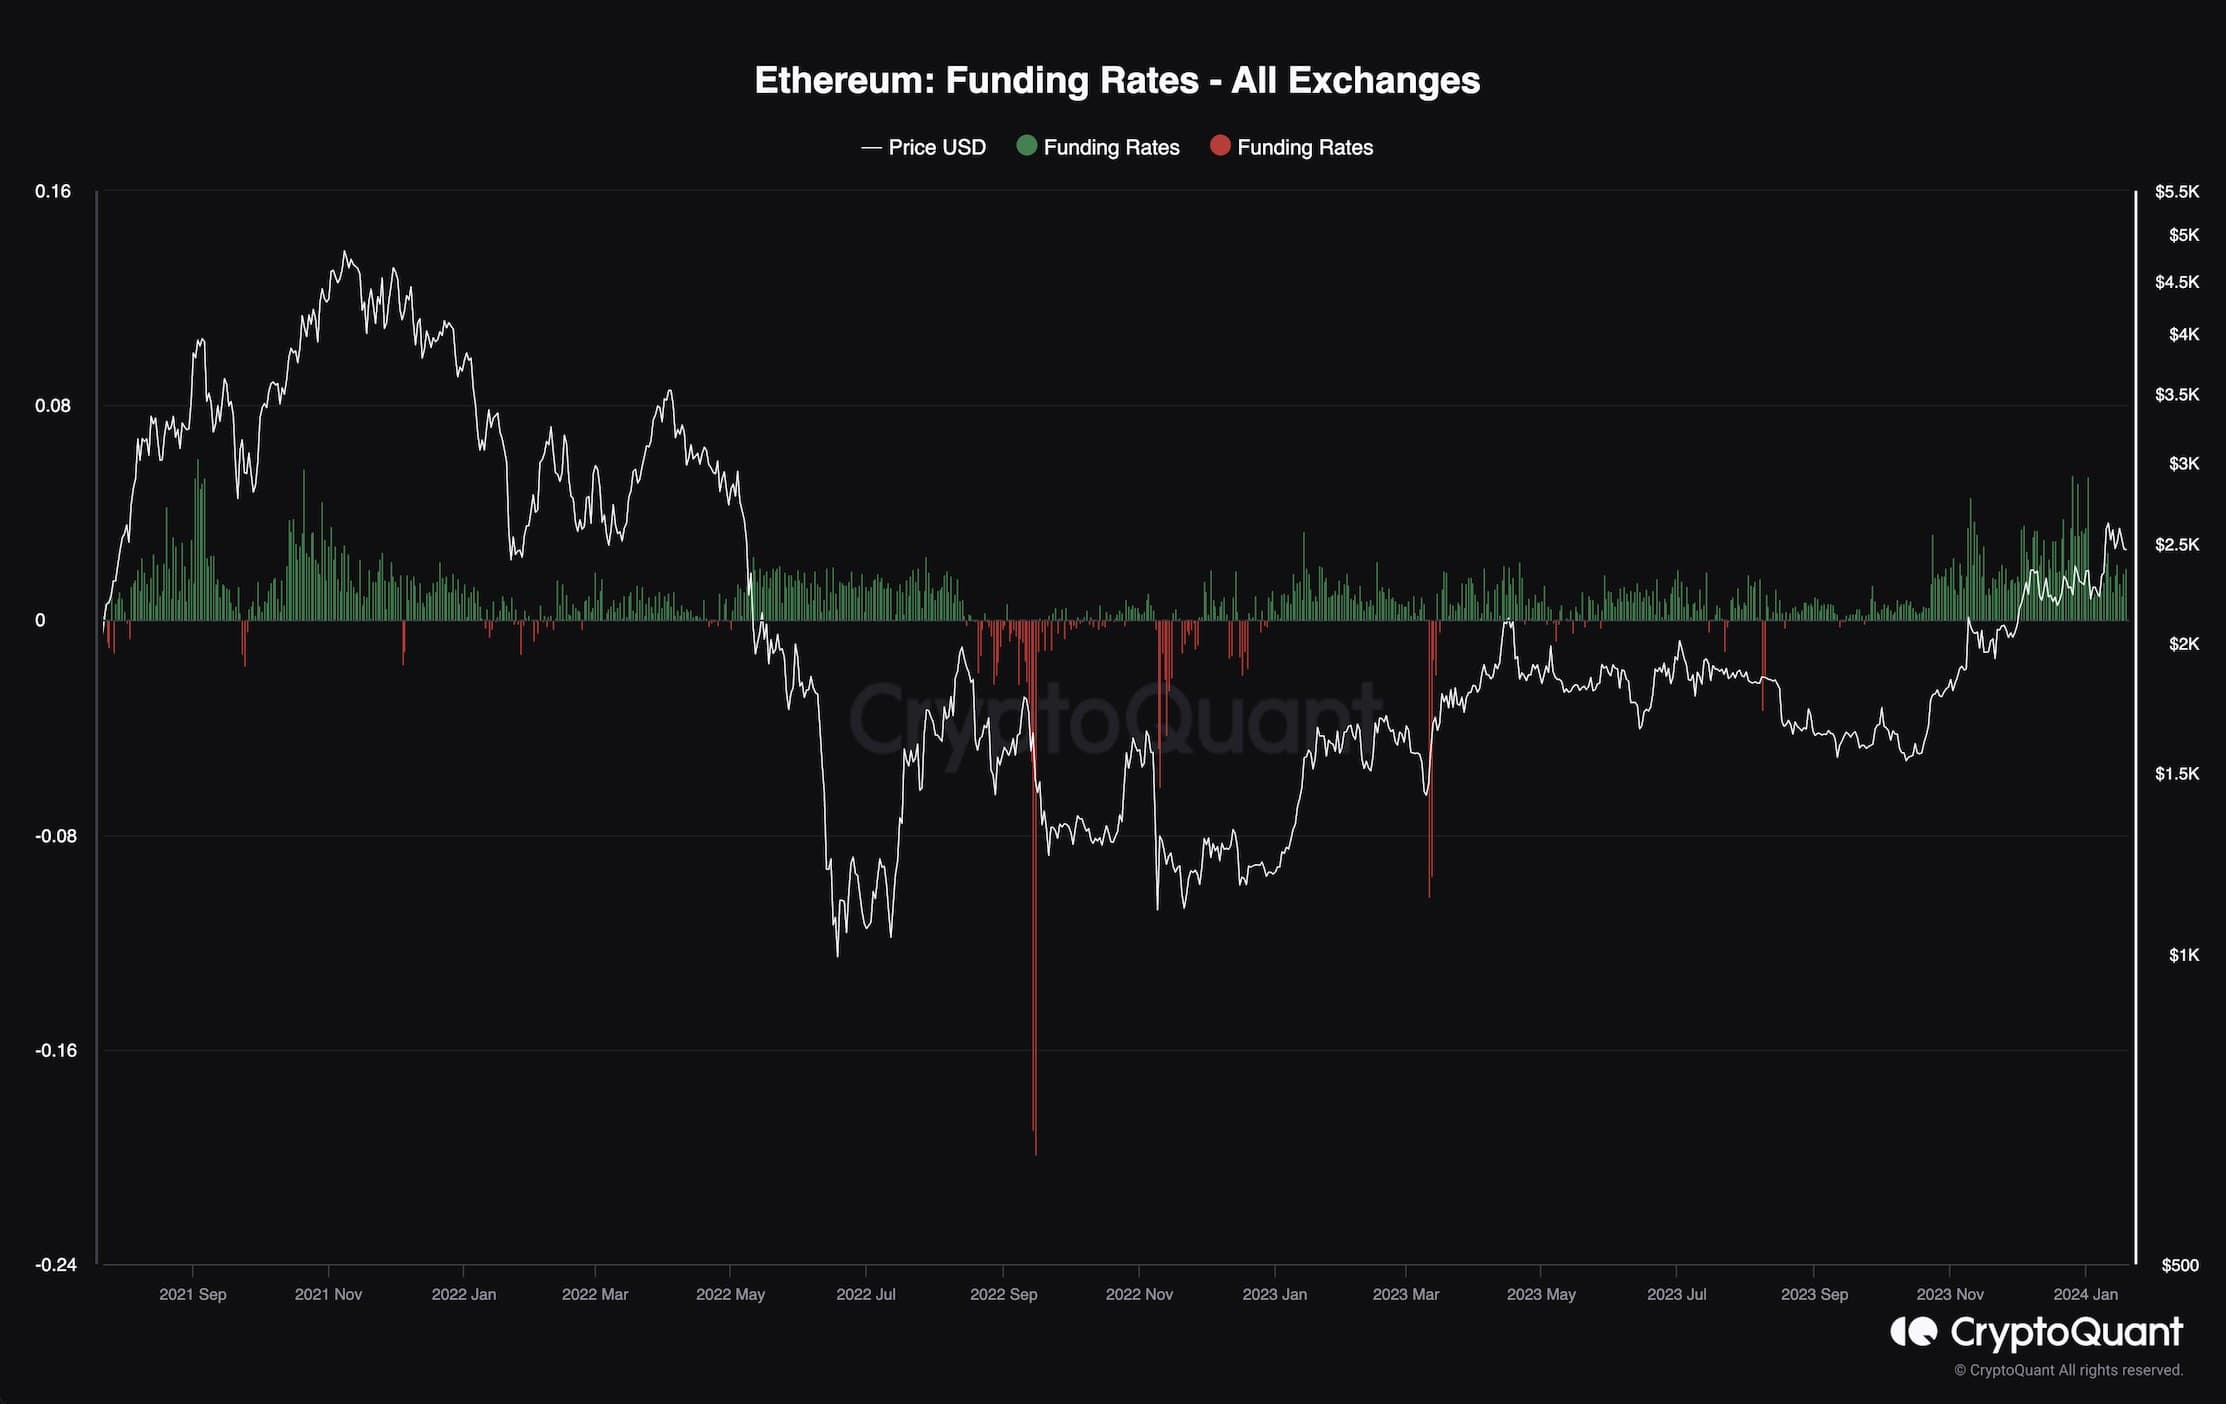
This chart presents the funding rates, one of the key metrics for futures market sentiment evaluation. Positive values indicate that buyers are more aggressive on aggregate, while negative values demonstrate that short sellers are executing their orders more aggressively.
Analyzing the chart, it is evident that the funding rates have been very positive for a while, showing values comparable to what was previously seen during the $69K all-time high range. As a result, the probability of a long liquidation cascade is very high at the moment. These potential liquidations could lead to a significant drop in the coming weeks.