Key Resistance Levels: $0.0095, $0.0107, $0.011
Key Support Levels: $0.0076, $0.0066, $0.0060
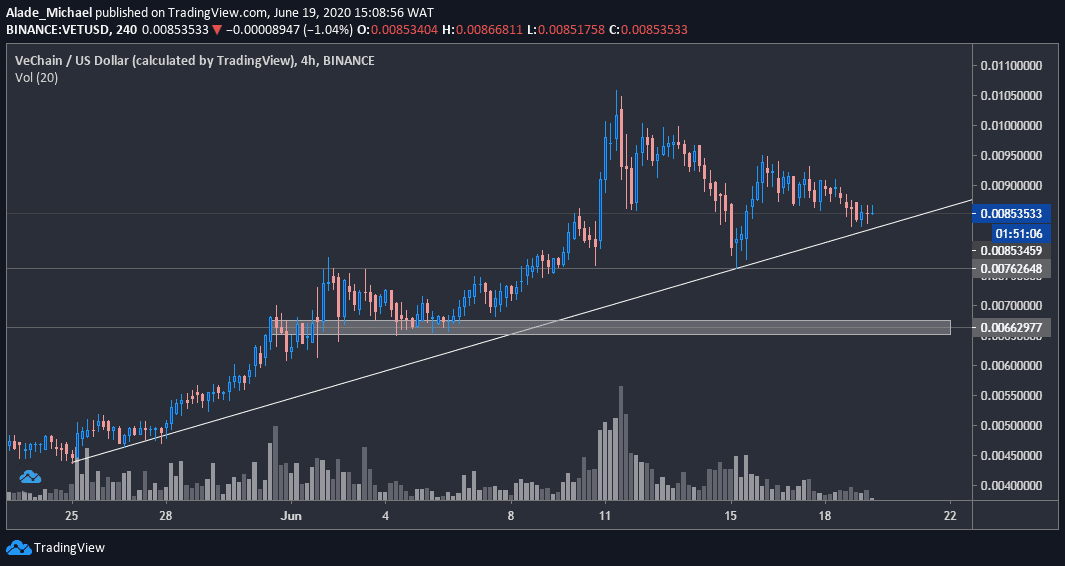
VeChain has lost a major chunk of its value over the last seven days after witnessing a short-term recovery to $0.0106. Despite the correction, the trend remains bullish on a higher time frame, but it is currently looking bearish on the lower time frame.
Following the weekly bounce from $0.0076, VeChain’s price got rejected at $0.0095 and continued to drop to where it’s currently trading at $0.00853 – near a crucial trend line that is acting as support over the past three weeks.
The selling volume is quite low at the moment. Once it increases, the volatility may expand heavily below the current holding rising trend line. However, the price could bounce back if buyers show a strong commitment.
VET is currently down by 3.99%. If the price continues to drop, the $0.0076 level would be the next selling target. The following support area to watch is located at $0.0066. There’s a key psychological level at $0.006 in case of a further drop.
Recovery from the current trading level could rekindle bulls’ hope again. The first resistance level to watch is the weekly high of $0.0095, followed by $0.00107. Above this resistance lies $0.0011 before the price breaks further.
Key Resistance Levels: 93 SAT, 100 SAT, 108 SAT
Key Support Levels: 88 SAT, 80 SAT, 68 SAT
After charting highs at 108 SAT and 100 SAT, VeChain dropped slightly off a significant support line – marked yellow on the above 4-hours chart – which held bullish actions for the past 21 days.
With 3.45% losses over the past hours, it is currently consolidating around the 92 SAT level as bears plot the next major move. As can be seen on the chart, the trading volume is extremely low at the moment.
In case of a further dip, the closest supports to watch for selling are 88 SAT and 85 SAT levels, followed by the grey areas at 80 SAT. The next grey area to watch is around 68 SAT and 65 SAT in case of a breakdown.
If VeChain reclaims 93 SAT and climbs back above this yellow trend line, the price may revisit the weekly resistance at 100 SAT. The next resistance above this is 108 SAT that was marked as the current monthly high.