Bitcoin’s price is showing signs of recovery as it holds well above the significant $18K support level. The mid-term future of the cryptocurrency- price-wise – could be decided in the next few days, as the market is currently testing key levels.
By: Edris
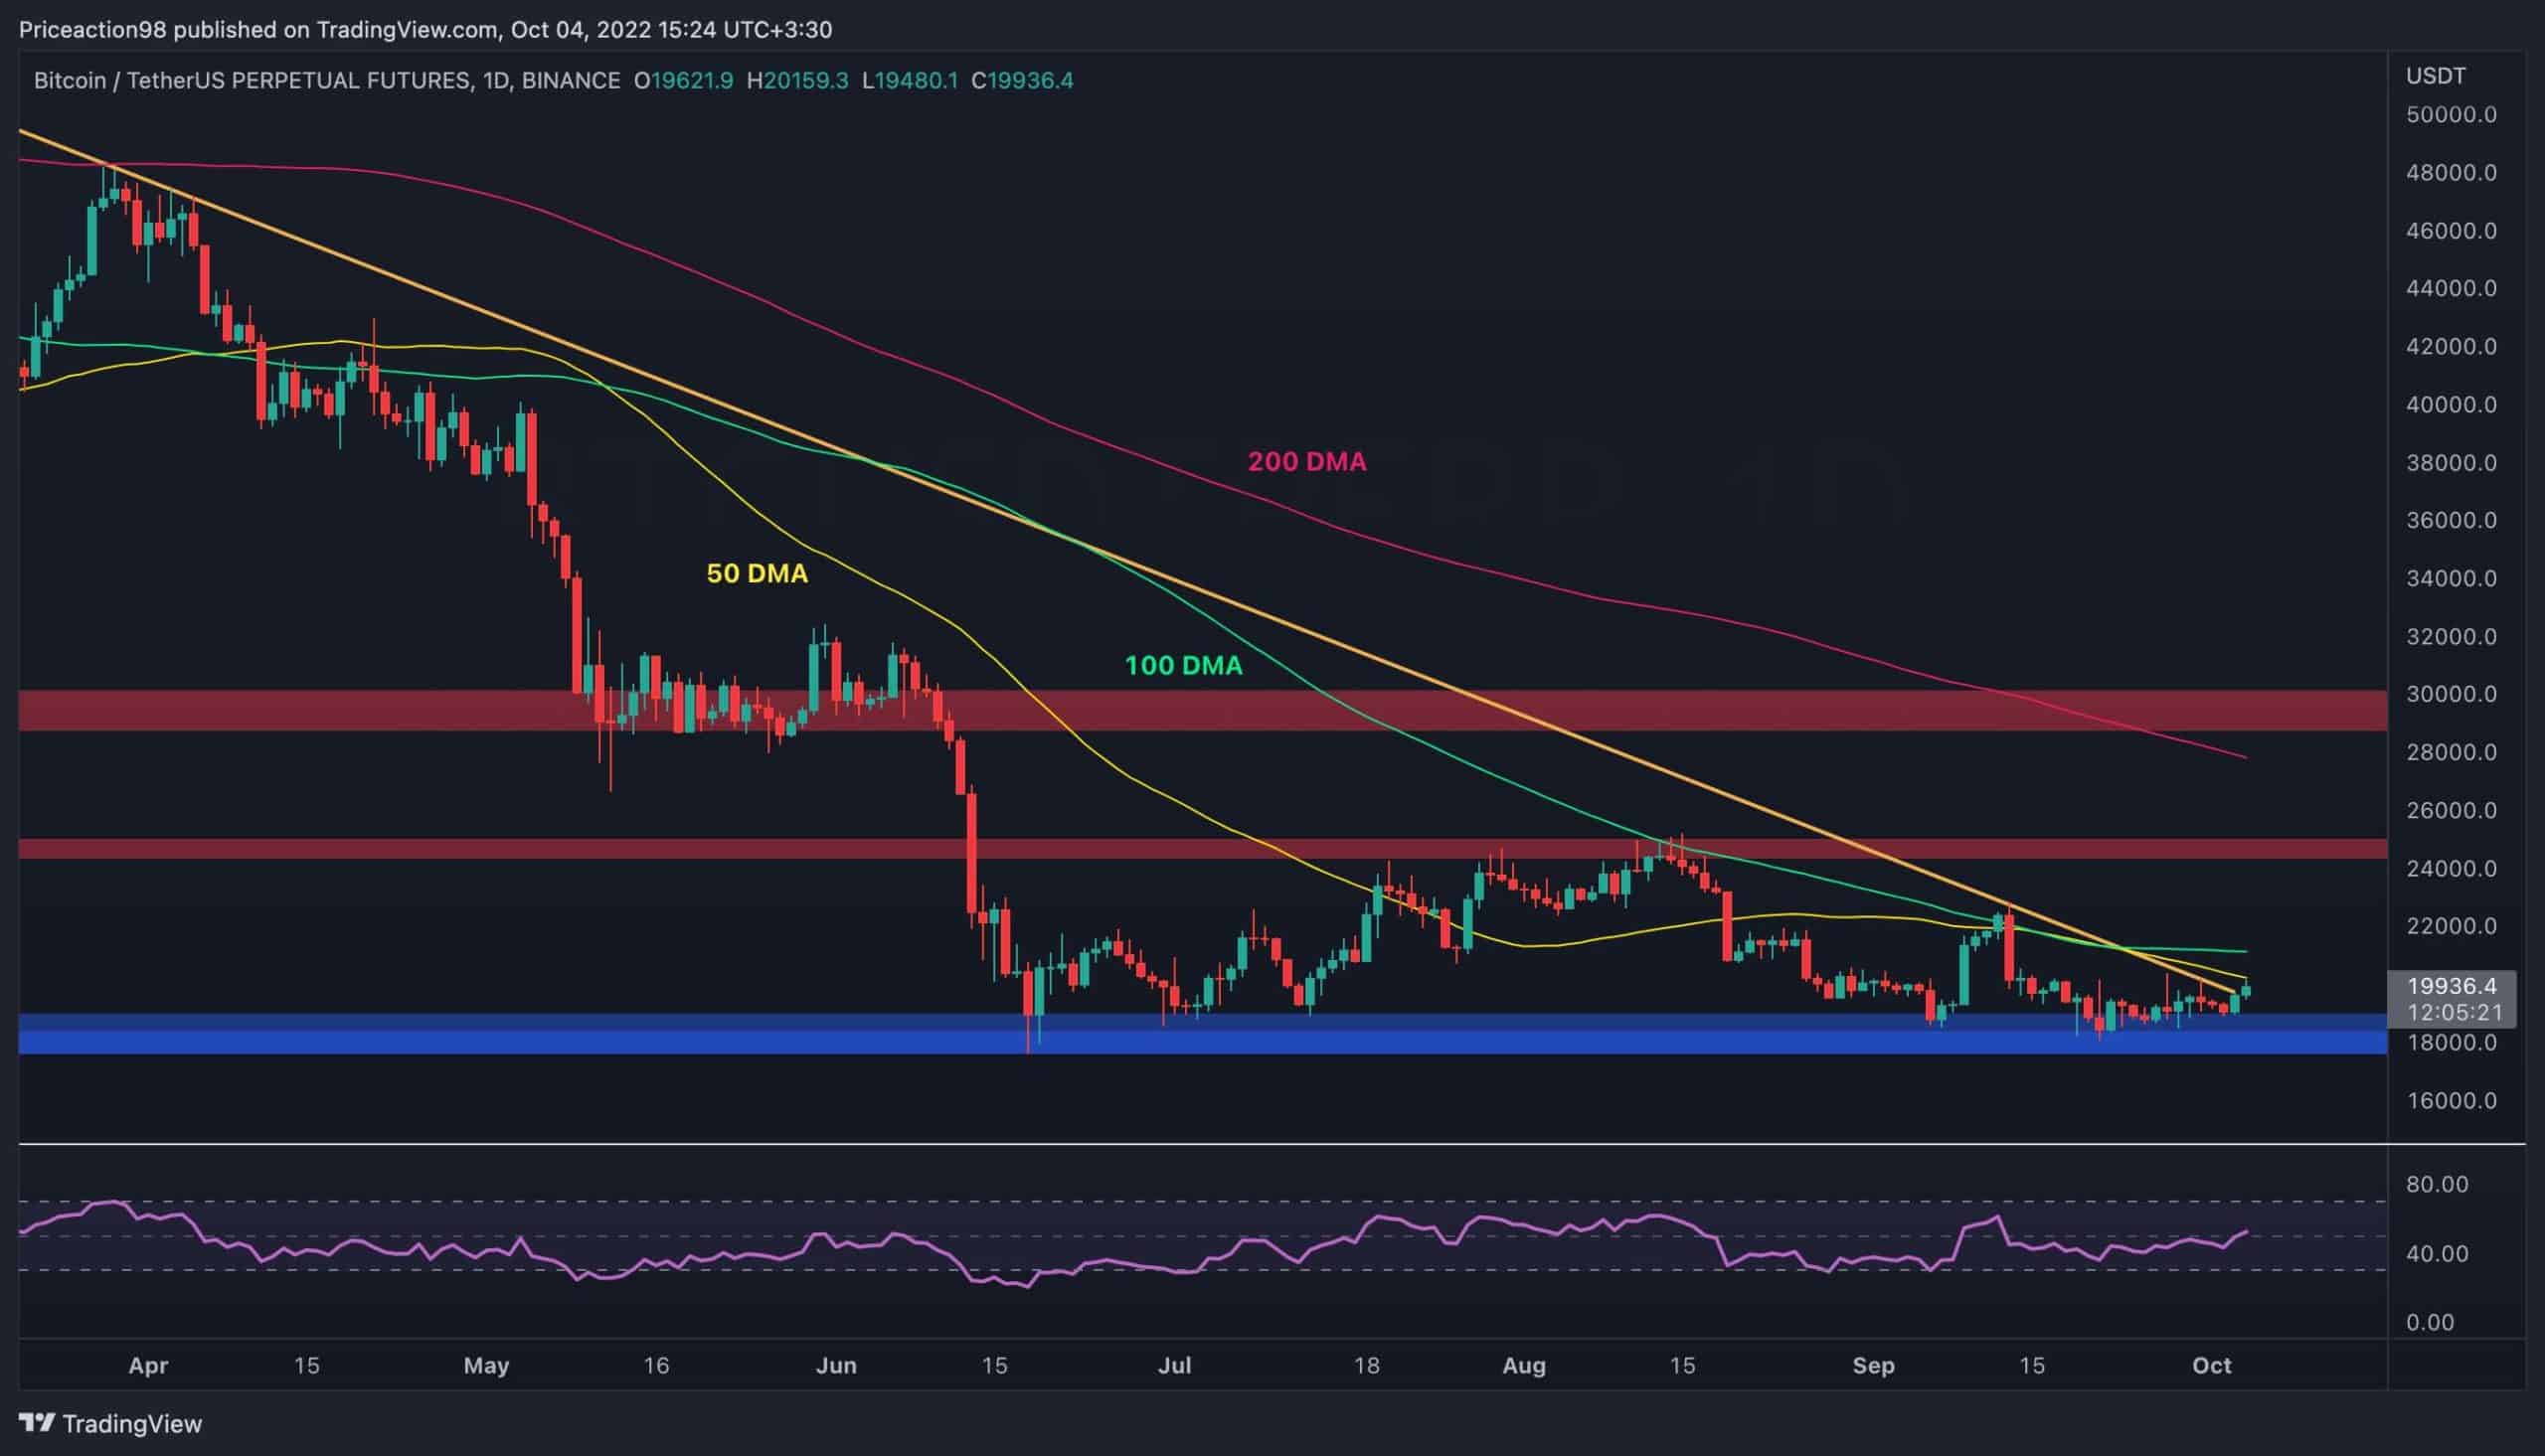
The $18K support level has prevented the cryptocurrency from making a new lower low once again. The market has rebounded from this level and is breaking above the significant bearish trendline of around $19K.
The 50-day and 100-day moving average lines are the next dynamic resistance levels. The price needs to move beyond them for the chart to turn bullish in the short term. In the event of a breakout, the $24K resistance level would be the next target, and the price’s reaction there would likely determine the mid-term outline of the crypto asset.
However, there is always the possibility of a fake breakout above the trendline. This could result in the formation of a bull trap, as witnessed on several occasions over recent months.
To conclude, a breakout and retest of the above-mentioned trendline and both moving averages lines would be essential for a more reliable bullish trend.
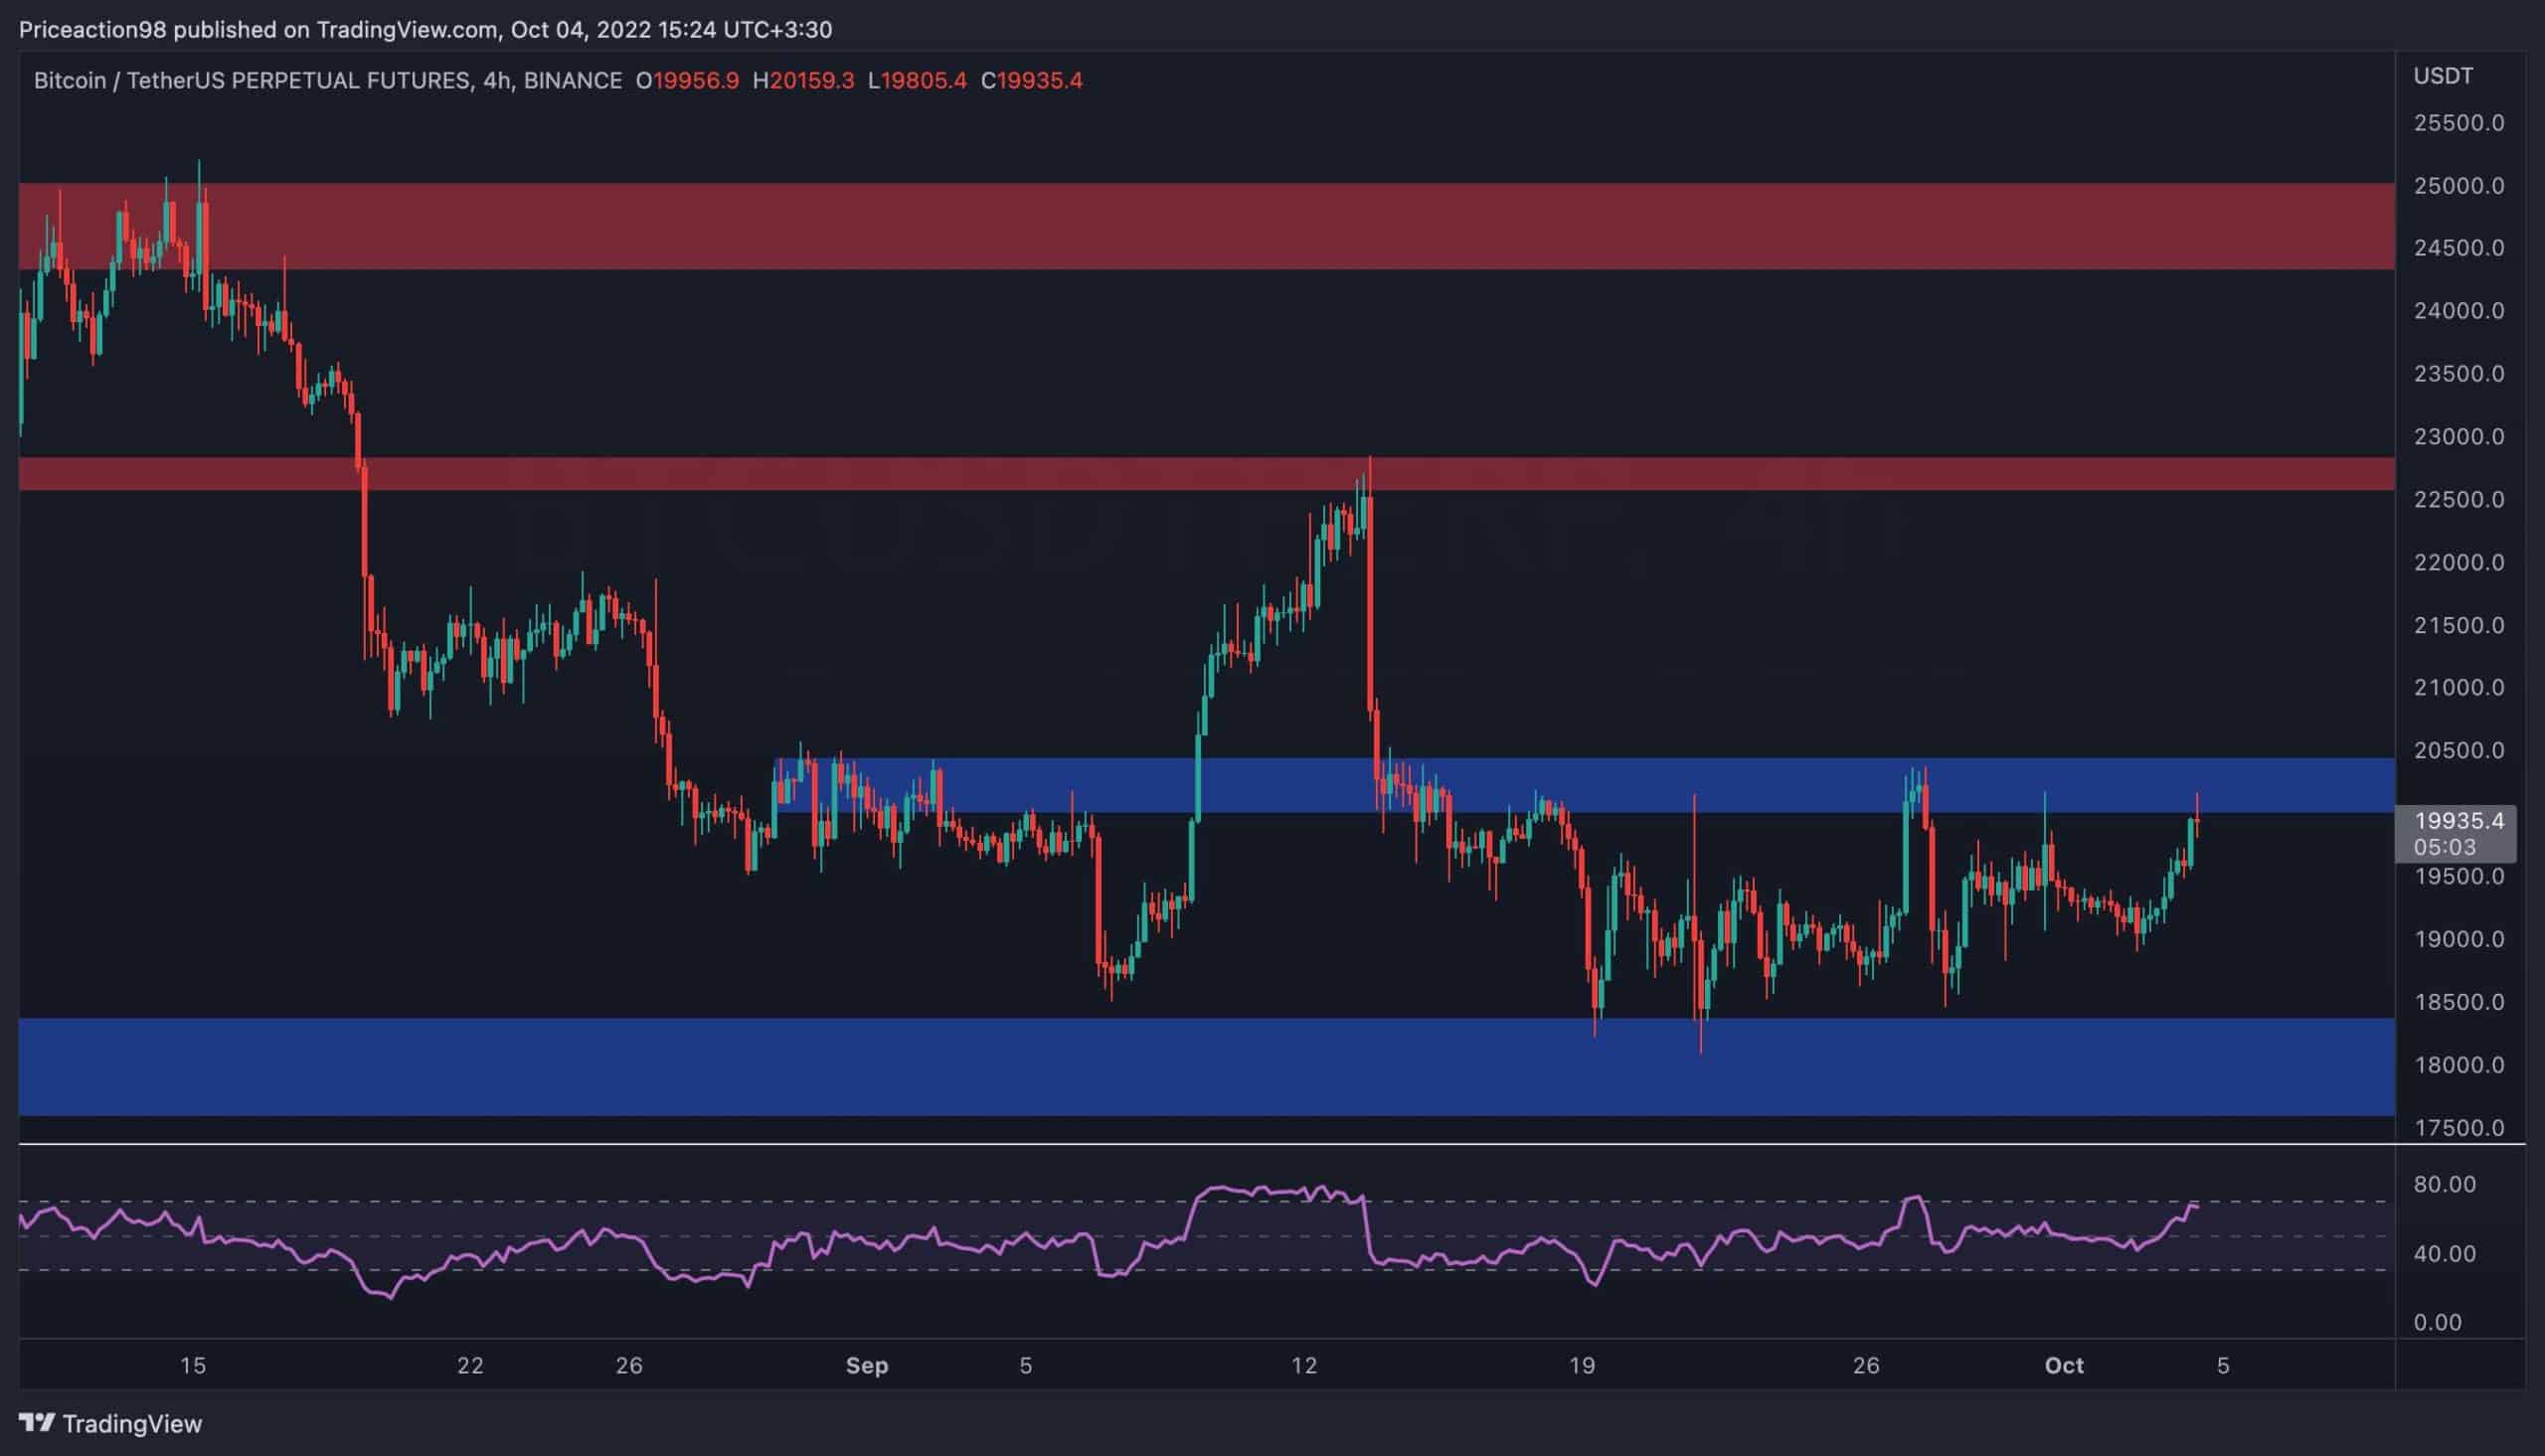
On the 4-hour timeframe, there has been minimal change as the price is still oscillating in a tight horizontal range between the $18K and $20K levels. Currently, the $20K resistance is being tested again, and there is difficulty rejecting the price to the downside.
In the event of a bullish breakout, the $23K level would be the next likely destination. However, considering that the RSI indicator is entering the over-bought zone above 70, there is also a likelihood for a fake breakout and a bull trap to occur – similar to the daily timeframe.
Both the price action and the RSI should be monitored closely in the coming days in order to identify whether a bearish divergence will form or if a valid breakout above the $20K level could be the outcome.
By Shayan
Doubt and uncertainty have plagued the financial markets in 2021. There have been a couple of very unstable periods brought on by inflation, as well as broader geopolitical unrest.
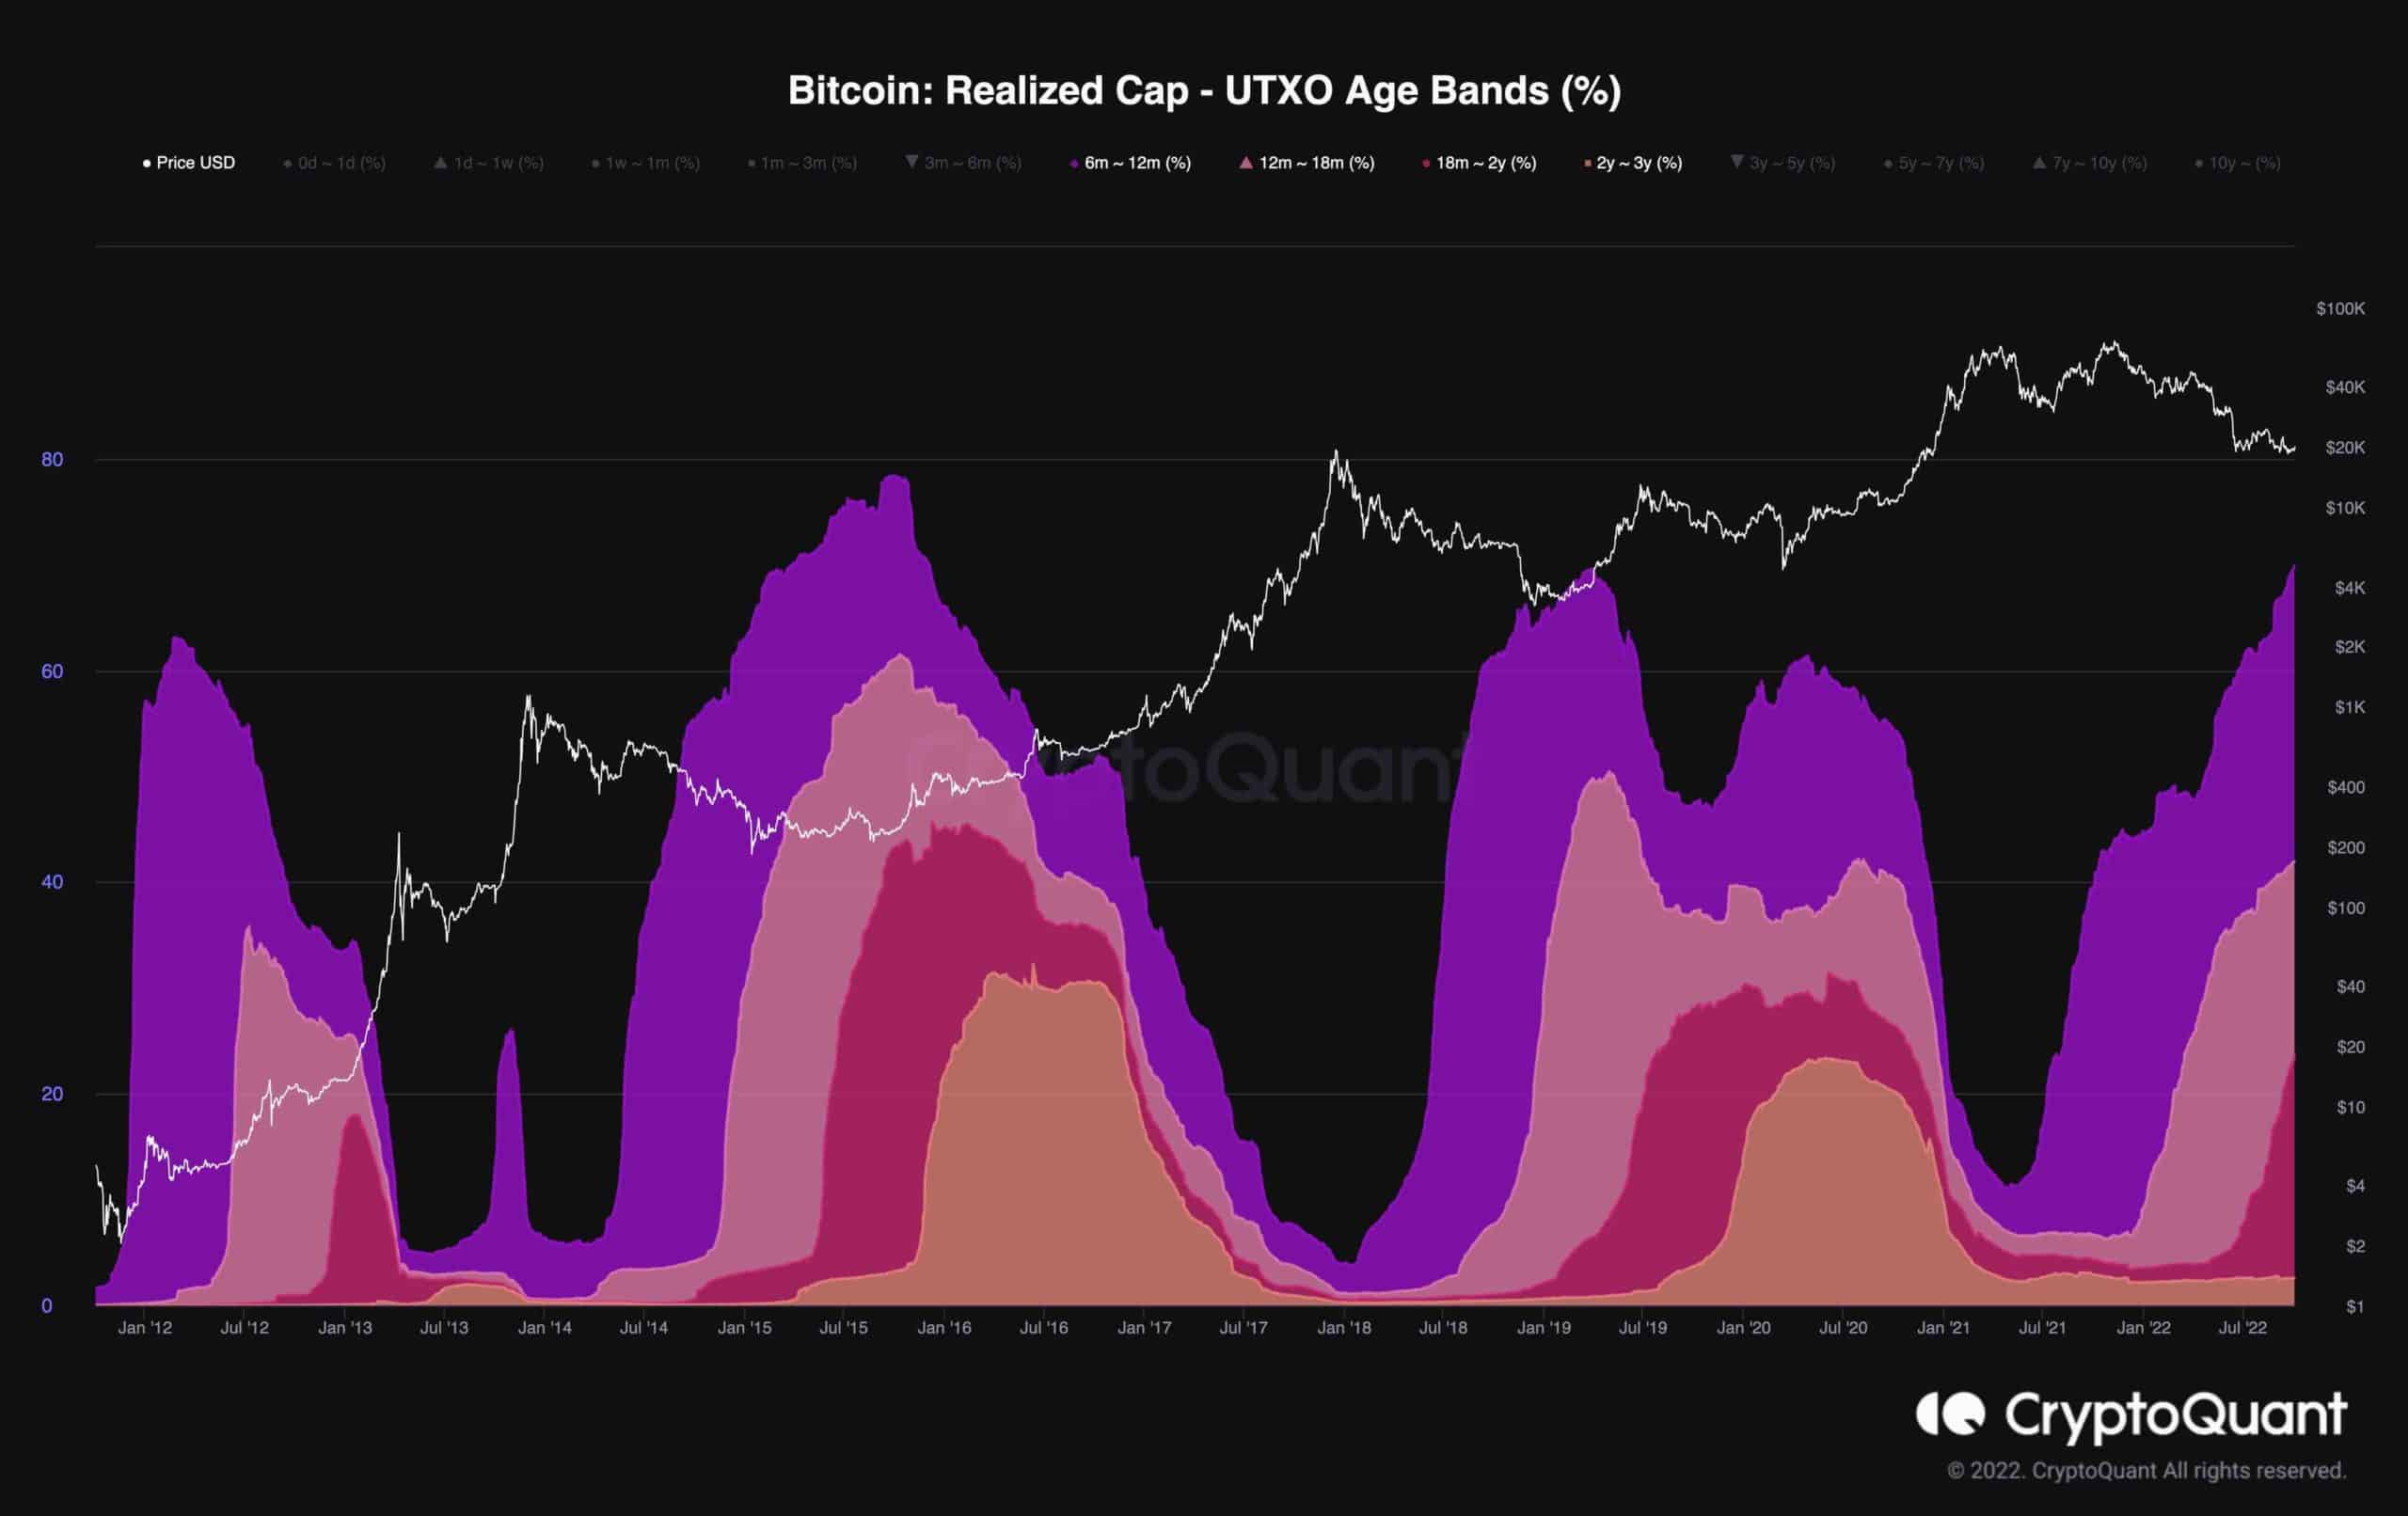
The chart below illustrates Bitcoin’s supply dynamics based on the Realized Cap – UTXO Age Bands (%) metric. This particular metric unifies coin groups based on their lifespan and their share of the total realized cap.
A surge in these age bands suggests accumulation among long-term holders. Contrarily, a reduction indicates selling pressure and distribution behavior.
The market is currently in a stage of heavy accumulation, with the number of coins that have moved in the last six months steadily increasing.