The past couple of days have been very exciting for the entire cryptocurrency industry and Bitcoin is no exception. BTC soared towards $24K today on news of slowing down inflation in the US. The question is if this will be enough for the critical resistance level to finally fall.
By: Shayan
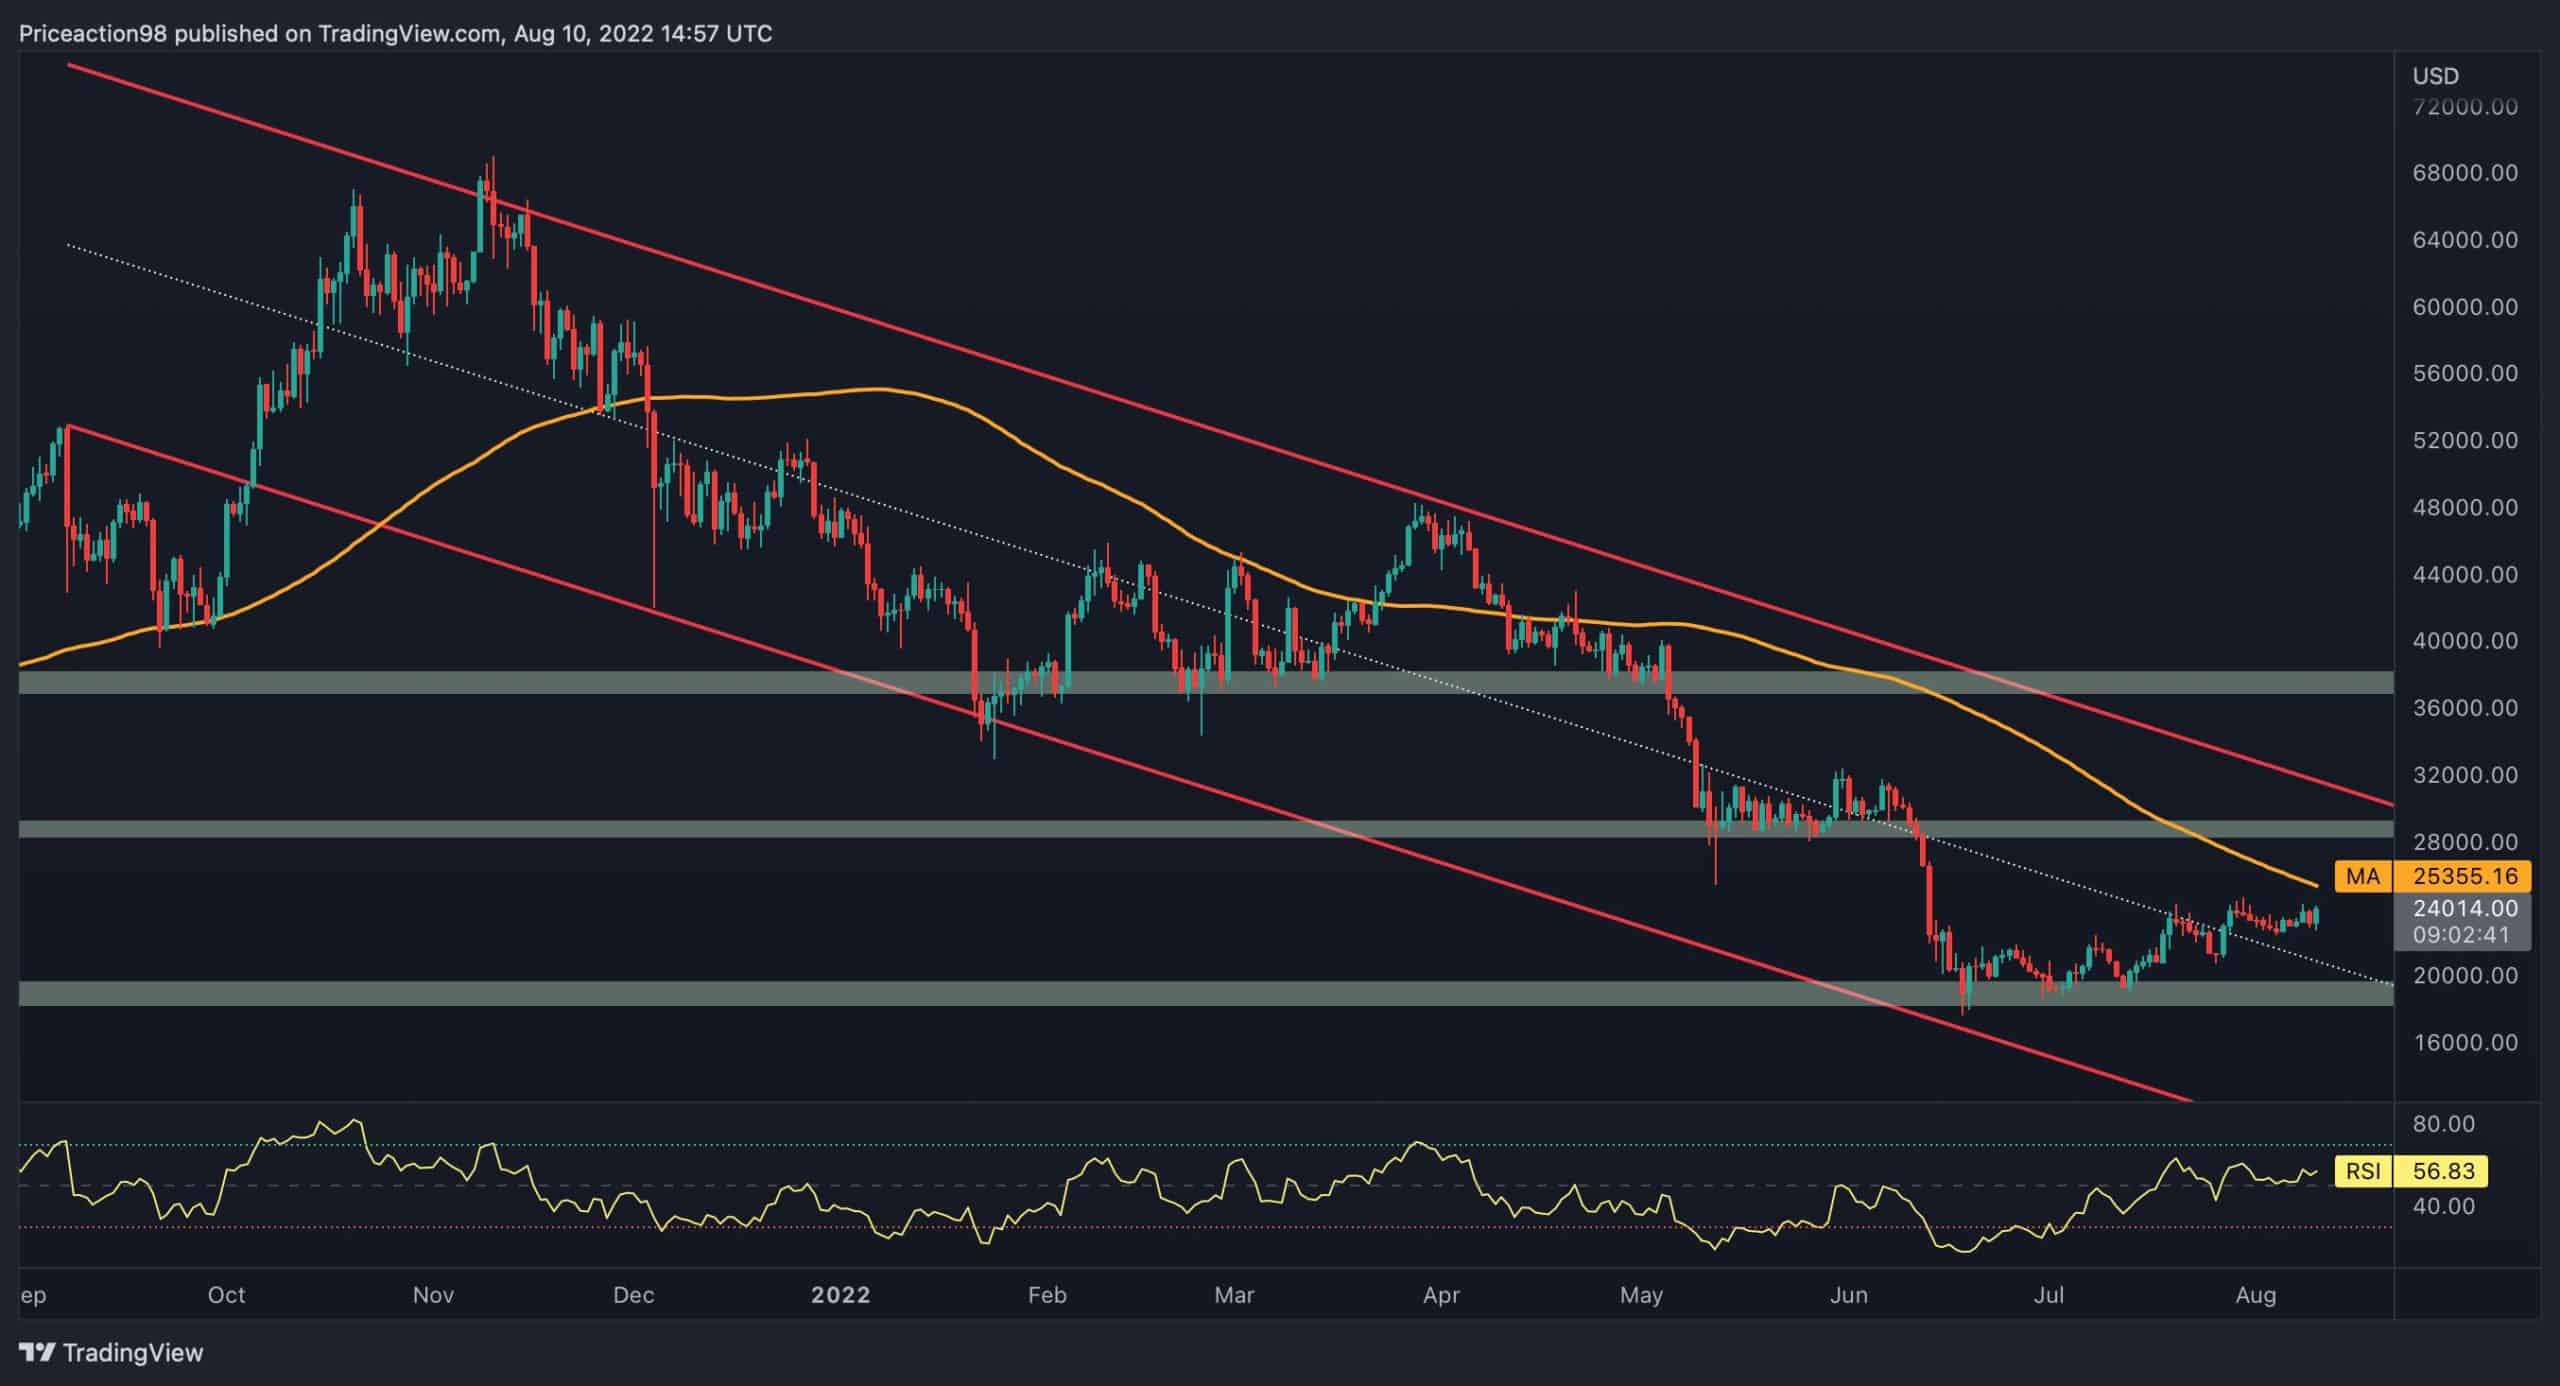
The 100-day moving average is one of the most crucial levels for Bitcoin; it can be interpreted as a resistance or support line. This is dependent on whether the price is above or below the MA. During the recent significant shakeout, the price dropped once again, falling below this effective moving average. It has now retraced to the broken level at roughly $24K.
If Bitcoin succeeds in surpassing this broken level, a climb to the $30K resistance region will be the most probable scenario on the table. In contrast, another leg down will likely occur if the price fails to break the substantial resistance.
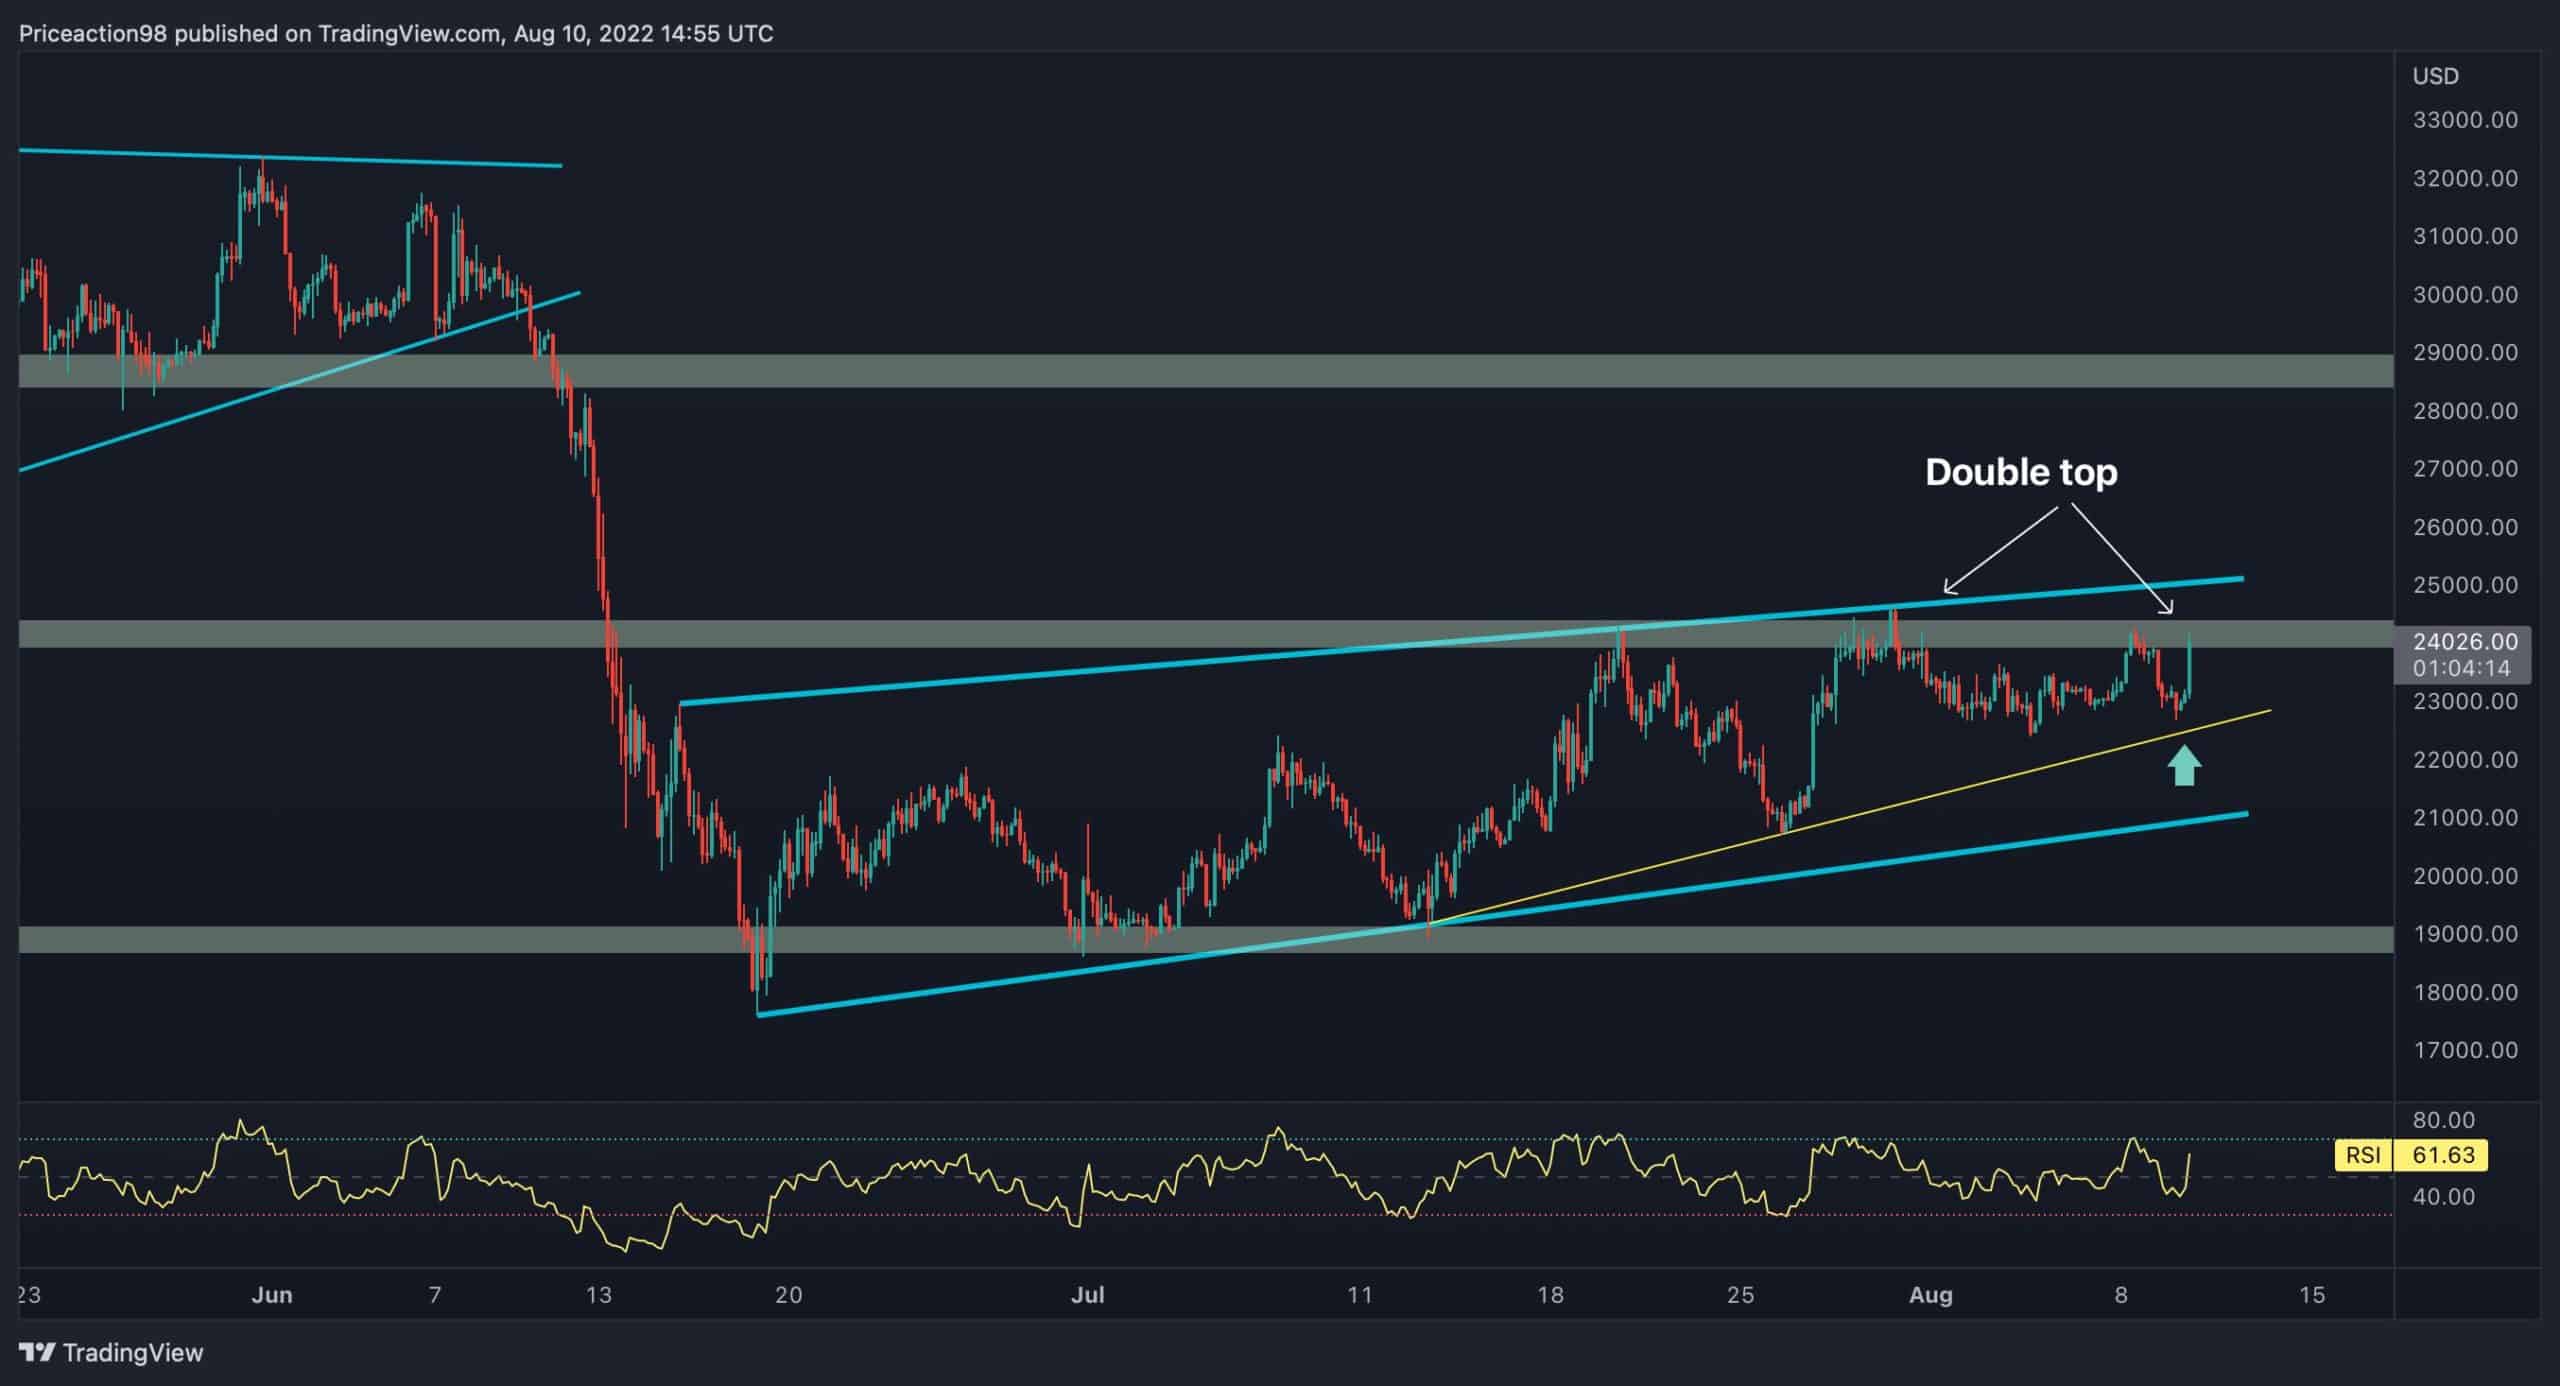
Following a bearish expansion decline, the price has formed a well-known classic price action pattern called a wedge. The cryptocurrency strived to break the upper threshold twice yet failed to surpass the wedge’s upper level. The result of that failure is that the price is plunging nominally.
Despite this, a transparent double-top price action pattern – a recognized reversal pattern – can be recognized in Bitcoin’s 4-hour timeframe chart. Considering this, there is potential for Bitcoin to undergo another shakeout to retest the $19K point. If the $19K vital support level fails to hold the price, the next destination will be the $16K mark.
By: Shayan
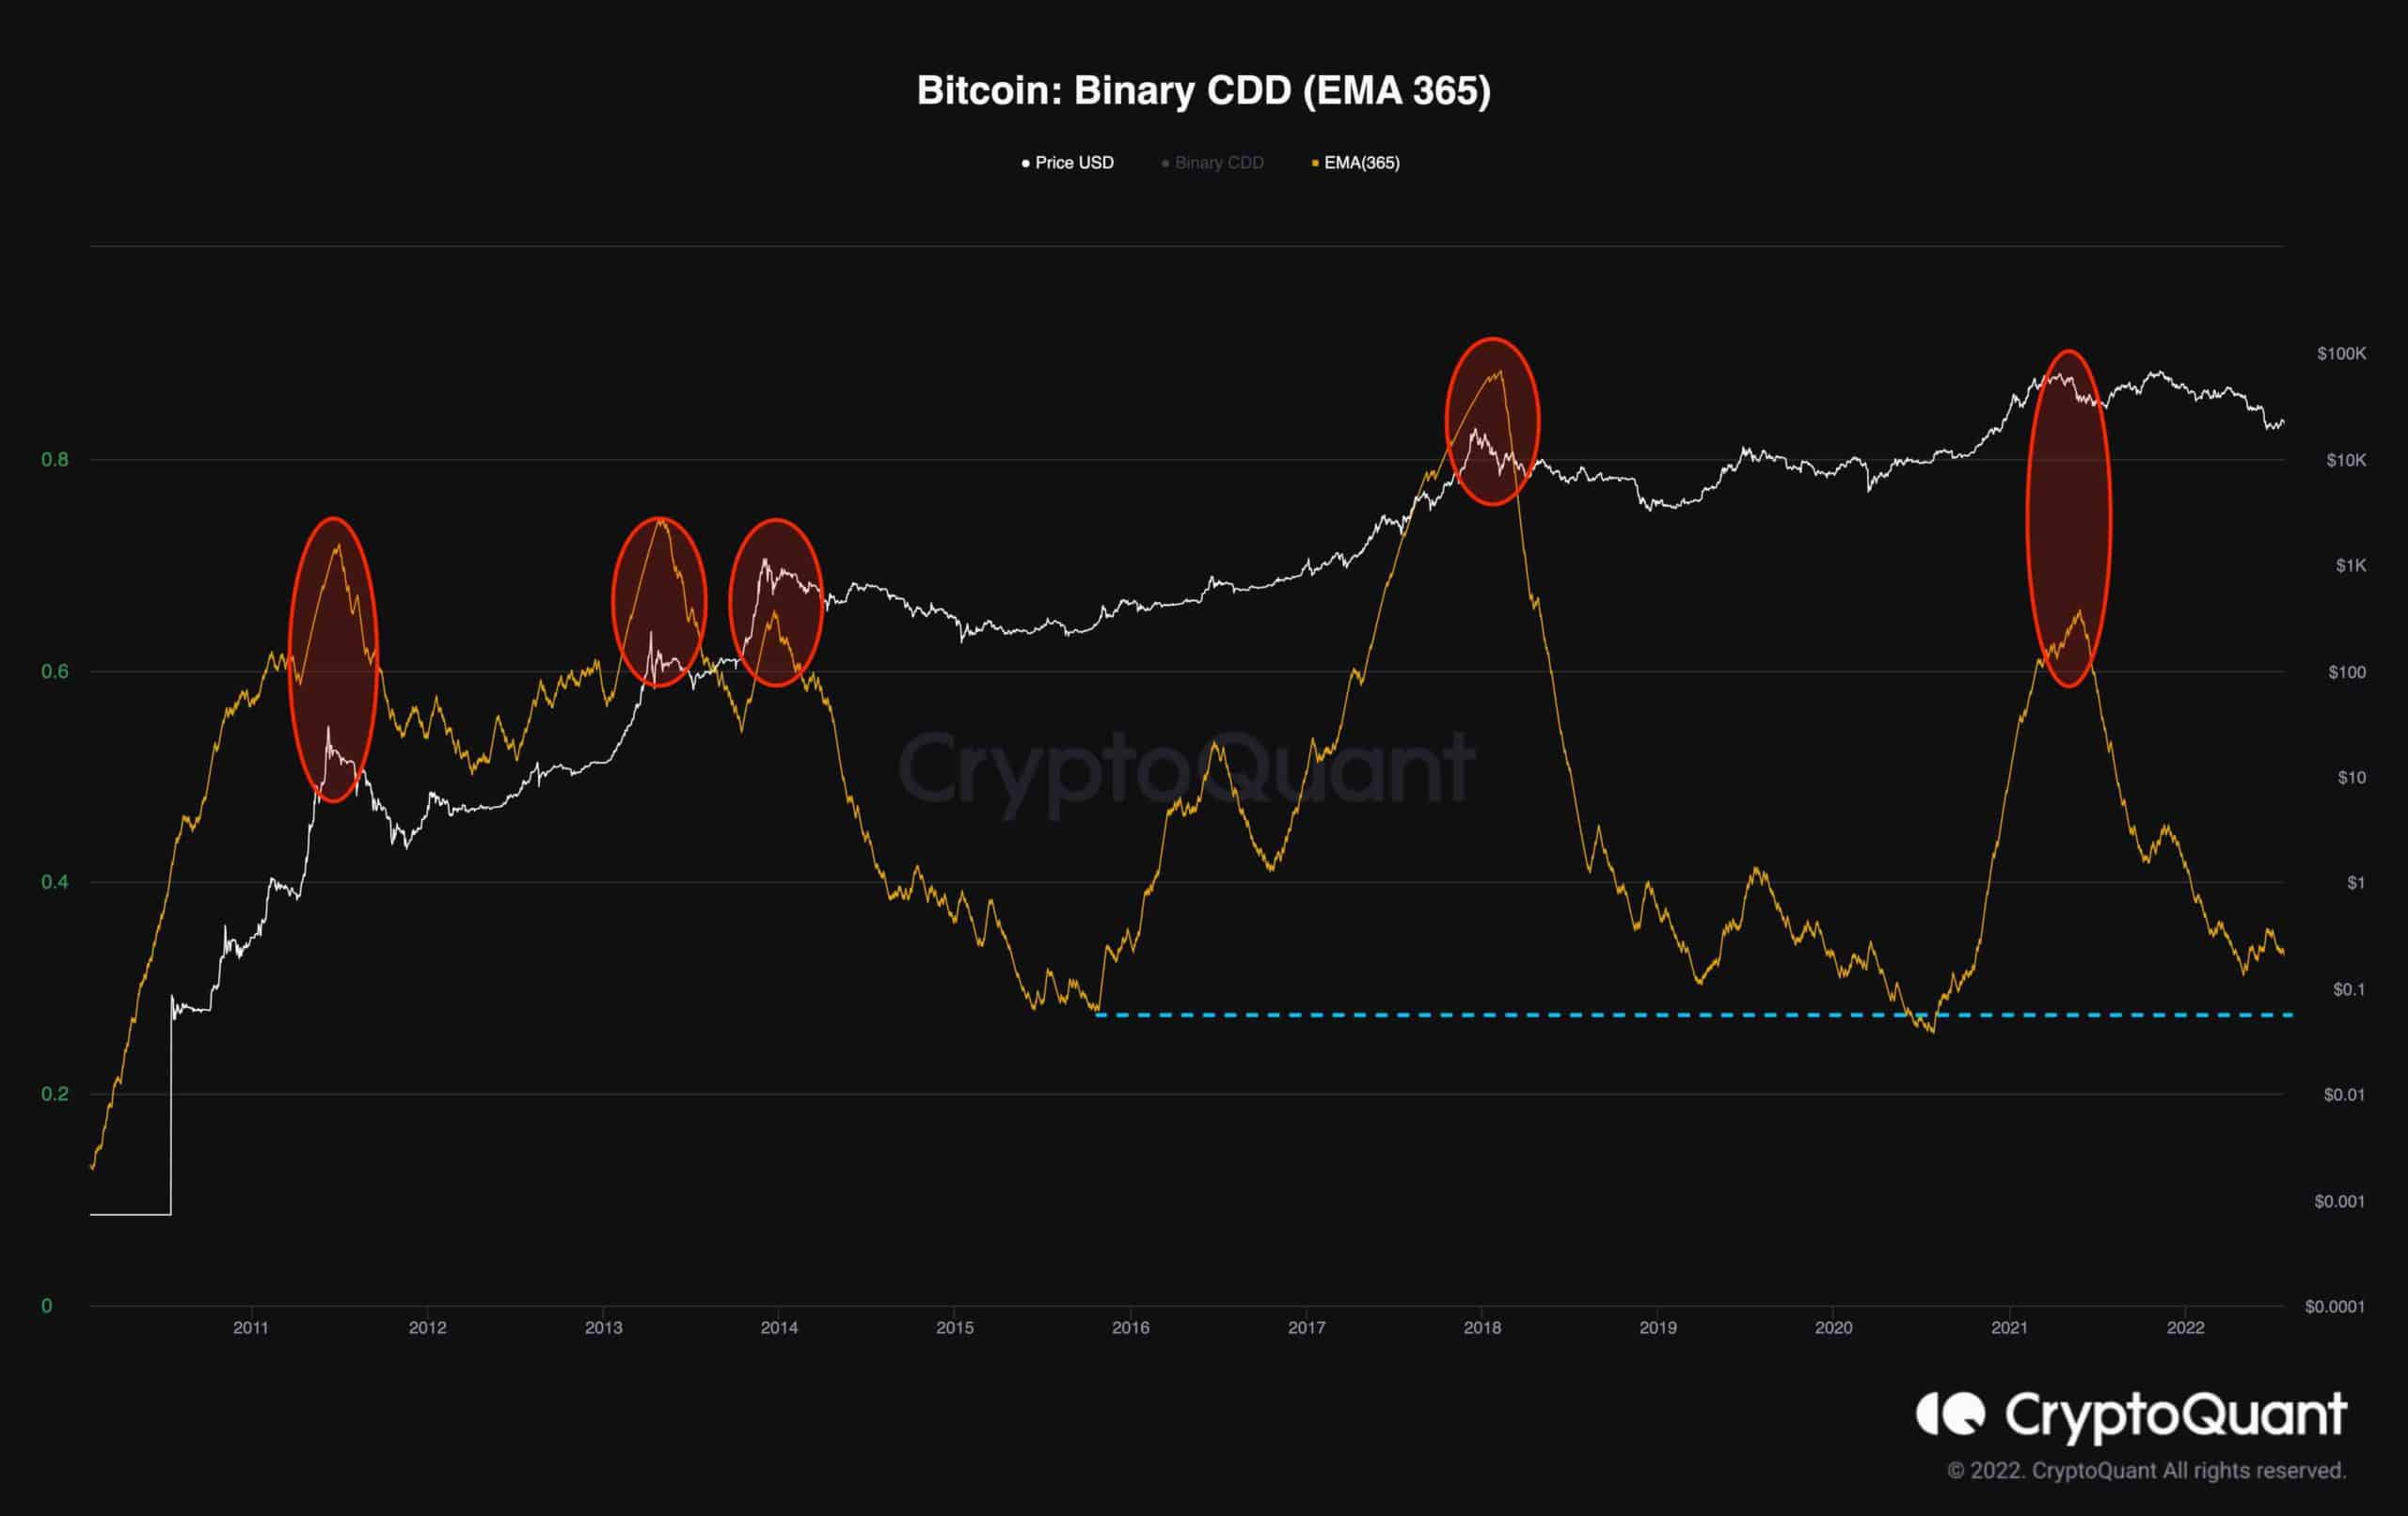
The market seems to be seeking trends, but the big players are remaining stationary. Examining their behavior typically helps identify current trends. This is demonstrated on the following Binary CDD metric(365-day exponential moving average) chart.
Binary Coin Days Destroyed is a binary value that points to ‘1’ if the Supply Adjusted Coin Days Destroyed is larger than the average Supply Adjusted Coin Days Destroyed and points to ‘0’ if not. It exhibits whether long-term holders’ movements are higher or lower than average.
Historically, the metric surged during the bullish rallies and marked a long-term pivot at the end of the bull market. Conversely, it nosedives during bear markets and registers a bottom at the end of the bearish rallies. Currently, the metric has experienced a massive shakeout, indicating that the long-term holders are relatively unmoving. However, considering the prior bear markets, there is still room for the price to decline and reach lower levels.
Therefore, given the market’s present turbulence and uncertainty, as well as the current state of the global economy’s recession, another leg down will be possible before the next bullish rally.